Mean State
Download Data |
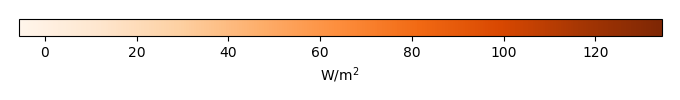
Period Mean (original grids) [W/m2] |
Model Period Mean (intersection) [W/m2] |
Model Period Mean (complement) [W/m2] |
Benchmark Period Mean (intersection) [W/m2] |
Benchmark Period Mean (complement) [W/m2] |
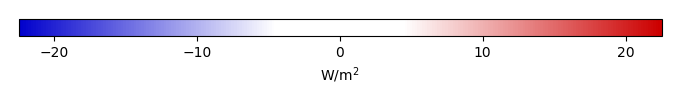
Bias [W/m2] |
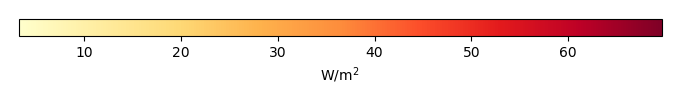
RMSE [W/m2] |
Phase Shift [months] |
Bias Score [1] |
RMSE Score [1] |
Seasonal Cycle Score [1] |
Spatial Distribution Score [1] |
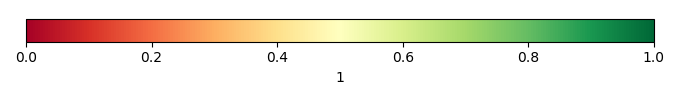
Overall Score [1] |
|||
|---|---|---|---|---|---|---|---|---|---|---|---|---|---|---|---|---|
| Benchmark | [-] | 70.6 | ||||||||||||||
| CRUNCEPv7 | [-] | 85.2 | 86.0 | 76.5 | 70.7 | 18.1 | 14.6 | 26.3 | 2.30 | 0.200 | 0.107 | 0.572 | 0.934 | 0.384 | ||
| GSWP3v1 | [-] | 75.3 | 76.1 | 66.4 | 70.7 | 18.1 | 4.68 | 17.5 | 1.39 | 0.284 | 0.153 | 0.799 | 0.992 | 0.476 | ||
| WFDEI | [-] | 69.6 | 70.3 | 69.4 | 70.7 | 18.1 | -0.800 | 15.4 | 1.37 | 0.398 | 0.175 | 0.797 | 0.988 | 0.507 |
Download Data |
Period Mean (original grids) [W/m2] |
Model Period Mean (intersection) [W/m2] |
Model Period Mean (complement) [W/m2] |
Benchmark Period Mean (intersection) [W/m2] |
Benchmark Period Mean (complement) [W/m2] |
Bias [W/m2] |
RMSE [W/m2] |
Phase Shift [months] |
Bias Score [1] |
RMSE Score [1] |
Seasonal Cycle Score [1] |
Spatial Distribution Score [1] |
Overall Score [1] |
|||
|---|---|---|---|---|---|---|---|---|---|---|---|---|---|---|---|---|
| Benchmark | [-] | 47.3 | ||||||||||||||
| CRUNCEPv7 | [-] | 53.1 | 52.3 | 43.4 | 47.3 | 34.2 | 4.76 | 20.6 | 0.953 | 0.730 | 0.484 | 0.822 | 0.988 | 0.702 | ||
| GSWP3v1 | [-] | 52.8 | 52.1 | 40.4 | 47.3 | 34.2 | 4.54 | 19.2 | 1.17 | 0.765 | 0.503 | 0.776 | 0.984 | 0.706 | ||
| WFDEI | [-] | 52.3 | 51.6 | 41.0 | 47.3 | 34.2 | 4.11 | 19.9 | 1.17 | 0.750 | 0.500 | 0.784 | 0.977 | 0.702 |
Download Data |
Period Mean (original grids) [W/m2] |
Model Period Mean (intersection) [W/m2] |
Model Period Mean (complement) [W/m2] |
Benchmark Period Mean (intersection) [W/m2] |
Benchmark Period Mean (complement) [W/m2] |
Bias [W/m2] |
RMSE [W/m2] |
Phase Shift [months] |
Bias Score [1] |
RMSE Score [1] |
Seasonal Cycle Score [1] |
Spatial Distribution Score [1] |
Overall Score [1] |
|||
|---|---|---|---|---|---|---|---|---|---|---|---|---|---|---|---|---|
| Benchmark | [-] | 52.1 | ||||||||||||||
| CRUNCEPv7 | [-] | 56.6 | 56.3 | 60.1 | 52.2 | 23.6 | 4.18 | 21.2 | 0.885 | 0.615 | 0.463 | 0.888 | 0.940 | 0.674 | ||
| GSWP3v1 | [-] | 55.4 | 55.4 | 52.8 | 52.2 | 23.6 | 3.06 | 18.4 | 1.00 | 0.661 | 0.491 | 0.855 | 0.976 | 0.695 | ||
| WFDEI | [-] | 55.3 | 55.1 | 58.3 | 52.2 | 23.6 | 2.96 | 19.0 | 1.25 | 0.670 | 0.494 | 0.811 | 0.968 | 0.688 |
Download Data |
Period Mean (original grids) [W/m2] |
Model Period Mean (intersection) [W/m2] |
Model Period Mean (complement) [W/m2] |
Benchmark Period Mean (intersection) [W/m2] |
Benchmark Period Mean (complement) [W/m2] |
Bias [W/m2] |
RMSE [W/m2] |
Phase Shift [months] |
Bias Score [1] |
RMSE Score [1] |
Seasonal Cycle Score [1] |
Spatial Distribution Score [1] |
Overall Score [1] |
|||
|---|---|---|---|---|---|---|---|---|---|---|---|---|---|---|---|---|
| Benchmark | [-] | 14.9 | ||||||||||||||
| CRUNCEPv7 | [-] | 12.5 | 12.7 | 8.29 | 15.0 | 3.59 | -2.56 | 9.12 | 0.0852 | 0.838 | 0.709 | 1.01 | 0.566 | 0.767 | ||
| GSWP3v1 | [-] | 14.0 | 14.2 | 10.9 | 15.0 | 3.59 | -0.908 | 10.2 | 0.179 | 0.882 | 0.657 | 1.01 | 0.510 | 0.743 | ||
| WFDEI | [-] | 8.77 | 8.90 | 7.15 | 15.0 | 3.59 | -6.10 | 11.8 | 0.150 | 0.714 | 0.667 | 1.01 | 0.544 | 0.720 |
Download Data |
Period Mean (original grids) [W/m2] |
Model Period Mean (intersection) [W/m2] |
Model Period Mean (complement) [W/m2] |
Benchmark Period Mean (intersection) [W/m2] |
Benchmark Period Mean (complement) [W/m2] |
Bias [W/m2] |
RMSE [W/m2] |
Phase Shift [months] |
Bias Score [1] |
RMSE Score [1] |
Seasonal Cycle Score [1] |
Spatial Distribution Score [1] |
Overall Score [1] |
|||
|---|---|---|---|---|---|---|---|---|---|---|---|---|---|---|---|---|
| Benchmark | [-] | 77.5 | ||||||||||||||
| CRUNCEPv7 | [-] | 130. | 131. | 129. | 80.4 | 34.5 | 49.5 | 51.1 | 2.30 | 0.0118 | 0.148 | 0.638 | 0.499 | 0.289 | ||
| GSWP3v1 | [-] | 104. | 103. | 105. | 80.4 | 34.5 | 23.2 | 27.9 | 2.19 | 0.254 | 0.174 | 0.659 | 0.291 | 0.310 | ||
| WFDEI | [-] | 105. | 104. | 112. | 80.4 | 34.5 | 25.2 | 30.3 | 2.29 | 0.228 | 0.160 | 0.639 | 0.481 | 0.334 |
Download Data |
Period Mean (original grids) [W/m2] |
Model Period Mean (intersection) [W/m2] |
Model Period Mean (complement) [W/m2] |
Benchmark Period Mean (intersection) [W/m2] |
Benchmark Period Mean (complement) [W/m2] |
Bias [W/m2] |
RMSE [W/m2] |
Phase Shift [months] |
Bias Score [1] |
RMSE Score [1] |
Seasonal Cycle Score [1] |
Spatial Distribution Score [1] |
Overall Score [1] |
|||
|---|---|---|---|---|---|---|---|---|---|---|---|---|---|---|---|---|
| Benchmark | [-] | 26.3 | ||||||||||||||
| CRUNCEPv7 | [-] | 27.5 | 27.5 | 22.2 | 26.3 | 3.49 | 1.16 | 10.9 | 0.450 | 0.902 | 0.696 | 0.970 | 0.993 | 0.851 | ||
| GSWP3v1 | [-] | 24.7 | 24.7 | 24.3 | 26.3 | 3.49 | -1.63 | 11.0 | 0.526 | 0.901 | 0.695 | 0.965 | 0.977 | 0.847 | ||
| WFDEI | [-] | 22.1 | 22.1 | 22.9 | 26.3 | 3.49 | -4.24 | 10.3 | 0.739 | 0.838 | 0.732 | 0.950 | 0.966 | 0.844 |
Download Data |
Period Mean (original grids) [W/m2] |
Model Period Mean (intersection) [W/m2] |
Model Period Mean (complement) [W/m2] |
Benchmark Period Mean (intersection) [W/m2] |
Benchmark Period Mean (complement) [W/m2] |
Bias [W/m2] |
RMSE [W/m2] |
Phase Shift [months] |
Bias Score [1] |
RMSE Score [1] |
Seasonal Cycle Score [1] |
Spatial Distribution Score [1] |
Overall Score [1] |
|||
|---|---|---|---|---|---|---|---|---|---|---|---|---|---|---|---|---|
| Benchmark | [-] | 28.0 | ||||||||||||||
| CRUNCEPv7 | [-] | 28.7 | 28.9 | 23.1 | 28.1 | 13.0 | 1.27 | 11.9 | 0.469 | 0.786 | 0.626 | 0.977 | 0.979 | 0.799 | ||
| GSWP3v1 | [-] | 25.1 | 25.3 | 19.4 | 28.1 | 13.0 | -2.36 | 11.0 | 0.487 | 0.722 | 0.698 | 0.974 | 0.923 | 0.803 | ||
| WFDEI | [-] | 25.6 | 25.7 | 22.7 | 28.1 | 13.0 | -1.98 | 12.2 | 0.565 | 0.720 | 0.657 | 0.966 | 0.923 | 0.785 |
Download Data |
Period Mean (original grids) [W/m2] |
Model Period Mean (intersection) [W/m2] |
Model Period Mean (complement) [W/m2] |
Benchmark Period Mean (intersection) [W/m2] |
Benchmark Period Mean (complement) [W/m2] |
Bias [W/m2] |
RMSE [W/m2] |
Phase Shift [months] |
Bias Score [1] |
RMSE Score [1] |
Seasonal Cycle Score [1] |
Spatial Distribution Score [1] |
Overall Score [1] |
|||
|---|---|---|---|---|---|---|---|---|---|---|---|---|---|---|---|---|
| Benchmark | [-] | 57.0 | ||||||||||||||
| CRUNCEPv7 | [-] | 71.7 | 70.9 | 90.1 | 57.2 | 29.3 | 16.4 | 28.4 | 0.924 | 0.471 | 0.391 | 0.885 | 0.908 | 0.609 | ||
| GSWP3v1 | [-] | 60.2 | 59.5 | 74.6 | 57.2 | 29.3 | 4.46 | 22.0 | 1.27 | 0.603 | 0.412 | 0.819 | 0.975 | 0.644 | ||
| WFDEI | [-] | 64.9 | 64.1 | 83.5 | 57.2 | 29.3 | 9.24 | 23.7 | 1.31 | 0.567 | 0.423 | 0.816 | 0.974 | 0.640 |
Download Data |
Period Mean (original grids) [W/m2] |
Model Period Mean (intersection) [W/m2] |
Model Period Mean (complement) [W/m2] |
Benchmark Period Mean (intersection) [W/m2] |
Benchmark Period Mean (complement) [W/m2] |
Bias [W/m2] |
RMSE [W/m2] |
Phase Shift [months] |
Bias Score [1] |
RMSE Score [1] |
Seasonal Cycle Score [1] |
Spatial Distribution Score [1] |
Overall Score [1] |
|||
|---|---|---|---|---|---|---|---|---|---|---|---|---|---|---|---|---|
| Benchmark | [-] | 15.7 | ||||||||||||||
| CRUNCEPv7 | [-] | 13.2 | 13.6 | 5.26 | 15.8 | -6.07 | -2.46 | 11.6 | 0.133 | 0.868 | 0.636 | 1.01 | 0.795 | 0.788 | ||
| GSWP3v1 | [-] | 14.7 | 15.1 | 8.46 | 15.8 | -6.07 | -0.918 | 14.1 | 0.159 | 0.895 | 0.562 | 1.00 | 0.743 | 0.753 | ||
| WFDEI | [-] | 8.14 | 8.48 | 2.34 | 15.8 | -6.07 | -7.43 | 14.1 | 0.144 | 0.704 | 0.616 | 1.00 | 0.695 | 0.727 |
Download Data |
Period Mean (original grids) [W/m2] |
Model Period Mean (intersection) [W/m2] |
Model Period Mean (complement) [W/m2] |
Benchmark Period Mean (intersection) [W/m2] |
Benchmark Period Mean (complement) [W/m2] |
Bias [W/m2] |
RMSE [W/m2] |
Phase Shift [months] |
Bias Score [1] |
RMSE Score [1] |
Seasonal Cycle Score [1] |
Spatial Distribution Score [1] |
Overall Score [1] |
|||
|---|---|---|---|---|---|---|---|---|---|---|---|---|---|---|---|---|
| Benchmark | [-] | 26.8 | ||||||||||||||
| CRUNCEPv7 | [-] | 32.8 | 31.9 | 49.9 | 26.9 | 19.3 | 6.64 | 15.0 | 0.550 | 0.645 | 0.473 | 0.948 | 0.869 | 0.682 | ||
| GSWP3v1 | [-] | 32.7 | 31.8 | 49.8 | 26.9 | 19.3 | 6.45 | 13.7 | 0.512 | 0.665 | 0.507 | 0.951 | 0.912 | 0.709 | ||
| WFDEI | [-] | 32.4 | 31.6 | 48.7 | 26.9 | 19.3 | 6.21 | 15.9 | 0.608 | 0.666 | 0.438 | 0.943 | 0.897 | 0.676 |
Download Data |
Period Mean (original grids) [W/m2] |
Model Period Mean (intersection) [W/m2] |
Model Period Mean (complement) [W/m2] |
Benchmark Period Mean (intersection) [W/m2] |
Benchmark Period Mean (complement) [W/m2] |
Bias [W/m2] |
RMSE [W/m2] |
Phase Shift [months] |
Bias Score [1] |
RMSE Score [1] |
Seasonal Cycle Score [1] |
Spatial Distribution Score [1] |
Overall Score [1] |
|||
|---|---|---|---|---|---|---|---|---|---|---|---|---|---|---|---|---|
| Benchmark | [-] | 31.2 | ||||||||||||||
| CRUNCEPv7 | [-] | 36.9 | 37.0 | 35.2 | 31.7 | 9.65 | 4.99 | 14.9 | 0.302 | 0.813 | 0.623 | 0.983 | 0.896 | 0.788 | ||
| GSWP3v1 | [-] | 33.8 | 33.9 | 32.9 | 31.7 | 9.65 | 2.09 | 12.3 | 0.303 | 0.827 | 0.687 | 0.982 | 0.854 | 0.807 | ||
| WFDEI | [-] | 30.0 | 29.9 | 32.7 | 31.7 | 9.65 | -1.60 | 13.8 | 0.360 | 0.774 | 0.670 | 0.981 | 0.919 | 0.803 |
Download Data |
Period Mean (original grids) [W/m2] |
Model Period Mean (intersection) [W/m2] |
Model Period Mean (complement) [W/m2] |
Benchmark Period Mean (intersection) [W/m2] |
Benchmark Period Mean (complement) [W/m2] |
Bias [W/m2] |
RMSE [W/m2] |
Phase Shift [months] |
Bias Score [1] |
RMSE Score [1] |
Seasonal Cycle Score [1] |
Spatial Distribution Score [1] |
Overall Score [1] |
|||
|---|---|---|---|---|---|---|---|---|---|---|---|---|---|---|---|---|
| Benchmark | [-] | 39.1 | ||||||||||||||
| CRUNCEPv7 | [-] | 38.5 | 45.7 | 8.34 | 39.4 | 16.4 | 6.84 | 17.9 | 0.760 | 0.522 | 0.422 | 0.862 | 0.921 | 0.630 | ||
| GSWP3v1 | [-] | 35.0 | 41.6 | 7.58 | 39.4 | 16.4 | 2.55 | 14.6 | 0.783 | 0.619 | 0.455 | 0.869 | 0.976 | 0.675 | ||
| WFDEI | [-] | 34.6 | 40.8 | 8.76 | 39.4 | 16.4 | 1.84 | 15.4 | 0.835 | 0.616 | 0.449 | 0.865 | 0.969 | 0.670 |
Download Data |
Period Mean (original grids) [W/m2] |
Model Period Mean (intersection) [W/m2] |
Model Period Mean (complement) [W/m2] |
Benchmark Period Mean (intersection) [W/m2] |
Benchmark Period Mean (complement) [W/m2] |
Bias [W/m2] |
RMSE [W/m2] |
Phase Shift [months] |
Bias Score [1] |
RMSE Score [1] |
Seasonal Cycle Score [1] |
Spatial Distribution Score [1] |
Overall Score [1] |
|||
|---|---|---|---|---|---|---|---|---|---|---|---|---|---|---|---|---|
| Benchmark | [-] | 8.45 | ||||||||||||||
| CRUNCEPv7 | [-] | 7.27 | 13.0 | 2.09 | 8.47 | 5.81 | 4.91 | 9.59 | 1.01 | 0.603 | 0.425 | 0.934 | 0.934 | 0.664 | ||
| GSWP3v1 | [-] | 7.81 | 13.0 | 3.16 | 8.47 | 5.81 | 4.84 | 9.53 | 1.06 | 0.606 | 0.451 | 0.939 | 0.924 | 0.674 | ||
| WFDEI | [-] | 8.91 | 15.1 | 3.32 | 8.47 | 5.81 | 6.95 | 11.9 | 1.03 | 0.570 | 0.372 | 0.939 | 0.920 | 0.635 |
Download Data |
Period Mean (original grids) [W/m2] |
Model Period Mean (intersection) [W/m2] |
Model Period Mean (complement) [W/m2] |
Benchmark Period Mean (intersection) [W/m2] |
Benchmark Period Mean (complement) [W/m2] |
Bias [W/m2] |
RMSE [W/m2] |
Phase Shift [months] |
Bias Score [1] |
RMSE Score [1] |
Seasonal Cycle Score [1] |
Spatial Distribution Score [1] |
Overall Score [1] |
|||
|---|---|---|---|---|---|---|---|---|---|---|---|---|---|---|---|---|
| Benchmark | [-] | 14.0 | ||||||||||||||
| CRUNCEPv7 | [-] | 12.2 | 12.6 | 5.09 | 14.0 | 1.27 | -1.86 | 10.7 | 0.211 | 0.818 | 0.620 | 0.998 | 0.851 | 0.781 | ||
| GSWP3v1 | [-] | 14.1 | 14.5 | 7.03 | 14.0 | 1.27 | 0.0514 | 11.7 | 0.312 | 0.837 | 0.596 | 0.987 | 0.787 | 0.761 | ||
| WFDEI | [-] | 9.65 | 9.99 | 3.47 | 14.0 | 1.27 | -4.31 | 11.8 | 0.456 | 0.730 | 0.608 | 0.978 | 0.787 | 0.742 |
Download Data |
Period Mean (original grids) [W/m2] |
Model Period Mean (intersection) [W/m2] |
Model Period Mean (complement) [W/m2] |
Benchmark Period Mean (intersection) [W/m2] |
Benchmark Period Mean (complement) [W/m2] |
Bias [W/m2] |
RMSE [W/m2] |
Phase Shift [months] |
Bias Score [1] |
RMSE Score [1] |
Seasonal Cycle Score [1] |
Spatial Distribution Score [1] |
Overall Score [1] |
|||
|---|---|---|---|---|---|---|---|---|---|---|---|---|---|---|---|---|
| Benchmark | [-] | 50.4 | ||||||||||||||
| CRUNCEPv7 | [-] | 64.2 | 63.3 | 75.7 | 50.9 | 20.2 | 16.2 | 30.0 | 0.842 | 0.384 | 0.278 | 0.887 | 0.833 | 0.532 | ||
| GSWP3v1 | [-] | 60.4 | 60.0 | 66.8 | 50.9 | 20.2 | 11.6 | 23.2 | 0.830 | 0.455 | 0.352 | 0.897 | 0.939 | 0.599 | ||
| WFDEI | [-] | 60.8 | 59.9 | 71.7 | 50.9 | 20.2 | 12.4 | 24.4 | 0.824 | 0.480 | 0.314 | 0.900 | 0.942 | 0.590 |
Download Data |
Period Mean (original grids) [W/m2] |
Model Period Mean (intersection) [W/m2] |
Model Period Mean (complement) [W/m2] |
Benchmark Period Mean (intersection) [W/m2] |
Benchmark Period Mean (complement) [W/m2] |
Bias [W/m2] |
RMSE [W/m2] |
Phase Shift [months] |
Bias Score [1] |
RMSE Score [1] |
Seasonal Cycle Score [1] |
Spatial Distribution Score [1] |
Overall Score [1] |
|||
|---|---|---|---|---|---|---|---|---|---|---|---|---|---|---|---|---|
| Benchmark | [-] | 49.7 | ||||||||||||||
| CRUNCEPv7 | [-] | 55.3 | 55.4 | 61.6 | 49.8 | 19.0 | 6.05 | 16.4 | 0.211 | 0.801 | 0.675 | 0.984 | 0.983 | 0.824 | ||
| GSWP3v1 | [-] | 50.6 | 50.6 | 58.1 | 49.8 | 19.0 | 1.19 | 13.6 | 0.173 | 0.832 | 0.742 | 0.988 | 0.965 | 0.854 | ||
| WFDEI | [-] | 51.9 | 51.9 | 60.4 | 49.8 | 19.0 | 2.53 | 16.3 | 0.209 | 0.855 | 0.661 | 0.986 | 0.953 | 0.824 |
Download Data |
Period Mean (original grids) [W/m2] |
Model Period Mean (intersection) [W/m2] |
Model Period Mean (complement) [W/m2] |
Benchmark Period Mean (intersection) [W/m2] |
Benchmark Period Mean (complement) [W/m2] |
Bias [W/m2] |
RMSE [W/m2] |
Phase Shift [months] |
Bias Score [1] |
RMSE Score [1] |
Seasonal Cycle Score [1] |
Spatial Distribution Score [1] |
Overall Score [1] |
|||
|---|---|---|---|---|---|---|---|---|---|---|---|---|---|---|---|---|
| Benchmark | [-] | 25.2 | ||||||||||||||
| CRUNCEPv7 | [-] | 30.5 | 30.6 | 32.0 | 25.4 | 10.7 | 5.12 | 13.3 | 0.136 | 0.802 | 0.633 | 0.992 | 0.983 | 0.809 | ||
| GSWP3v1 | [-] | 28.0 | 28.0 | 32.7 | 25.4 | 10.7 | 2.61 | 11.4 | 0.132 | 0.843 | 0.672 | 0.992 | 0.970 | 0.830 | ||
| WFDEI | [-] | 25.4 | 25.4 | 30.4 | 25.4 | 10.7 | -0.0423 | 11.7 | 0.201 | 0.835 | 0.665 | 0.988 | 0.979 | 0.827 |
Download Data |
Period Mean (original grids) [W/m2] |
Model Period Mean (intersection) [W/m2] |
Model Period Mean (complement) [W/m2] |
Benchmark Period Mean (intersection) [W/m2] |
Benchmark Period Mean (complement) [W/m2] |
Bias [W/m2] |
RMSE [W/m2] |
Phase Shift [months] |
Bias Score [1] |
RMSE Score [1] |
Seasonal Cycle Score [1] |
Spatial Distribution Score [1] |
Overall Score [1] |
|||
|---|---|---|---|---|---|---|---|---|---|---|---|---|---|---|---|---|
| Benchmark | [-] | 27.2 | ||||||||||||||
| CRUNCEPv7 | [-] | 25.1 | 25.5 | 33.5 | 27.2 | 14.3 | -1.56 | 9.82 | 0.541 | 0.758 | 0.628 | 0.952 | 0.968 | 0.787 | ||
| GSWP3v1 | [-] | 24.7 | 25.1 | 31.2 | 27.2 | 14.3 | -1.91 | 9.79 | 0.527 | 0.748 | 0.640 | 0.957 | 0.958 | 0.789 | ||
| WFDEI | [-] | 27.8 | 28.2 | 32.0 | 27.2 | 14.3 | 1.05 | 12.0 | 0.598 | 0.734 | 0.571 | 0.954 | 0.946 | 0.755 |
Download Data |
Period Mean (original grids) [W/m2] |
Model Period Mean (intersection) [W/m2] |
Model Period Mean (complement) [W/m2] |
Benchmark Period Mean (intersection) [W/m2] |
Benchmark Period Mean (complement) [W/m2] |
Bias [W/m2] |
RMSE [W/m2] |
Phase Shift [months] |
Bias Score [1] |
RMSE Score [1] |
Seasonal Cycle Score [1] |
Spatial Distribution Score [1] |
Overall Score [1] |
|||
|---|---|---|---|---|---|---|---|---|---|---|---|---|---|---|---|---|
| Benchmark | [-] | 90.0 | ||||||||||||||
| CRUNCEPv7 | [-] | 117. | 117. | 112. | 90.2 | 27.7 | 26.6 | 32.5 | 1.86 | 0.0717 | 0.142 | 0.728 | 0.927 | 0.402 | ||
| GSWP3v1 | [-] | 97.8 | 97.8 | 92.3 | 90.2 | 27.7 | 7.24 | 16.8 | 1.81 | 0.392 | 0.166 | 0.746 | 0.972 | 0.488 | ||
| WFDEI | [-] | 94.1 | 94.0 | 93.9 | 90.2 | 27.7 | 3.59 | 15.2 | 1.62 | 0.443 | 0.186 | 0.767 | 0.958 | 0.508 |
Download Data |
Period Mean (original grids) [W/m2] |
Model Period Mean (intersection) [W/m2] |
Model Period Mean (complement) [W/m2] |
Benchmark Period Mean (intersection) [W/m2] |
Benchmark Period Mean (complement) [W/m2] |
Bias [W/m2] |
RMSE [W/m2] |
Phase Shift [months] |
Bias Score [1] |
RMSE Score [1] |
Seasonal Cycle Score [1] |
Spatial Distribution Score [1] |
Overall Score [1] |
|||
|---|---|---|---|---|---|---|---|---|---|---|---|---|---|---|---|---|
| Benchmark | [-] | 69.7 | ||||||||||||||
| CRUNCEPv7 | [-] | 73.5 | 73.0 | 79.0 | 69.8 | 17.5 | 3.46 | 23.8 | 0.797 | 0.539 | 0.441 | 0.904 | 0.833 | 0.632 | ||
| GSWP3v1 | [-] | 67.6 | 67.3 | 68.9 | 69.8 | 17.5 | -2.30 | 18.8 | 0.851 | 0.688 | 0.485 | 0.912 | 0.978 | 0.709 | ||
| WFDEI | [-] | 71.6 | 71.2 | 73.4 | 69.8 | 17.5 | 1.62 | 18.3 | 0.808 | 0.653 | 0.502 | 0.911 | 0.952 | 0.704 |
Download Data |
Period Mean (original grids) [W/m2] |
Model Period Mean (intersection) [W/m2] |
Model Period Mean (complement) [W/m2] |
Benchmark Period Mean (intersection) [W/m2] |
Benchmark Period Mean (complement) [W/m2] |
Bias [W/m2] |
RMSE [W/m2] |
Phase Shift [months] |
Bias Score [1] |
RMSE Score [1] |
Seasonal Cycle Score [1] |
Spatial Distribution Score [1] |
Overall Score [1] |
|||
|---|---|---|---|---|---|---|---|---|---|---|---|---|---|---|---|---|
| Benchmark | [-] | 22.7 | ||||||||||||||
| CRUNCEPv7 | [-] | 23.5 | 23.8 | 15.3 | 23.0 | 8.02 | 1.33 | 12.8 | 0.747 | 0.495 | 0.446 | 0.941 | 0.923 | 0.650 | ||
| GSWP3v1 | [-] | 24.8 | 25.1 | 14.3 | 23.0 | 8.02 | 1.94 | 11.5 | 0.939 | 0.547 | 0.478 | 0.908 | 0.954 | 0.673 | ||
| WFDEI | [-] | 21.5 | 21.6 | 13.3 | 23.0 | 8.02 | -1.70 | 12.2 | 0.924 | 0.509 | 0.461 | 0.892 | 0.951 | 0.655 |
Temporally integrated period mean