Mean State
Download Data |
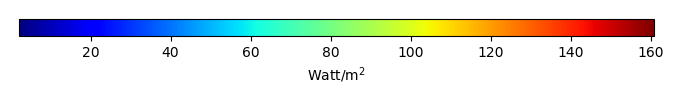
Period Mean (original grids) [Watt/m2] |
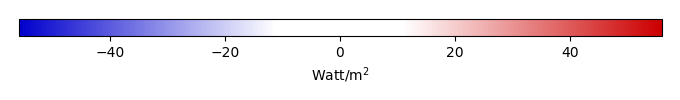
Bias [Watt/m2] |
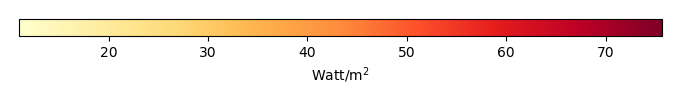
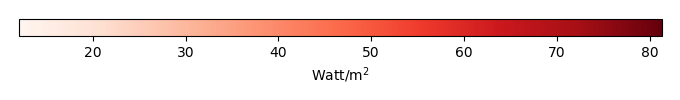
RMSE [Watt/m2] |
Phase Shift [months] |
Bias Score [1] |
RMSE Score [1] |
Seasonal Cycle Score [1] |
Interannual Variability Score [1] |
Overall Score [1] |
|||
|---|---|---|---|---|---|---|---|---|---|---|---|---|
| Benchmark | [-] | 131. | ||||||||||
| CRUNCEPv7 | [-] | 116. | -22.1 | 31.4 | 0.00 | 0.220 | 0.535 | 1.00 | 0.337 | 0.525 | ||
| GSWP3v1 | [-] | 95.7 | -39.8 | 43.5 | 0.00 | 0.115 | 0.571 | 1.00 | 0.734 | 0.598 | ||
| WFDEI | [-] | 112. | -23.2 | 29.1 | 1.03 | 0.212 | 0.536 | 0.930 | 0.334 | 0.510 |
Download Data |
Period Mean (original grids) [Watt/m2] |
Bias [Watt/m2] |
RMSE [Watt/m2] |
Phase Shift [months] |
Bias Score [1] |
RMSE Score [1] |
Seasonal Cycle Score [1] |
Interannual Variability Score [1] |
Overall Score [1] |
|||
|---|---|---|---|---|---|---|---|---|---|---|---|---|
| Benchmark | [-] | 54.1 | ||||||||||
| CRUNCEPv7 | [-] | 7.82 | -46.3 | 37.3 | 1.02 | 0.406 | 0.505 | 0.933 | 0.875 | 0.645 | ||
| GSWP3v1 | [-] | 23.6 | -30.4 | 27.2 | 0.00 | 0.552 | 0.560 | 1.00 | 0.930 | 0.721 | ||
| WFDEI | [-] | -1.83 | -55.9 | 46.6 | 1.02 | 0.336 | 0.509 | 0.933 | 0.997 | 0.657 |
Download Data |
Period Mean (original grids) [Watt/m2] |
Bias [Watt/m2] |
RMSE [Watt/m2] |
Phase Shift [months] |
Bias Score [1] |
RMSE Score [1] |
Seasonal Cycle Score [1] |
Interannual Variability Score [1] |
Overall Score [1] |
|||
|---|---|---|---|---|---|---|---|---|---|---|---|---|
| Benchmark | [-] | 147. | ||||||||||
| CRUNCEPv7 | [-] | 162. | 15.4 | 25.5 | 1.02 | 0.443 | 0.362 | 0.933 | 0.638 | 0.547 | ||
| GSWP3v1 | [-] | 134. | -13.1 | 26.2 | 4.08 | 0.500 | 0.286 | 0.244 | 0.683 | 0.400 | ||
| WFDEI | [-] | 141. | -5.80 | 23.8 | 4.08 | 0.735 | 0.286 | 0.244 | 0.747 | 0.460 |
Download Data |
Period Mean (original grids) [Watt/m2] |
Bias [Watt/m2] |
RMSE [Watt/m2] |
Phase Shift [months] |
Bias Score [1] |
RMSE Score [1] |
Seasonal Cycle Score [1] |
Interannual Variability Score [1] |
Overall Score [1] |
|||
|---|---|---|---|---|---|---|---|---|---|---|---|---|
| Benchmark | [-] | 42.7 | ||||||||||
| CRUNCEPv7 | [-] | 36.8 | -7.42 | 41.5 | 0.00 | 0.432 | 0.444 | 1.00 | 0.325 | 0.529 | ||
| GSWP3v1 | [-] | 44.1 | 2.13 | 34.2 | 0.00 | 0.480 | 0.514 | 1.00 | 0.391 | 0.580 | ||
| WFDEI | [-] | 25.1 | -20.2 | 40.3 | 0.00 | 0.674 | 0.491 | 1.00 | 0.357 | 0.603 |
Download Data |
Period Mean (original grids) [Watt/m2] |
Bias [Watt/m2] |
RMSE [Watt/m2] |
Phase Shift [months] |
Bias Score [1] |
RMSE Score [1] |
Seasonal Cycle Score [1] |
Interannual Variability Score [1] |
Overall Score [1] |
|||
|---|---|---|---|---|---|---|---|---|---|---|---|---|
| Benchmark | [-] | 119. | ||||||||||
| CRUNCEPv7 | [-] | 120. | 0.783 | 18.1 | 0.00 | 0.788 | 0.637 | 1.00 | 0.977 | 0.808 | ||
| GSWP3v1 | [-] | 120. | 1.21 | 16.1 | 0.00 | 0.905 | 0.646 | 1.00 | 0.874 | 0.814 | ||
| WFDEI | [-] | 122. | 2.79 | 20.4 | 0.517 | 0.757 | 0.593 | 0.965 | 0.860 | 0.754 |
Download Data |
Period Mean (original grids) [Watt/m2] |
Bias [Watt/m2] |
RMSE [Watt/m2] |
Phase Shift [months] |
Bias Score [1] |
RMSE Score [1] |
Seasonal Cycle Score [1] |
Interannual Variability Score [1] |
Overall Score [1] |
|||
|---|---|---|---|---|---|---|---|---|---|---|---|---|
| Benchmark | [-] | 67.2 | ||||||||||
| CRUNCEPv7 | [-] | 66.2 | -1.65 | 30.0 | 0.399 | 0.768 | 0.632 | 0.971 | 0.751 | 0.751 | ||
| GSWP3v1 | [-] | 59.7 | -8.15 | 26.6 | 0.259 | 0.748 | 0.695 | 0.981 | 0.855 | 0.794 | ||
| WFDEI | [-] | 52.6 | -15.4 | 32.8 | 0.458 | 0.689 | 0.637 | 0.967 | 0.785 | 0.743 |
Download Data |
Period Mean (original grids) [Watt/m2] |
Bias [Watt/m2] |
RMSE [Watt/m2] |
Phase Shift [months] |
Bias Score [1] |
RMSE Score [1] |
Seasonal Cycle Score [1] |
Interannual Variability Score [1] |
Overall Score [1] |
|||
|---|---|---|---|---|---|---|---|---|---|---|---|---|
| Benchmark | [-] | 74.8 | ||||||||||
| CRUNCEPv7 | [-] | 72.0 | -3.28 | 30.3 | 0.387 | 0.740 | 0.626 | 0.969 | 0.737 | 0.739 | ||
| GSWP3v1 | [-] | 67.9 | -7.24 | 26.3 | 0.377 | 0.743 | 0.686 | 0.962 | 0.850 | 0.785 | ||
| WFDEI | [-] | 62.5 | -12.9 | 32.9 | 0.509 | 0.693 | 0.622 | 0.951 | 0.755 | 0.729 |
Download Data |
Period Mean (original grids) [Watt/m2] |
Bias [Watt/m2] |
RMSE [Watt/m2] |
Phase Shift [months] |
Bias Score [1] |
RMSE Score [1] |
Seasonal Cycle Score [1] |
Interannual Variability Score [1] |
Overall Score [1] |
|||
|---|---|---|---|---|---|---|---|---|---|---|---|---|
| Benchmark | [-] | 117. | ||||||||||
| CRUNCEPv7 | [-] | 81.8 | -35.3 | 37.7 | 0.00 | 0.522 | 0.730 | 1.00 | 0.797 | 0.756 | ||
| GSWP3v1 | [-] | 64.3 | -52.8 | 57.7 | 0.00 | 0.378 | 0.625 | 1.00 | 0.718 | 0.669 | ||
| WFDEI | [-] | 84.9 | -32.1 | 34.7 | 0.00 | 0.553 | 0.741 | 1.00 | 0.835 | 0.774 |
Download Data |
Period Mean (original grids) [Watt/m2] |
Bias [Watt/m2] |
RMSE [Watt/m2] |
Phase Shift [months] |
Bias Score [1] |
RMSE Score [1] |
Seasonal Cycle Score [1] |
Interannual Variability Score [1] |
Overall Score [1] |
|||
|---|---|---|---|---|---|---|---|---|---|---|---|---|
| Benchmark | [-] | 85.0 | ||||||||||
| CRUNCEPv7 | [-] | 85.5 | 0.951 | 32.0 | 0.509 | 0.792 | 0.606 | 0.945 | 0.701 | 0.730 | ||
| GSWP3v1 | [-] | 82.9 | -1.79 | 26.0 | 0.662 | 0.807 | 0.681 | 0.939 | 0.847 | 0.791 | ||
| WFDEI | [-] | 80.5 | -3.94 | 33.5 | 0.560 | 0.794 | 0.586 | 0.930 | 0.681 | 0.715 |
Download Data |
Period Mean (original grids) [Watt/m2] |
Bias [Watt/m2] |
RMSE [Watt/m2] |
Phase Shift [months] |
Bias Score [1] |
RMSE Score [1] |
Seasonal Cycle Score [1] |
Interannual Variability Score [1] |
Overall Score [1] |
|||
|---|---|---|---|---|---|---|---|---|---|---|---|---|
| Benchmark | [-] | 68.6 | ||||||||||
| CRUNCEPv7 | [-] | 56.5 | -12.1 | 28.4 | 0.290 | 0.788 | 0.655 | 0.981 | 0.768 | 0.769 | ||
| GSWP3v1 | [-] | 60.3 | -8.28 | 20.7 | 0.218 | 0.837 | 0.737 | 0.986 | 0.926 | 0.845 | ||
| WFDEI | [-] | 45.8 | -22.8 | 32.4 | 0.218 | 0.683 | 0.673 | 0.986 | 0.821 | 0.767 |
Download Data |
Period Mean (original grids) [Watt/m2] |
Bias [Watt/m2] |
RMSE [Watt/m2] |
Phase Shift [months] |
Bias Score [1] |
RMSE Score [1] |
Seasonal Cycle Score [1] |
Interannual Variability Score [1] |
Overall Score [1] |
|||
|---|---|---|---|---|---|---|---|---|---|---|---|---|
| Benchmark | [-] | 82.6 | ||||||||||
| CRUNCEPv7 | [-] | 79.6 | -3.06 | 26.9 | 0.339 | 0.701 | 0.721 | 0.978 | 0.894 | 0.803 | ||
| GSWP3v1 | [-] | 78.6 | -4.07 | 28.9 | 0.681 | 0.661 | 0.736 | 0.904 | 0.880 | 0.783 | ||
| WFDEI | [-] | 89.3 | 6.65 | 32.1 | 0.850 | 0.685 | 0.670 | 0.893 | 0.820 | 0.748 |
Download Data |
Period Mean (original grids) [Watt/m2] |
Bias [Watt/m2] |
RMSE [Watt/m2] |
Phase Shift [months] |
Bias Score [1] |
RMSE Score [1] |
Seasonal Cycle Score [1] |
Interannual Variability Score [1] |
Overall Score [1] |
|||
|---|---|---|---|---|---|---|---|---|---|---|---|---|
| Benchmark | [-] | 117. | ||||||||||
| CRUNCEPv7 | [-] | 161. | 44.7 | 54.3 | 0.00 | 0.268 | 0.417 | 1.00 | 0.517 | 0.524 | ||
| GSWP3v1 | [-] | 133. | 16.5 | 37.7 | 0.00 | 0.615 | 0.389 | 1.00 | 0.628 | 0.604 | ||
| WFDEI | [-] | 141. | 24.8 | 41.5 | 1.02 | 0.481 | 0.373 | 0.933 | 0.676 | 0.567 |
Temporally integrated period mean