Mean State
Download Data |
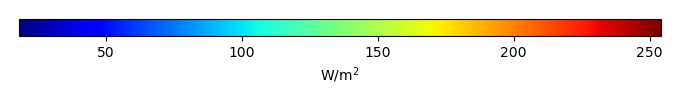
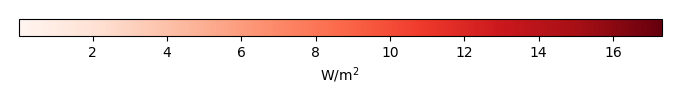
Period Mean (original grids) [W/m2] |
Model Period Mean (intersection) [W/m2] |
Model Period Mean (complement) [W/m2] |
Benchmark Period Mean (intersection) [W/m2] |
Benchmark Period Mean (complement) [W/m2] |
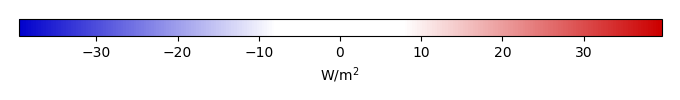
Bias [W/m2] |
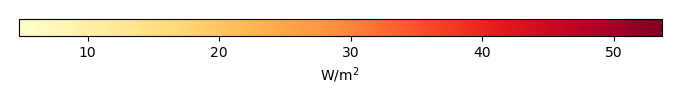
RMSE [W/m2] |
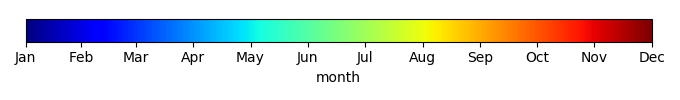
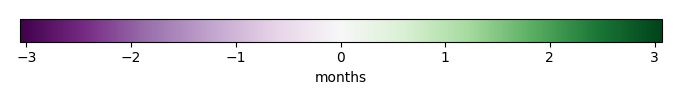
Phase Shift [months] |
Bias Score [1] |
RMSE Score [1] |
Seasonal Cycle Score [1] |
Spatial Distribution Score [1] |
Interannual Variability Score [1] |
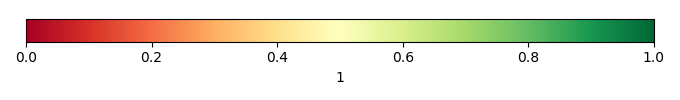
Overall Score [1] |
|||
|---|---|---|---|---|---|---|---|---|---|---|---|---|---|---|---|---|---|
| Benchmark | [-] | 187. | |||||||||||||||
| CRUNCEPv7 | [-] | 192. | 192. | 186. | 206. | 5.63 | 16.6 | 1.10 | 0.616 | 0.486 | 0.858 | 0.955 | 0.476 | 0.646 | |||
| GSWP3v1 | [-] | 182. | 182. | 186. | 206. | -4.31 | 15.3 | 0.775 | 0.727 | 0.494 | 0.907 | 0.924 | 0.800 | 0.724 | |||
| WFDEI | [-] | 167. | 167. | 186. | 206. | -18.6 | 28.6 | 1.40 | 0.388 | 0.374 | 0.799 | 0.952 | 0.776 | 0.611 |
Download Data |
Period Mean (original grids) [W/m2] |
Model Period Mean (intersection) [W/m2] |
Model Period Mean (complement) [W/m2] |
Benchmark Period Mean (intersection) [W/m2] |
Benchmark Period Mean (complement) [W/m2] |
Bias [W/m2] |
RMSE [W/m2] |
Phase Shift [months] |
Bias Score [1] |
RMSE Score [1] |
Seasonal Cycle Score [1] |
Spatial Distribution Score [1] |
Interannual Variability Score [1] |
Overall Score [1] |
|||
|---|---|---|---|---|---|---|---|---|---|---|---|---|---|---|---|---|---|
| Benchmark | [-] | 198. | |||||||||||||||
| CRUNCEPv7 | [-] | 198. | 198. | 198. | 214. | 0.100 | 18.7 | 1.51 | 0.569 | 0.472 | 0.781 | 0.931 | 0.725 | 0.658 | |||
| GSWP3v1 | [-] | 194. | 194. | 198. | 214. | -3.39 | 14.2 | 0.702 | 0.718 | 0.513 | 0.923 | 0.979 | 0.833 | 0.747 | |||
| WFDEI | [-] | 190. | 190. | 198. | 214. | -7.32 | 20.3 | 0.916 | 0.553 | 0.454 | 0.895 | 0.995 | 0.809 | 0.693 |
Download Data |
Period Mean (original grids) [W/m2] |
Model Period Mean (intersection) [W/m2] |
Model Period Mean (complement) [W/m2] |
Benchmark Period Mean (intersection) [W/m2] |
Benchmark Period Mean (complement) [W/m2] |
Bias [W/m2] |
RMSE [W/m2] |
Phase Shift [months] |
Bias Score [1] |
RMSE Score [1] |
Seasonal Cycle Score [1] |
Spatial Distribution Score [1] |
Interannual Variability Score [1] |
Overall Score [1] |
|||
|---|---|---|---|---|---|---|---|---|---|---|---|---|---|---|---|---|---|
| Benchmark | [-] | 199. | |||||||||||||||
| CRUNCEPv7 | [-] | 195. | 195. | 198. | 219. | -2.87 | 17.1 | 1.13 | 0.713 | 0.557 | 0.837 | 0.850 | 0.527 | 0.674 | |||
| GSWP3v1 | [-] | 196. | 197. | 198. | 219. | -2.35 | 15.5 | 0.774 | 0.801 | 0.568 | 0.893 | 0.995 | 0.744 | 0.762 | |||
| WFDEI | [-] | 196. | 196. | 198. | 219. | -2.31 | 21.1 | 1.13 | 0.715 | 0.470 | 0.832 | 0.988 | 0.730 | 0.701 |
Download Data |
Period Mean (original grids) [W/m2] |
Model Period Mean (intersection) [W/m2] |
Model Period Mean (complement) [W/m2] |
Benchmark Period Mean (intersection) [W/m2] |
Benchmark Period Mean (complement) [W/m2] |
Bias [W/m2] |
RMSE [W/m2] |
Phase Shift [months] |
Bias Score [1] |
RMSE Score [1] |
Seasonal Cycle Score [1] |
Spatial Distribution Score [1] |
Interannual Variability Score [1] |
Overall Score [1] |
|||
|---|---|---|---|---|---|---|---|---|---|---|---|---|---|---|---|---|---|
| Benchmark | [-] | 70.7 | |||||||||||||||
| CRUNCEPv7 | [-] | 72.8 | 72.9 | 70.5 | 72.8 | 1.13 | 20.4 | 0.333 | 0.910 | 0.748 | 0.978 | 0.995 | 0.710 | 0.848 | |||
| GSWP3v1 | [-] | 70.3 | 70.4 | 70.5 | 72.8 | -0.648 | 18.5 | 0.319 | 0.934 | 0.761 | 0.979 | 0.998 | 0.763 | 0.866 | |||
| WFDEI | [-] | 60.0 | 60.2 | 70.5 | 72.8 | -10.7 | 23.4 | 0.382 | 0.849 | 0.732 | 0.974 | 0.987 | 0.845 | 0.853 |
Download Data |
Period Mean (original grids) [W/m2] |
Model Period Mean (intersection) [W/m2] |
Model Period Mean (complement) [W/m2] |
Benchmark Period Mean (intersection) [W/m2] |
Benchmark Period Mean (complement) [W/m2] |
Bias [W/m2] |
RMSE [W/m2] |
Phase Shift [months] |
Bias Score [1] |
RMSE Score [1] |
Seasonal Cycle Score [1] |
Spatial Distribution Score [1] |
Interannual Variability Score [1] |
Overall Score [1] |
|||
|---|---|---|---|---|---|---|---|---|---|---|---|---|---|---|---|---|---|
| Benchmark | [-] | 194. | |||||||||||||||
| CRUNCEPv7 | [-] | 187. | 187. | 190. | 207. | -0.526 | 18.0 | 1.52 | 0.610 | 0.443 | 0.765 | 0.843 | 0.519 | 0.604 | |||
| GSWP3v1 | [-] | 176. | 176. | 190. | 207. | -10.3 | 18.7 | 1.27 | 0.569 | 0.436 | 0.800 | 0.963 | 0.769 | 0.662 | |||
| WFDEI | [-] | 165. | 165. | 190. | 207. | -21.0 | 28.1 | 1.67 | 0.362 | 0.390 | 0.742 | 0.991 | 0.686 | 0.593 |
Download Data |
Period Mean (original grids) [W/m2] |
Model Period Mean (intersection) [W/m2] |
Model Period Mean (complement) [W/m2] |
Benchmark Period Mean (intersection) [W/m2] |
Benchmark Period Mean (complement) [W/m2] |
Bias [W/m2] |
RMSE [W/m2] |
Phase Shift [months] |
Bias Score [1] |
RMSE Score [1] |
Seasonal Cycle Score [1] |
Spatial Distribution Score [1] |
Interannual Variability Score [1] |
Overall Score [1] |
|||
|---|---|---|---|---|---|---|---|---|---|---|---|---|---|---|---|---|---|
| Benchmark | [-] | 97.8 | |||||||||||||||
| CRUNCEPv7 | [-] | 109. | 109. | 97.6 | 118. | 11.2 | 20.9 | 0.260 | 0.845 | 0.794 | 0.983 | 0.995 | 0.716 | 0.854 | |||
| GSWP3v1 | [-] | 102. | 102. | 97.6 | 118. | 4.51 | 14.6 | 0.227 | 0.926 | 0.827 | 0.985 | 0.995 | 0.668 | 0.871 | |||
| WFDEI | [-] | 94.7 | 94.7 | 97.6 | 118. | -2.51 | 18.3 | 0.358 | 0.934 | 0.772 | 0.976 | 0.984 | 0.798 | 0.873 |
Download Data |
Period Mean (original grids) [W/m2] |
Model Period Mean (intersection) [W/m2] |
Model Period Mean (complement) [W/m2] |
Benchmark Period Mean (intersection) [W/m2] |
Benchmark Period Mean (complement) [W/m2] |
Bias [W/m2] |
RMSE [W/m2] |
Phase Shift [months] |
Bias Score [1] |
RMSE Score [1] |
Seasonal Cycle Score [1] |
Spatial Distribution Score [1] |
Interannual Variability Score [1] |
Overall Score [1] |
|||
|---|---|---|---|---|---|---|---|---|---|---|---|---|---|---|---|---|---|
| Benchmark | [-] | 139. | |||||||||||||||
| CRUNCEPv7 | [-] | 149. | 149. | 138. | 149. | 11.1 | 23.8 | 0.446 | 0.752 | 0.744 | 0.960 | 0.973 | 0.716 | 0.815 | |||
| GSWP3v1 | [-] | 136. | 136. | 138. | 149. | -2.20 | 15.9 | 0.348 | 0.880 | 0.767 | 0.970 | 0.999 | 0.670 | 0.842 | |||
| WFDEI | [-] | 142. | 141. | 138. | 149. | 3.22 | 23.6 | 0.527 | 0.826 | 0.677 | 0.951 | 0.950 | 0.770 | 0.808 |
Download Data |
Period Mean (original grids) [W/m2] |
Model Period Mean (intersection) [W/m2] |
Model Period Mean (complement) [W/m2] |
Benchmark Period Mean (intersection) [W/m2] |
Benchmark Period Mean (complement) [W/m2] |
Bias [W/m2] |
RMSE [W/m2] |
Phase Shift [months] |
Bias Score [1] |
RMSE Score [1] |
Seasonal Cycle Score [1] |
Spatial Distribution Score [1] |
Interannual Variability Score [1] |
Overall Score [1] |
|||
|---|---|---|---|---|---|---|---|---|---|---|---|---|---|---|---|---|---|
| Benchmark | [-] | 181. | |||||||||||||||
| CRUNCEPv7 | [-] | 194. | 194. | 179. | 205. | 14.7 | 26.0 | 0.341 | 0.568 | 0.584 | 0.973 | 0.964 | 0.652 | 0.721 | |||
| GSWP3v1 | [-] | 175. | 175. | 179. | 205. | -3.00 | 18.1 | 0.342 | 0.776 | 0.609 | 0.973 | 0.946 | 0.723 | 0.772 | |||
| WFDEI | [-] | 175. | 175. | 179. | 205. | -3.64 | 24.6 | 0.502 | 0.688 | 0.518 | 0.959 | 0.998 | 0.711 | 0.732 |
Download Data |
Period Mean (original grids) [W/m2] |
Model Period Mean (intersection) [W/m2] |
Model Period Mean (complement) [W/m2] |
Benchmark Period Mean (intersection) [W/m2] |
Benchmark Period Mean (complement) [W/m2] |
Bias [W/m2] |
RMSE [W/m2] |
Phase Shift [months] |
Bias Score [1] |
RMSE Score [1] |
Seasonal Cycle Score [1] |
Spatial Distribution Score [1] |
Interannual Variability Score [1] |
Overall Score [1] |
|||
|---|---|---|---|---|---|---|---|---|---|---|---|---|---|---|---|---|---|
| Benchmark | [-] | 62.8 | |||||||||||||||
| CRUNCEPv7 | [-] | 64.2 | 64.7 | 63.2 | 54.4 | 0.281 | 20.6 | 0.281 | 0.924 | 0.732 | 0.981 | 0.960 | 0.754 | 0.847 | |||
| GSWP3v1 | [-] | 61.3 | 61.7 | 63.2 | 54.4 | -2.47 | 16.4 | 0.176 | 0.941 | 0.777 | 0.988 | 0.984 | 0.759 | 0.871 | |||
| WFDEI | [-] | 50.5 | 51.0 | 63.2 | 54.4 | -13.1 | 24.3 | 0.308 | 0.815 | 0.721 | 0.980 | 0.993 | 0.848 | 0.846 |
Download Data |
Period Mean (original grids) [W/m2] |
Model Period Mean (intersection) [W/m2] |
Model Period Mean (complement) [W/m2] |
Benchmark Period Mean (intersection) [W/m2] |
Benchmark Period Mean (complement) [W/m2] |
Bias [W/m2] |
RMSE [W/m2] |
Phase Shift [months] |
Bias Score [1] |
RMSE Score [1] |
Seasonal Cycle Score [1] |
Spatial Distribution Score [1] |
Interannual Variability Score [1] |
Overall Score [1] |
|||
|---|---|---|---|---|---|---|---|---|---|---|---|---|---|---|---|---|---|
| Benchmark | [-] | 198. | |||||||||||||||
| CRUNCEPv7 | [-] | 194. | 194. | 198. | 197. | -5.32 | 15.0 | 0.501 | 0.837 | 0.776 | 0.966 | 0.967 | 0.650 | 0.829 | |||
| GSWP3v1 | [-] | 190. | 190. | 198. | 197. | -9.01 | 16.6 | 0.371 | 0.822 | 0.764 | 0.971 | 1.00 | 0.706 | 0.838 | |||
| WFDEI | [-] | 194. | 194. | 198. | 197. | -5.97 | 19.9 | 0.422 | 0.862 | 0.682 | 0.969 | 0.998 | 0.810 | 0.834 |
Download Data |
Period Mean (original grids) [W/m2] |
Model Period Mean (intersection) [W/m2] |
Model Period Mean (complement) [W/m2] |
Benchmark Period Mean (intersection) [W/m2] |
Benchmark Period Mean (complement) [W/m2] |
Bias [W/m2] |
RMSE [W/m2] |
Phase Shift [months] |
Bias Score [1] |
RMSE Score [1] |
Seasonal Cycle Score [1] |
Spatial Distribution Score [1] |
Interannual Variability Score [1] |
Overall Score [1] |
|||
|---|---|---|---|---|---|---|---|---|---|---|---|---|---|---|---|---|---|
| Benchmark | [-] | 120. | |||||||||||||||
| CRUNCEPv7 | [-] | 133. | 133. | 118. | 145. | 15.5 | 24.9 | 0.231 | 0.764 | 0.800 | 0.985 | 0.995 | 0.732 | 0.846 | |||
| GSWP3v1 | [-] | 114. | 114. | 118. | 145. | -1.47 | 13.2 | 0.209 | 0.926 | 0.841 | 0.986 | 0.993 | 0.658 | 0.874 | |||
| WFDEI | [-] | 113. | 113. | 118. | 145. | -2.40 | 20.1 | 0.364 | 0.911 | 0.759 | 0.976 | 0.995 | 0.826 | 0.871 |
Download Data |
Period Mean (original grids) [W/m2] |
Model Period Mean (intersection) [W/m2] |
Model Period Mean (complement) [W/m2] |
Benchmark Period Mean (intersection) [W/m2] |
Benchmark Period Mean (complement) [W/m2] |
Bias [W/m2] |
RMSE [W/m2] |
Phase Shift [months] |
Bias Score [1] |
RMSE Score [1] |
Seasonal Cycle Score [1] |
Spatial Distribution Score [1] |
Interannual Variability Score [1] |
Overall Score [1] |
|||
|---|---|---|---|---|---|---|---|---|---|---|---|---|---|---|---|---|---|
| Benchmark | [-] | 163. | |||||||||||||||
| CRUNCEPv7 | [-] | 144. | 144. | 142. | 173. | 1.83 | 19.8 | 0.580 | 0.746 | 0.685 | 0.934 | 0.994 | 0.613 | 0.776 | |||
| GSWP3v1 | [-] | 137. | 137. | 142. | 173. | -4.46 | 16.0 | 0.389 | 0.822 | 0.705 | 0.959 | 0.998 | 0.712 | 0.817 | |||
| WFDEI | [-] | 136. | 136. | 142. | 173. | -5.53 | 21.5 | 0.584 | 0.753 | 0.638 | 0.934 | 0.996 | 0.747 | 0.784 |
Download Data |
Period Mean (original grids) [W/m2] |
Model Period Mean (intersection) [W/m2] |
Model Period Mean (complement) [W/m2] |
Benchmark Period Mean (intersection) [W/m2] |
Benchmark Period Mean (complement) [W/m2] |
Bias [W/m2] |
RMSE [W/m2] |
Phase Shift [months] |
Bias Score [1] |
RMSE Score [1] |
Seasonal Cycle Score [1] |
Spatial Distribution Score [1] |
Interannual Variability Score [1] |
Overall Score [1] |
|||
|---|---|---|---|---|---|---|---|---|---|---|---|---|---|---|---|---|---|
| Benchmark | [-] | 177. | |||||||||||||||
| CRUNCEPv7 | [-] | 168. | 168. | 175. | 217. | -6.22 | 17.9 | 0.405 | 0.721 | 0.749 | 0.965 | 0.985 | 0.709 | 0.813 | |||
| GSWP3v1 | [-] | 162. | 162. | 175. | 217. | -12.0 | 17.9 | 0.298 | 0.709 | 0.763 | 0.978 | 0.963 | 0.673 | 0.808 | |||
| WFDEI | [-] | 172. | 172. | 175. | 217. | -2.53 | 16.8 | 0.507 | 0.777 | 0.731 | 0.955 | 0.976 | 0.652 | 0.804 |
Download Data |
Period Mean (original grids) [W/m2] |
Model Period Mean (intersection) [W/m2] |
Model Period Mean (complement) [W/m2] |
Benchmark Period Mean (intersection) [W/m2] |
Benchmark Period Mean (complement) [W/m2] |
Bias [W/m2] |
RMSE [W/m2] |
Phase Shift [months] |
Bias Score [1] |
RMSE Score [1] |
Seasonal Cycle Score [1] |
Spatial Distribution Score [1] |
Interannual Variability Score [1] |
Overall Score [1] |
|||
|---|---|---|---|---|---|---|---|---|---|---|---|---|---|---|---|---|---|
| Benchmark | [-] | 69.7 | |||||||||||||||
| CRUNCEPv7 | [-] | 74.1 | 74.0 | 69.6 | 71.1 | 2.14 | 20.6 | 0.113 | 0.891 | 0.751 | 0.992 | 0.928 | 0.621 | 0.822 | |||
| GSWP3v1 | [-] | 69.2 | 69.2 | 69.6 | 71.1 | -1.83 | 17.2 | 0.0813 | 0.920 | 0.779 | 0.995 | 0.989 | 0.765 | 0.871 | |||
| WFDEI | [-] | 62.0 | 61.9 | 69.6 | 71.1 | -9.33 | 23.4 | 0.141 | 0.852 | 0.726 | 0.991 | 0.946 | 0.799 | 0.840 |
Download Data |
Period Mean (original grids) [W/m2] |
Model Period Mean (intersection) [W/m2] |
Model Period Mean (complement) [W/m2] |
Benchmark Period Mean (intersection) [W/m2] |
Benchmark Period Mean (complement) [W/m2] |
Bias [W/m2] |
RMSE [W/m2] |
Phase Shift [months] |
Bias Score [1] |
RMSE Score [1] |
Seasonal Cycle Score [1] |
Spatial Distribution Score [1] |
Interannual Variability Score [1] |
Overall Score [1] |
|||
|---|---|---|---|---|---|---|---|---|---|---|---|---|---|---|---|---|---|
| Benchmark | [-] | 204. | |||||||||||||||
| CRUNCEPv7 | [-] | 190. | 190. | 201. | 219. | -8.69 | 24.0 | 0.969 | 0.610 | 0.645 | 0.900 | 0.820 | 0.666 | 0.715 | |||
| GSWP3v1 | [-] | 192. | 192. | 201. | 219. | -6.68 | 16.7 | 0.458 | 0.769 | 0.678 | 0.945 | 0.986 | 0.753 | 0.801 | |||
| WFDEI | [-] | 194. | 194. | 201. | 219. | -6.90 | 21.4 | 0.489 | 0.721 | 0.614 | 0.938 | 0.997 | 0.703 | 0.764 |
Download Data |
Period Mean (original grids) [W/m2] |
Model Period Mean (intersection) [W/m2] |
Model Period Mean (complement) [W/m2] |
Benchmark Period Mean (intersection) [W/m2] |
Benchmark Period Mean (complement) [W/m2] |
Bias [W/m2] |
RMSE [W/m2] |
Phase Shift [months] |
Bias Score [1] |
RMSE Score [1] |
Seasonal Cycle Score [1] |
Spatial Distribution Score [1] |
Interannual Variability Score [1] |
Overall Score [1] |
|||
|---|---|---|---|---|---|---|---|---|---|---|---|---|---|---|---|---|---|
| Benchmark | [-] | 150. | |||||||||||||||
| CRUNCEPv7 | [-] | 155. | 156. | 148. | 192. | 8.22 | 18.2 | 0.417 | 0.833 | 0.783 | 0.972 | 0.986 | 0.577 | 0.822 | |||
| GSWP3v1 | [-] | 145. | 145. | 148. | 192. | -1.45 | 13.3 | 0.293 | 0.939 | 0.801 | 0.981 | 0.991 | 0.701 | 0.869 | |||
| WFDEI | [-] | 150. | 150. | 148. | 192. | 3.00 | 22.3 | 0.394 | 0.903 | 0.690 | 0.974 | 0.998 | 0.838 | 0.849 |
Download Data |
Period Mean (original grids) [W/m2] |
Model Period Mean (intersection) [W/m2] |
Model Period Mean (complement) [W/m2] |
Benchmark Period Mean (intersection) [W/m2] |
Benchmark Period Mean (complement) [W/m2] |
Bias [W/m2] |
RMSE [W/m2] |
Phase Shift [months] |
Bias Score [1] |
RMSE Score [1] |
Seasonal Cycle Score [1] |
Spatial Distribution Score [1] |
Interannual Variability Score [1] |
Overall Score [1] |
|||
|---|---|---|---|---|---|---|---|---|---|---|---|---|---|---|---|---|---|
| Benchmark | [-] | 110. | |||||||||||||||
| CRUNCEPv7 | [-] | 122. | 123. | 110. | 117. | 12.7 | 21.9 | 0.218 | 0.827 | 0.797 | 0.986 | 0.971 | 0.562 | 0.823 | |||
| GSWP3v1 | [-] | 112. | 112. | 110. | 117. | 1.79 | 13.4 | 0.112 | 0.929 | 0.841 | 0.993 | 0.999 | 0.675 | 0.880 | |||
| WFDEI | [-] | 111. | 111. | 110. | 117. | 1.60 | 19.6 | 0.186 | 0.914 | 0.770 | 0.988 | 0.941 | 0.840 | 0.870 |
Download Data |
Period Mean (original grids) [W/m2] |
Model Period Mean (intersection) [W/m2] |
Model Period Mean (complement) [W/m2] |
Benchmark Period Mean (intersection) [W/m2] |
Benchmark Period Mean (complement) [W/m2] |
Bias [W/m2] |
RMSE [W/m2] |
Phase Shift [months] |
Bias Score [1] |
RMSE Score [1] |
Seasonal Cycle Score [1] |
Spatial Distribution Score [1] |
Interannual Variability Score [1] |
Overall Score [1] |
|||
|---|---|---|---|---|---|---|---|---|---|---|---|---|---|---|---|---|---|
| Benchmark | [-] | 161. | |||||||||||||||
| CRUNCEPv7 | [-] | 155. | 155. | 161. | 163. | -5.79 | 16.7 | 0.204 | 0.885 | 0.813 | 0.986 | 0.938 | 0.611 | 0.841 | |||
| GSWP3v1 | [-] | 160. | 160. | 161. | 163. | -0.462 | 14.3 | 0.198 | 0.928 | 0.826 | 0.987 | 0.983 | 0.702 | 0.875 | |||
| WFDEI | [-] | 169. | 169. | 161. | 163. | 8.11 | 23.2 | 0.247 | 0.880 | 0.739 | 0.983 | 0.998 | 0.838 | 0.863 |
Download Data |
Period Mean (original grids) [W/m2] |
Model Period Mean (intersection) [W/m2] |
Model Period Mean (complement) [W/m2] |
Benchmark Period Mean (intersection) [W/m2] |
Benchmark Period Mean (complement) [W/m2] |
Bias [W/m2] |
RMSE [W/m2] |
Phase Shift [months] |
Bias Score [1] |
RMSE Score [1] |
Seasonal Cycle Score [1] |
Spatial Distribution Score [1] |
Interannual Variability Score [1] |
Overall Score [1] |
|||
|---|---|---|---|---|---|---|---|---|---|---|---|---|---|---|---|---|---|
| Benchmark | [-] | 179. | |||||||||||||||
| CRUNCEPv7 | [-] | 183. | 183. | 178. | 218. | 6.21 | 17.3 | 1.49 | 0.601 | 0.451 | 0.776 | 0.822 | 0.578 | 0.613 | |||
| GSWP3v1 | [-] | 174. | 174. | 178. | 218. | -3.01 | 14.3 | 0.799 | 0.751 | 0.449 | 0.896 | 0.959 | 0.806 | 0.718 | |||
| WFDEI | [-] | 160. | 160. | 178. | 218. | -17.7 | 27.4 | 1.47 | 0.351 | 0.353 | 0.799 | 0.994 | 0.639 | 0.581 |
Download Data |
Period Mean (original grids) [W/m2] |
Model Period Mean (intersection) [W/m2] |
Model Period Mean (complement) [W/m2] |
Benchmark Period Mean (intersection) [W/m2] |
Benchmark Period Mean (complement) [W/m2] |
Bias [W/m2] |
RMSE [W/m2] |
Phase Shift [months] |
Bias Score [1] |
RMSE Score [1] |
Seasonal Cycle Score [1] |
Spatial Distribution Score [1] |
Interannual Variability Score [1] |
Overall Score [1] |
|||
|---|---|---|---|---|---|---|---|---|---|---|---|---|---|---|---|---|---|
| Benchmark | [-] | 185. | |||||||||||||||
| CRUNCEPv7 | [-] | 187. | 187. | 184. | 202. | 2.66 | 20.0 | 0.995 | 0.699 | 0.619 | 0.884 | 0.821 | 0.518 | 0.693 | |||
| GSWP3v1 | [-] | 180. | 181. | 184. | 202. | -3.37 | 15.5 | 0.717 | 0.831 | 0.645 | 0.909 | 0.976 | 0.715 | 0.787 | |||
| WFDEI | [-] | 175. | 175. | 184. | 202. | -8.85 | 23.8 | 1.03 | 0.709 | 0.529 | 0.865 | 0.958 | 0.779 | 0.728 |
Download Data |
Period Mean (original grids) [W/m2] |
Model Period Mean (intersection) [W/m2] |
Model Period Mean (complement) [W/m2] |
Benchmark Period Mean (intersection) [W/m2] |
Benchmark Period Mean (complement) [W/m2] |
Bias [W/m2] |
RMSE [W/m2] |
Phase Shift [months] |
Bias Score [1] |
RMSE Score [1] |
Seasonal Cycle Score [1] |
Spatial Distribution Score [1] |
Interannual Variability Score [1] |
Overall Score [1] |
|||
|---|---|---|---|---|---|---|---|---|---|---|---|---|---|---|---|---|---|
| Benchmark | [-] | 178. | |||||||||||||||
| CRUNCEPv7 | [-] | 179. | 178. | 179. | 169. | -3.51 | 27.2 | 0.548 | 0.689 | 0.688 | 0.947 | 0.804 | 0.632 | 0.741 | |||
| GSWP3v1 | [-] | 177. | 176. | 179. | 169. | -7.13 | 20.8 | 0.400 | 0.791 | 0.712 | 0.959 | 0.998 | 0.687 | 0.810 | |||
| WFDEI | [-] | 182. | 181. | 179. | 169. | -2.00 | 24.2 | 0.510 | 0.771 | 0.675 | 0.945 | 0.988 | 0.719 | 0.796 |
Temporally integrated period mean