Mean State
Download Data |
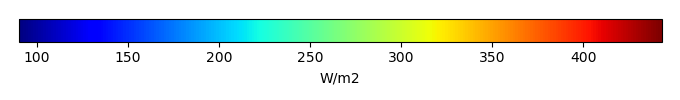
Period Mean (original grids) [W/m2] |
Model Period Mean (intersection) [W/m2] |
Model Period Mean (complement) [W/m2] |
Benchmark Period Mean (intersection) [W/m2] |
Benchmark Period Mean (complement) [W/m2] |
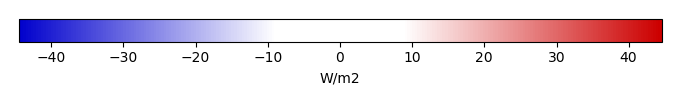
Bias [W/m2] |
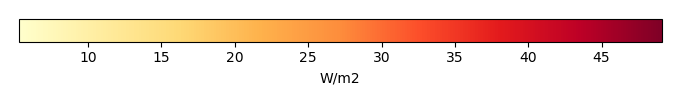
RMSE [W/m2] |
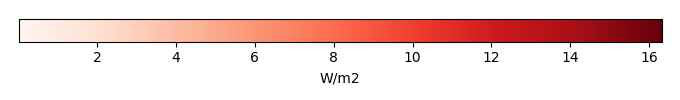
Phase Shift [months] |
Bias Score [1] |
RMSE Score [1] |
Seasonal Cycle Score [1] |
Spatial Distribution Score [1] |
Interannual Variability Score [1] |
Overall Score [1] |
|||
|---|---|---|---|---|---|---|---|---|---|---|---|---|---|---|---|---|---|
| Benchmark | [-] | 401. | |||||||||||||||
| CLM4.5_CRUNCEPv7 | [-] | 408. | 408. | 0.00 | 400. | 415. | 9.76 | 15.2 | 1.36 | 0.29 | 0.34 | 0.82 | 0.94 | 0.74 | 0.58 | ||
| CLM4.5_GSWP3v1 | [-] | 397. | 398. | 0.00 | 400. | 415. | -1.37 | 9.58 | 1.81 | 0.50 | 0.39 | 0.73 | 0.91 | 0.65 | 0.60 | ||
| CLM4_CRUNCEPv7 | [-] | 408. | 408. | 0.00 | 400. | 415. | 9.76 | 15.2 | 1.36 | 0.29 | 0.34 | 0.82 | 0.94 | 0.74 | 0.58 | ||
| CLM4_GSWP3v1 | [-] | 397. | 398. | 0.00 | 400. | 415. | -1.37 | 9.58 | 1.81 | 0.50 | 0.39 | 0.73 | 0.91 | 0.65 | 0.60 | ||
| CLM5_CRUNCEPv7 | [-] | 408. | 408. | 0.00 | 400. | 415. | 9.76 | 15.2 | 1.36 | 0.29 | 0.34 | 0.82 | 0.94 | 0.74 | 0.58 | ||
| CLM5_GSWP3v1 | [-] | 397. | 398. | 0.00 | 400. | 415. | -1.37 | 9.58 | 1.81 | 0.50 | 0.39 | 0.73 | 0.91 | 0.65 | 0.60 |
Download Data |
Period Mean (original grids) [W/m2] |
Model Period Mean (intersection) [W/m2] |
Model Period Mean (complement) [W/m2] |
Benchmark Period Mean (intersection) [W/m2] |
Benchmark Period Mean (complement) [W/m2] |
Bias [W/m2] |
RMSE [W/m2] |
Phase Shift [months] |
Bias Score [1] |
RMSE Score [1] |
Seasonal Cycle Score [1] |
Spatial Distribution Score [1] |
Interannual Variability Score [1] |
Overall Score [1] |
|||
|---|---|---|---|---|---|---|---|---|---|---|---|---|---|---|---|---|---|
| Benchmark | [-] | 391. | |||||||||||||||
| CLM4.5_CRUNCEPv7 | [-] | 397. | 397. | 0.00 | 391. | 404. | 6.63 | 15.0 | 0.817 | 0.67 | 0.65 | 0.91 | 0.97 | 0.77 | 0.77 | ||
| CLM4.5_GSWP3v1 | [-] | 386. | 386. | 0.00 | 391. | 404. | -4.87 | 12.4 | 0.491 | 0.73 | 0.66 | 0.95 | 0.91 | 0.71 | 0.77 | ||
| CLM4_CRUNCEPv7 | [-] | 397. | 397. | 0.00 | 391. | 404. | 6.63 | 15.0 | 0.817 | 0.67 | 0.65 | 0.91 | 0.97 | 0.77 | 0.77 | ||
| CLM4_GSWP3v1 | [-] | 386. | 386. | 0.00 | 391. | 404. | -4.87 | 12.4 | 0.491 | 0.73 | 0.66 | 0.95 | 0.91 | 0.71 | 0.77 | ||
| CLM5_CRUNCEPv7 | [-] | 397. | 397. | 0.00 | 391. | 404. | 6.63 | 15.0 | 0.817 | 0.67 | 0.65 | 0.91 | 0.97 | 0.77 | 0.77 | ||
| CLM5_GSWP3v1 | [-] | 386. | 386. | 0.00 | 391. | 404. | -4.87 | 12.4 | 0.491 | 0.73 | 0.66 | 0.95 | 0.91 | 0.71 | 0.77 |
Download Data |
Period Mean (original grids) [W/m2] |
Model Period Mean (intersection) [W/m2] |
Model Period Mean (complement) [W/m2] |
Benchmark Period Mean (intersection) [W/m2] |
Benchmark Period Mean (complement) [W/m2] |
Bias [W/m2] |
RMSE [W/m2] |
Phase Shift [months] |
Bias Score [1] |
RMSE Score [1] |
Seasonal Cycle Score [1] |
Spatial Distribution Score [1] |
Interannual Variability Score [1] |
Overall Score [1] |
|||
|---|---|---|---|---|---|---|---|---|---|---|---|---|---|---|---|---|---|
| Benchmark | [-] | 367. | |||||||||||||||
| CLM4.5_CRUNCEPv7 | [-] | 370. | 370. | 0.00 | 366. | 384. | 6.16 | 15.0 | 1.19 | 0.61 | 0.62 | 0.85 | 0.99 | 0.73 | 0.74 | ||
| CLM4.5_GSWP3v1 | [-] | 361. | 361. | 0.00 | 366. | 384. | -2.96 | 12.2 | 0.935 | 0.71 | 0.62 | 0.88 | 0.99 | 0.75 | 0.76 | ||
| CLM4_CRUNCEPv7 | [-] | 370. | 370. | 0.00 | 366. | 384. | 6.16 | 15.0 | 1.19 | 0.61 | 0.62 | 0.85 | 0.99 | 0.73 | 0.74 | ||
| CLM4_GSWP3v1 | [-] | 361. | 361. | 0.00 | 366. | 384. | -2.96 | 12.2 | 0.935 | 0.71 | 0.62 | 0.88 | 0.99 | 0.75 | 0.76 | ||
| CLM5_CRUNCEPv7 | [-] | 370. | 370. | 0.00 | 366. | 384. | 6.16 | 15.0 | 1.19 | 0.61 | 0.62 | 0.85 | 0.99 | 0.73 | 0.74 | ||
| CLM5_GSWP3v1 | [-] | 361. | 361. | 0.00 | 366. | 384. | -2.96 | 12.2 | 0.935 | 0.71 | 0.62 | 0.88 | 0.99 | 0.75 | 0.76 |
Download Data |
Period Mean (original grids) [W/m2] |
Model Period Mean (intersection) [W/m2] |
Model Period Mean (complement) [W/m2] |
Benchmark Period Mean (intersection) [W/m2] |
Benchmark Period Mean (complement) [W/m2] |
Bias [W/m2] |
RMSE [W/m2] |
Phase Shift [months] |
Bias Score [1] |
RMSE Score [1] |
Seasonal Cycle Score [1] |
Spatial Distribution Score [1] |
Interannual Variability Score [1] |
Overall Score [1] |
|||
|---|---|---|---|---|---|---|---|---|---|---|---|---|---|---|---|---|---|
| Benchmark | [-] | 243. | |||||||||||||||
| CLM4.5_CRUNCEPv7 | [-] | 207. | 207. | 0.00 | 242. | 256. | -32.7 | 34.1 | 0.143 | 0.57 | 0.82 | 0.99 | 0.99 | 0.72 | 0.82 | ||
| CLM4.5_GSWP3v1 | [-] | 237. | 237. | 0.00 | 242. | 256. | -2.60 | 13.7 | 0.123 | 0.92 | 0.80 | 0.99 | 0.99 | 0.89 | 0.90 | ||
| CLM4_CRUNCEPv7 | [-] | 207. | 207. | 0.00 | 242. | 256. | -32.7 | 34.1 | 0.143 | 0.57 | 0.82 | 0.99 | 0.99 | 0.72 | 0.82 | ||
| CLM4_GSWP3v1 | [-] | 237. | 237. | 0.00 | 242. | 256. | -2.60 | 13.7 | 0.123 | 0.92 | 0.80 | 0.99 | 0.99 | 0.89 | 0.90 | ||
| CLM5_CRUNCEPv7 | [-] | 207. | 207. | 0.00 | 242. | 256. | -32.7 | 34.1 | 0.143 | 0.57 | 0.82 | 0.99 | 0.99 | 0.72 | 0.82 | ||
| CLM5_GSWP3v1 | [-] | 237. | 237. | 0.00 | 242. | 256. | -2.60 | 13.7 | 0.123 | 0.92 | 0.80 | 0.99 | 0.99 | 0.89 | 0.90 |
Download Data |
Period Mean (original grids) [W/m2] |
Model Period Mean (intersection) [W/m2] |
Model Period Mean (complement) [W/m2] |
Benchmark Period Mean (intersection) [W/m2] |
Benchmark Period Mean (complement) [W/m2] |
Bias [W/m2] |
RMSE [W/m2] |
Phase Shift [months] |
Bias Score [1] |
RMSE Score [1] |
Seasonal Cycle Score [1] |
Spatial Distribution Score [1] |
Interannual Variability Score [1] |
Overall Score [1] |
|||
|---|---|---|---|---|---|---|---|---|---|---|---|---|---|---|---|---|---|
| Benchmark | [-] | 411. | |||||||||||||||
| CLM4.5_CRUNCEPv7 | [-] | 427. | 427. | 0.00 | 409. | 416. | 20.6 | 23.6 | 2.39 | 0.084 | 0.35 | 0.62 | 0.98 | 0.66 | 0.51 | ||
| CLM4.5_GSWP3v1 | [-] | 411. | 411. | 0.00 | 409. | 416. | 3.75 | 11.6 | 1.88 | 0.37 | 0.37 | 0.71 | 0.57 | 0.75 | 0.52 | ||
| CLM4_CRUNCEPv7 | [-] | 427. | 427. | 0.00 | 409. | 416. | 20.6 | 23.6 | 2.39 | 0.084 | 0.35 | 0.62 | 0.98 | 0.66 | 0.51 | ||
| CLM4_GSWP3v1 | [-] | 411. | 411. | 0.00 | 409. | 416. | 3.75 | 11.6 | 1.88 | 0.37 | 0.37 | 0.71 | 0.57 | 0.75 | 0.52 | ||
| CLM5_CRUNCEPv7 | [-] | 427. | 427. | 0.00 | 409. | 416. | 20.6 | 23.6 | 2.39 | 0.084 | 0.35 | 0.62 | 0.98 | 0.66 | 0.51 | ||
| CLM5_GSWP3v1 | [-] | 411. | 411. | 0.00 | 409. | 416. | 3.75 | 11.6 | 1.88 | 0.37 | 0.37 | 0.71 | 0.57 | 0.75 | 0.52 |
Download Data |
Period Mean (original grids) [W/m2] |
Model Period Mean (intersection) [W/m2] |
Model Period Mean (complement) [W/m2] |
Benchmark Period Mean (intersection) [W/m2] |
Benchmark Period Mean (complement) [W/m2] |
Bias [W/m2] |
RMSE [W/m2] |
Phase Shift [months] |
Bias Score [1] |
RMSE Score [1] |
Seasonal Cycle Score [1] |
Spatial Distribution Score [1] |
Interannual Variability Score [1] |
Overall Score [1] |
|||
|---|---|---|---|---|---|---|---|---|---|---|---|---|---|---|---|---|---|
| Benchmark | [-] | 268. | |||||||||||||||
| CLM4.5_CRUNCEPv7 | [-] | 245. | 245. | 0.00 | 267. | 280. | -22.2 | 23.6 | 0.0562 | 0.68 | 0.84 | 1.0 | 1.0 | 0.88 | 0.87 | ||
| CLM4.5_GSWP3v1 | [-] | 265. | 264. | 0.00 | 267. | 280. | -2.61 | 10.9 | 0.0463 | 0.92 | 0.85 | 1.0 | 0.97 | 0.86 | 0.91 | ||
| CLM4_CRUNCEPv7 | [-] | 245. | 245. | 0.00 | 267. | 280. | -22.2 | 23.6 | 0.0562 | 0.68 | 0.84 | 1.0 | 1.0 | 0.88 | 0.87 | ||
| CLM4_GSWP3v1 | [-] | 265. | 264. | 0.00 | 267. | 280. | -2.61 | 10.9 | 0.0463 | 0.92 | 0.85 | 1.0 | 0.97 | 0.86 | 0.91 | ||
| CLM5_CRUNCEPv7 | [-] | 245. | 245. | 0.00 | 267. | 280. | -22.2 | 23.6 | 0.0562 | 0.68 | 0.84 | 1.0 | 1.0 | 0.88 | 0.87 | ||
| CLM5_GSWP3v1 | [-] | 265. | 264. | 0.00 | 267. | 280. | -2.61 | 10.9 | 0.0463 | 0.92 | 0.85 | 1.0 | 0.97 | 0.86 | 0.91 |
Download Data |
Period Mean (original grids) [W/m2] |
Model Period Mean (intersection) [W/m2] |
Model Period Mean (complement) [W/m2] |
Benchmark Period Mean (intersection) [W/m2] |
Benchmark Period Mean (complement) [W/m2] |
Bias [W/m2] |
RMSE [W/m2] |
Phase Shift [months] |
Bias Score [1] |
RMSE Score [1] |
Seasonal Cycle Score [1] |
Spatial Distribution Score [1] |
Interannual Variability Score [1] |
Overall Score [1] |
|||
|---|---|---|---|---|---|---|---|---|---|---|---|---|---|---|---|---|---|
| Benchmark | [-] | 297. | |||||||||||||||
| CLM4.5_CRUNCEPv7 | [-] | 280. | 279. | 0.00 | 296. | 341. | -13.5 | 20.1 | 0.119 | 0.74 | 0.78 | 0.99 | 1.0 | 0.82 | 0.85 | ||
| CLM4.5_GSWP3v1 | [-] | 293. | 292. | 0.00 | 296. | 341. | -0.587 | 14.2 | 0.144 | 0.84 | 0.81 | 0.99 | 0.99 | 0.79 | 0.87 | ||
| CLM4_CRUNCEPv7 | [-] | 280. | 279. | 0.00 | 296. | 341. | -13.5 | 20.1 | 0.119 | 0.74 | 0.78 | 0.99 | 1.0 | 0.82 | 0.85 | ||
| CLM4_GSWP3v1 | [-] | 293. | 292. | 0.00 | 296. | 341. | -0.587 | 14.2 | 0.144 | 0.84 | 0.81 | 0.99 | 0.99 | 0.79 | 0.87 | ||
| CLM5_CRUNCEPv7 | [-] | 280. | 279. | 0.00 | 296. | 341. | -13.5 | 20.1 | 0.119 | 0.74 | 0.78 | 0.99 | 1.0 | 0.82 | 0.85 | ||
| CLM5_GSWP3v1 | [-] | 293. | 292. | 0.00 | 296. | 341. | -0.587 | 14.2 | 0.144 | 0.84 | 0.81 | 0.99 | 0.99 | 0.79 | 0.87 |
Download Data |
Period Mean (original grids) [W/m2] |
Model Period Mean (intersection) [W/m2] |
Model Period Mean (complement) [W/m2] |
Benchmark Period Mean (intersection) [W/m2] |
Benchmark Period Mean (complement) [W/m2] |
Bias [W/m2] |
RMSE [W/m2] |
Phase Shift [months] |
Bias Score [1] |
RMSE Score [1] |
Seasonal Cycle Score [1] |
Spatial Distribution Score [1] |
Interannual Variability Score [1] |
Overall Score [1] |
|||
|---|---|---|---|---|---|---|---|---|---|---|---|---|---|---|---|---|---|
| Benchmark | [-] | 387. | |||||||||||||||
| CLM4.5_CRUNCEPv7 | [-] | 386. | 387. | 0.00 | 385. | 415. | 8.18 | 20.7 | 0.893 | 0.59 | 0.68 | 0.91 | 0.96 | 0.72 | 0.76 | ||
| CLM4.5_GSWP3v1 | [-] | 374. | 375. | 0.00 | 385. | 415. | -5.63 | 15.4 | 0.408 | 0.72 | 0.71 | 0.96 | 1.0 | 0.80 | 0.82 | ||
| CLM4_CRUNCEPv7 | [-] | 386. | 387. | 0.00 | 385. | 415. | 8.18 | 20.7 | 0.893 | 0.59 | 0.68 | 0.91 | 0.96 | 0.72 | 0.76 | ||
| CLM4_GSWP3v1 | [-] | 374. | 375. | 0.00 | 385. | 415. | -5.63 | 15.4 | 0.408 | 0.72 | 0.71 | 0.96 | 1.0 | 0.80 | 0.82 | ||
| CLM5_CRUNCEPv7 | [-] | 386. | 387. | 0.00 | 385. | 415. | 8.18 | 20.7 | 0.893 | 0.59 | 0.68 | 0.91 | 0.96 | 0.72 | 0.76 | ||
| CLM5_GSWP3v1 | [-] | 374. | 375. | 0.00 | 385. | 415. | -5.63 | 15.4 | 0.408 | 0.72 | 0.71 | 0.96 | 1.0 | 0.80 | 0.82 |
Download Data |
Period Mean (original grids) [W/m2] |
Model Period Mean (intersection) [W/m2] |
Model Period Mean (complement) [W/m2] |
Benchmark Period Mean (intersection) [W/m2] |
Benchmark Period Mean (complement) [W/m2] |
Bias [W/m2] |
RMSE [W/m2] |
Phase Shift [months] |
Bias Score [1] |
RMSE Score [1] |
Seasonal Cycle Score [1] |
Spatial Distribution Score [1] |
Interannual Variability Score [1] |
Overall Score [1] |
|||
|---|---|---|---|---|---|---|---|---|---|---|---|---|---|---|---|---|---|
| Benchmark | [-] | 249. | |||||||||||||||
| CLM4.5_CRUNCEPv7 | [-] | 217. | 217. | 0.00 | 248. | 253. | -31.0 | 31.9 | 0.0590 | 0.57 | 0.83 | 1.0 | 1.0 | 0.79 | 0.84 | ||
| CLM4.5_GSWP3v1 | [-] | 243. | 244. | 0.00 | 248. | 253. | -4.14 | 13.6 | 0.0505 | 0.92 | 0.80 | 1.0 | 0.98 | 0.91 | 0.90 | ||
| CLM4_CRUNCEPv7 | [-] | 217. | 217. | 0.00 | 248. | 253. | -31.0 | 31.9 | 0.0590 | 0.57 | 0.83 | 1.0 | 1.0 | 0.79 | 0.84 | ||
| CLM4_GSWP3v1 | [-] | 243. | 244. | 0.00 | 248. | 253. | -4.14 | 13.6 | 0.0505 | 0.92 | 0.80 | 1.0 | 0.98 | 0.91 | 0.90 | ||
| CLM5_CRUNCEPv7 | [-] | 217. | 217. | 0.00 | 248. | 253. | -31.0 | 31.9 | 0.0590 | 0.57 | 0.83 | 1.0 | 1.0 | 0.79 | 0.84 | ||
| CLM5_GSWP3v1 | [-] | 243. | 244. | 0.00 | 248. | 253. | -4.14 | 13.6 | 0.0505 | 0.92 | 0.80 | 1.0 | 0.98 | 0.91 | 0.90 |
Download Data |
Period Mean (original grids) [W/m2] |
Model Period Mean (intersection) [W/m2] |
Model Period Mean (complement) [W/m2] |
Benchmark Period Mean (intersection) [W/m2] |
Benchmark Period Mean (complement) [W/m2] |
Bias [W/m2] |
RMSE [W/m2] |
Phase Shift [months] |
Bias Score [1] |
RMSE Score [1] |
Seasonal Cycle Score [1] |
Spatial Distribution Score [1] |
Interannual Variability Score [1] |
Overall Score [1] |
|||
|---|---|---|---|---|---|---|---|---|---|---|---|---|---|---|---|---|---|
| Benchmark | [-] | 353. | |||||||||||||||
| CLM4.5_CRUNCEPv7 | [-] | 352. | 352. | 0.00 | 352. | 359. | 0.323 | 13.5 | 0.455 | 0.79 | 0.71 | 0.96 | 0.95 | 0.76 | 0.81 | ||
| CLM4.5_GSWP3v1 | [-] | 351. | 351. | 0.00 | 352. | 359. | -0.968 | 9.75 | 0.299 | 0.86 | 0.76 | 0.98 | 0.99 | 0.87 | 0.87 | ||
| CLM4_CRUNCEPv7 | [-] | 352. | 352. | 0.00 | 352. | 359. | 0.323 | 13.5 | 0.455 | 0.79 | 0.71 | 0.96 | 0.95 | 0.76 | 0.81 | ||
| CLM4_GSWP3v1 | [-] | 351. | 351. | 0.00 | 352. | 359. | -0.968 | 9.75 | 0.299 | 0.86 | 0.76 | 0.98 | 0.99 | 0.87 | 0.87 | ||
| CLM5_CRUNCEPv7 | [-] | 352. | 352. | 0.00 | 352. | 359. | 0.323 | 13.5 | 0.455 | 0.79 | 0.71 | 0.96 | 0.95 | 0.76 | 0.81 | ||
| CLM5_GSWP3v1 | [-] | 351. | 351. | 0.00 | 352. | 359. | -0.968 | 9.75 | 0.299 | 0.86 | 0.76 | 0.98 | 0.99 | 0.87 | 0.87 |
Download Data |
Period Mean (original grids) [W/m2] |
Model Period Mean (intersection) [W/m2] |
Model Period Mean (complement) [W/m2] |
Benchmark Period Mean (intersection) [W/m2] |
Benchmark Period Mean (complement) [W/m2] |
Bias [W/m2] |
RMSE [W/m2] |
Phase Shift [months] |
Bias Score [1] |
RMSE Score [1] |
Seasonal Cycle Score [1] |
Spatial Distribution Score [1] |
Interannual Variability Score [1] |
Overall Score [1] |
|||
|---|---|---|---|---|---|---|---|---|---|---|---|---|---|---|---|---|---|
| Benchmark | [-] | 314. | |||||||||||||||
| CLM4.5_CRUNCEPv7 | [-] | 292. | 292. | 0.00 | 312. | 329. | -16.4 | 21.0 | 0.237 | 0.58 | 0.71 | 0.98 | 0.87 | 0.84 | 0.79 | ||
| CLM4.5_GSWP3v1 | [-] | 306. | 306. | 0.00 | 312. | 329. | -3.25 | 11.6 | 0.223 | 0.81 | 0.75 | 0.98 | 1.0 | 0.70 | 0.83 | ||
| CLM4_CRUNCEPv7 | [-] | 292. | 292. | 0.00 | 312. | 329. | -16.4 | 21.0 | 0.237 | 0.58 | 0.71 | 0.98 | 0.87 | 0.84 | 0.79 | ||
| CLM4_GSWP3v1 | [-] | 306. | 306. | 0.00 | 312. | 329. | -3.25 | 11.6 | 0.223 | 0.81 | 0.75 | 0.98 | 1.0 | 0.70 | 0.83 | ||
| CLM5_CRUNCEPv7 | [-] | 292. | 292. | 0.00 | 312. | 329. | -16.4 | 21.0 | 0.237 | 0.58 | 0.71 | 0.98 | 0.87 | 0.84 | 0.79 | ||
| CLM5_GSWP3v1 | [-] | 306. | 306. | 0.00 | 312. | 329. | -3.25 | 11.6 | 0.223 | 0.81 | 0.75 | 0.98 | 1.0 | 0.70 | 0.83 |
Download Data |
Period Mean (original grids) [W/m2] |
Model Period Mean (intersection) [W/m2] |
Model Period Mean (complement) [W/m2] |
Benchmark Period Mean (intersection) [W/m2] |
Benchmark Period Mean (complement) [W/m2] |
Bias [W/m2] |
RMSE [W/m2] |
Phase Shift [months] |
Bias Score [1] |
RMSE Score [1] |
Seasonal Cycle Score [1] |
Spatial Distribution Score [1] |
Interannual Variability Score [1] |
Overall Score [1] |
|||
|---|---|---|---|---|---|---|---|---|---|---|---|---|---|---|---|---|---|
| Benchmark | [-] | 345. | |||||||||||||||
| CLM4.5_CRUNCEPv7 | [-] | 306. | 306. | 0.00 | 315. | 360. | -5.27 | 20.9 | 0.667 | 0.59 | 0.65 | 0.92 | 0.99 | 0.73 | 0.75 | ||
| CLM4.5_GSWP3v1 | [-] | 309. | 309. | 0.00 | 315. | 360. | -2.77 | 13.1 | 0.509 | 0.76 | 0.69 | 0.94 | 1.0 | 0.80 | 0.81 | ||
| CLM4_CRUNCEPv7 | [-] | 306. | 306. | 0.00 | 315. | 360. | -5.27 | 20.9 | 0.667 | 0.59 | 0.65 | 0.92 | 0.99 | 0.73 | 0.75 | ||
| CLM4_GSWP3v1 | [-] | 309. | 309. | 0.00 | 315. | 360. | -2.77 | 13.1 | 0.509 | 0.76 | 0.69 | 0.94 | 1.0 | 0.80 | 0.81 | ||
| CLM5_CRUNCEPv7 | [-] | 307. | 307. | 0.00 | 315. | 360. | -5.27 | 20.9 | 0.667 | 0.59 | 0.65 | 0.92 | 0.99 | 0.73 | 0.75 | ||
| CLM5_GSWP3v1 | [-] | 310. | 310. | 0.00 | 315. | 360. | -2.77 | 13.1 | 0.509 | 0.76 | 0.69 | 0.94 | 1.0 | 0.80 | 0.81 |
Download Data |
Period Mean (original grids) [W/m2] |
Model Period Mean (intersection) [W/m2] |
Model Period Mean (complement) [W/m2] |
Benchmark Period Mean (intersection) [W/m2] |
Benchmark Period Mean (complement) [W/m2] |
Bias [W/m2] |
RMSE [W/m2] |
Phase Shift [months] |
Bias Score [1] |
RMSE Score [1] |
Seasonal Cycle Score [1] |
Spatial Distribution Score [1] |
Interannual Variability Score [1] |
Overall Score [1] |
|||
|---|---|---|---|---|---|---|---|---|---|---|---|---|---|---|---|---|---|
| Benchmark | [-] | 350. | |||||||||||||||
| CLM4.5_CRUNCEPv7 | [-] | 353. | 353. | 0.00 | 349. | 373. | 6.08 | 16.6 | 0.412 | 0.76 | 0.74 | 0.97 | 0.97 | 0.71 | 0.81 | ||
| CLM4.5_GSWP3v1 | [-] | 344. | 344. | 0.00 | 349. | 373. | -3.78 | 14.4 | 0.431 | 0.82 | 0.73 | 0.96 | 0.99 | 0.79 | 0.84 | ||
| CLM4_CRUNCEPv7 | [-] | 353. | 353. | 0.00 | 349. | 373. | 6.08 | 16.6 | 0.412 | 0.76 | 0.74 | 0.97 | 0.97 | 0.71 | 0.81 | ||
| CLM4_GSWP3v1 | [-] | 344. | 344. | 0.00 | 349. | 373. | -3.78 | 14.4 | 0.431 | 0.82 | 0.73 | 0.96 | 0.99 | 0.79 | 0.84 | ||
| CLM5_CRUNCEPv7 | [-] | 353. | 353. | 0.00 | 349. | 373. | 6.08 | 16.6 | 0.412 | 0.76 | 0.74 | 0.97 | 0.97 | 0.71 | 0.81 | ||
| CLM5_GSWP3v1 | [-] | 344. | 344. | 0.00 | 349. | 373. | -3.78 | 14.4 | 0.431 | 0.82 | 0.73 | 0.96 | 0.99 | 0.79 | 0.84 |
Download Data |
Period Mean (original grids) [W/m2] |
Model Period Mean (intersection) [W/m2] |
Model Period Mean (complement) [W/m2] |
Benchmark Period Mean (intersection) [W/m2] |
Benchmark Period Mean (complement) [W/m2] |
Bias [W/m2] |
RMSE [W/m2] |
Phase Shift [months] |
Bias Score [1] |
RMSE Score [1] |
Seasonal Cycle Score [1] |
Spatial Distribution Score [1] |
Interannual Variability Score [1] |
Overall Score [1] |
|||
|---|---|---|---|---|---|---|---|---|---|---|---|---|---|---|---|---|---|
| Benchmark | [-] | 248. | |||||||||||||||
| CLM4.5_CRUNCEPv7 | [-] | 218. | 218. | 0.00 | 247. | 258. | -29.9 | 31.1 | 0.153 | 0.57 | 0.81 | 0.99 | 0.99 | 0.69 | 0.81 | ||
| CLM4.5_GSWP3v1 | [-] | 243. | 243. | 0.00 | 247. | 258. | -4.19 | 13.4 | 0.126 | 0.90 | 0.79 | 0.99 | 1.0 | 0.90 | 0.90 | ||
| CLM4_CRUNCEPv7 | [-] | 218. | 218. | 0.00 | 247. | 258. | -29.9 | 31.1 | 0.153 | 0.57 | 0.81 | 0.99 | 0.99 | 0.69 | 0.81 | ||
| CLM4_GSWP3v1 | [-] | 243. | 243. | 0.00 | 247. | 258. | -4.19 | 13.4 | 0.126 | 0.90 | 0.79 | 0.99 | 1.0 | 0.90 | 0.90 | ||
| CLM5_CRUNCEPv7 | [-] | 218. | 218. | 0.00 | 247. | 258. | -29.9 | 31.1 | 0.153 | 0.57 | 0.81 | 0.99 | 0.99 | 0.69 | 0.81 | ||
| CLM5_GSWP3v1 | [-] | 243. | 243. | 0.00 | 247. | 258. | -4.19 | 13.4 | 0.126 | 0.90 | 0.79 | 0.99 | 1.0 | 0.90 | 0.90 |
Download Data |
Period Mean (original grids) [W/m2] |
Model Period Mean (intersection) [W/m2] |
Model Period Mean (complement) [W/m2] |
Benchmark Period Mean (intersection) [W/m2] |
Benchmark Period Mean (complement) [W/m2] |
Bias [W/m2] |
RMSE [W/m2] |
Phase Shift [months] |
Bias Score [1] |
RMSE Score [1] |
Seasonal Cycle Score [1] |
Spatial Distribution Score [1] |
Interannual Variability Score [1] |
Overall Score [1] |
|||
|---|---|---|---|---|---|---|---|---|---|---|---|---|---|---|---|---|---|
| Benchmark | [-] | 376. | |||||||||||||||
| CLM4.5_CRUNCEPv7 | [-] | 373. | 373. | 0.00 | 371. | 402. | 12.1 | 20.3 | 0.938 | 0.49 | 0.63 | 0.89 | 0.97 | 0.74 | 0.73 | ||
| CLM4.5_GSWP3v1 | [-] | 363. | 363. | 0.00 | 371. | 402. | -1.23 | 14.5 | 0.704 | 0.64 | 0.68 | 0.91 | 0.99 | 0.78 | 0.78 | ||
| CLM4_CRUNCEPv7 | [-] | 373. | 373. | 0.00 | 371. | 402. | 12.1 | 20.3 | 0.938 | 0.49 | 0.63 | 0.89 | 0.97 | 0.74 | 0.73 | ||
| CLM4_GSWP3v1 | [-] | 363. | 363. | 0.00 | 371. | 402. | -1.23 | 14.5 | 0.704 | 0.64 | 0.68 | 0.91 | 0.99 | 0.78 | 0.78 | ||
| CLM5_CRUNCEPv7 | [-] | 373. | 373. | 0.00 | 371. | 402. | 12.1 | 20.3 | 0.938 | 0.49 | 0.63 | 0.89 | 0.97 | 0.74 | 0.73 | ||
| CLM5_GSWP3v1 | [-] | 363. | 363. | 0.00 | 371. | 402. | -1.23 | 14.5 | 0.704 | 0.64 | 0.68 | 0.91 | 0.99 | 0.78 | 0.78 |
Download Data |
Period Mean (original grids) [W/m2] |
Model Period Mean (intersection) [W/m2] |
Model Period Mean (complement) [W/m2] |
Benchmark Period Mean (intersection) [W/m2] |
Benchmark Period Mean (complement) [W/m2] |
Bias [W/m2] |
RMSE [W/m2] |
Phase Shift [months] |
Bias Score [1] |
RMSE Score [1] |
Seasonal Cycle Score [1] |
Spatial Distribution Score [1] |
Interannual Variability Score [1] |
Overall Score [1] |
|||
|---|---|---|---|---|---|---|---|---|---|---|---|---|---|---|---|---|---|
| Benchmark | [-] | 335. | |||||||||||||||
| CLM4.5_CRUNCEPv7 | [-] | 322. | 322. | 0.00 | 333. | 372. | -7.59 | 16.6 | 0.145 | 0.79 | 0.77 | 0.99 | 0.92 | 0.89 | 0.86 | ||
| CLM4.5_GSWP3v1 | [-] | 328. | 328. | 0.00 | 333. | 372. | -2.37 | 9.64 | 0.122 | 0.92 | 0.83 | 0.99 | 1.0 | 0.81 | 0.90 | ||
| CLM4_CRUNCEPv7 | [-] | 322. | 322. | 0.00 | 333. | 372. | -7.59 | 16.6 | 0.145 | 0.79 | 0.77 | 0.99 | 0.92 | 0.89 | 0.86 | ||
| CLM4_GSWP3v1 | [-] | 328. | 328. | 0.00 | 333. | 372. | -2.37 | 9.64 | 0.122 | 0.92 | 0.83 | 0.99 | 1.0 | 0.81 | 0.90 | ||
| CLM5_CRUNCEPv7 | [-] | 322. | 322. | 0.00 | 333. | 372. | -7.59 | 16.6 | 0.145 | 0.79 | 0.77 | 0.99 | 0.92 | 0.89 | 0.86 | ||
| CLM5_GSWP3v1 | [-] | 328. | 328. | 0.00 | 333. | 372. | -2.37 | 9.64 | 0.122 | 0.92 | 0.83 | 0.99 | 1.0 | 0.81 | 0.90 |
Download Data |
Period Mean (original grids) [W/m2] |
Model Period Mean (intersection) [W/m2] |
Model Period Mean (complement) [W/m2] |
Benchmark Period Mean (intersection) [W/m2] |
Benchmark Period Mean (complement) [W/m2] |
Bias [W/m2] |
RMSE [W/m2] |
Phase Shift [months] |
Bias Score [1] |
RMSE Score [1] |
Seasonal Cycle Score [1] |
Spatial Distribution Score [1] |
Interannual Variability Score [1] |
Overall Score [1] |
|||
|---|---|---|---|---|---|---|---|---|---|---|---|---|---|---|---|---|---|
| Benchmark | [-] | 278. | |||||||||||||||
| CLM4.5_CRUNCEPv7 | [-] | 255. | 255. | 0.00 | 277. | 303. | -21.0 | 22.3 | 0.0800 | 0.62 | 0.81 | 0.99 | 1.0 | 0.87 | 0.85 | ||
| CLM4.5_GSWP3v1 | [-] | 275. | 275. | 0.00 | 277. | 303. | -0.971 | 9.62 | 0.0673 | 0.91 | 0.82 | 1.0 | 0.99 | 0.86 | 0.90 | ||
| CLM4_CRUNCEPv7 | [-] | 255. | 255. | 0.00 | 277. | 303. | -21.0 | 22.3 | 0.0800 | 0.62 | 0.81 | 0.99 | 1.0 | 0.87 | 0.85 | ||
| CLM4_GSWP3v1 | [-] | 275. | 275. | 0.00 | 277. | 303. | -0.971 | 9.62 | 0.0673 | 0.91 | 0.82 | 1.0 | 0.99 | 0.86 | 0.90 | ||
| CLM5_CRUNCEPv7 | [-] | 255. | 255. | 0.00 | 277. | 303. | -21.0 | 22.3 | 0.0800 | 0.62 | 0.81 | 0.99 | 1.0 | 0.87 | 0.85 | ||
| CLM5_GSWP3v1 | [-] | 275. | 275. | 0.00 | 277. | 303. | -0.971 | 9.62 | 0.0673 | 0.91 | 0.82 | 1.0 | 0.99 | 0.86 | 0.90 |
Download Data |
Period Mean (original grids) [W/m2] |
Model Period Mean (intersection) [W/m2] |
Model Period Mean (complement) [W/m2] |
Benchmark Period Mean (intersection) [W/m2] |
Benchmark Period Mean (complement) [W/m2] |
Bias [W/m2] |
RMSE [W/m2] |
Phase Shift [months] |
Bias Score [1] |
RMSE Score [1] |
Seasonal Cycle Score [1] |
Spatial Distribution Score [1] |
Interannual Variability Score [1] |
Overall Score [1] |
|||
|---|---|---|---|---|---|---|---|---|---|---|---|---|---|---|---|---|---|
| Benchmark | [-] | 298. | |||||||||||||||
| CLM4.5_CRUNCEPv7 | [-] | 287. | 289. | 0.00 | 298. | 325. | -8.55 | 16.3 | 0.107 | 0.72 | 0.76 | 0.99 | 0.96 | 0.80 | 0.83 | ||
| CLM4.5_GSWP3v1 | [-] | 293. | 294. | 0.00 | 298. | 325. | -3.00 | 12.5 | 0.124 | 0.83 | 0.76 | 0.99 | 0.99 | 0.74 | 0.85 | ||
| CLM4_CRUNCEPv7 | [-] | 287. | 289. | 0.00 | 298. | 325. | -8.55 | 16.3 | 0.107 | 0.72 | 0.76 | 0.99 | 0.96 | 0.80 | 0.83 | ||
| CLM4_GSWP3v1 | [-] | 293. | 294. | 0.00 | 298. | 325. | -3.00 | 12.5 | 0.124 | 0.83 | 0.76 | 0.99 | 0.99 | 0.74 | 0.85 | ||
| CLM5_CRUNCEPv7 | [-] | 287. | 289. | 0.00 | 298. | 325. | -8.55 | 16.3 | 0.107 | 0.72 | 0.76 | 0.99 | 0.96 | 0.80 | 0.83 | ||
| CLM5_GSWP3v1 | [-] | 293. | 294. | 0.00 | 298. | 325. | -3.00 | 12.5 | 0.124 | 0.83 | 0.76 | 0.99 | 0.99 | 0.74 | 0.85 |
Download Data |
Period Mean (original grids) [W/m2] |
Model Period Mean (intersection) [W/m2] |
Model Period Mean (complement) [W/m2] |
Benchmark Period Mean (intersection) [W/m2] |
Benchmark Period Mean (complement) [W/m2] |
Bias [W/m2] |
RMSE [W/m2] |
Phase Shift [months] |
Bias Score [1] |
RMSE Score [1] |
Seasonal Cycle Score [1] |
Spatial Distribution Score [1] |
Interannual Variability Score [1] |
Overall Score [1] |
|||
|---|---|---|---|---|---|---|---|---|---|---|---|---|---|---|---|---|---|
| Benchmark | [-] | 410. | |||||||||||||||
| CLM4.5_CRUNCEPv7 | [-] | 426. | 426. | 0.00 | 410. | 415. | 16.9 | 23.1 | 1.99 | 0.18 | 0.38 | 0.71 | 0.82 | 0.82 | 0.55 | ||
| CLM4.5_GSWP3v1 | [-] | 406. | 406. | 0.00 | 410. | 415. | -2.98 | 10.8 | 1.26 | 0.55 | 0.47 | 0.84 | 0.98 | 0.77 | 0.68 | ||
| CLM4_CRUNCEPv7 | [-] | 426. | 426. | 0.00 | 410. | 415. | 16.9 | 23.1 | 1.99 | 0.18 | 0.38 | 0.71 | 0.82 | 0.82 | 0.55 | ||
| CLM4_GSWP3v1 | [-] | 406. | 406. | 0.00 | 410. | 415. | -2.98 | 10.8 | 1.26 | 0.55 | 0.47 | 0.84 | 0.98 | 0.77 | 0.68 | ||
| CLM5_CRUNCEPv7 | [-] | 426. | 426. | 0.00 | 410. | 415. | 16.9 | 23.1 | 1.99 | 0.18 | 0.38 | 0.71 | 0.82 | 0.82 | 0.55 | ||
| CLM5_GSWP3v1 | [-] | 406. | 406. | 0.00 | 410. | 415. | -2.98 | 10.8 | 1.26 | 0.55 | 0.47 | 0.84 | 0.98 | 0.77 | 0.68 |
Download Data |
Period Mean (original grids) [W/m2] |
Model Period Mean (intersection) [W/m2] |
Model Period Mean (complement) [W/m2] |
Benchmark Period Mean (intersection) [W/m2] |
Benchmark Period Mean (complement) [W/m2] |
Bias [W/m2] |
RMSE [W/m2] |
Phase Shift [months] |
Bias Score [1] |
RMSE Score [1] |
Seasonal Cycle Score [1] |
Spatial Distribution Score [1] |
Interannual Variability Score [1] |
Overall Score [1] |
|||
|---|---|---|---|---|---|---|---|---|---|---|---|---|---|---|---|---|---|
| Benchmark | [-] | 379. | |||||||||||||||
| CLM4.5_CRUNCEPv7 | [-] | 386. | 385. | 0.00 | 380. | 374. | 6.23 | 15.3 | 1.60 | 0.61 | 0.62 | 0.76 | 0.95 | 0.78 | 0.72 | ||
| CLM4.5_GSWP3v1 | [-] | 377. | 376. | 0.00 | 380. | 374. | -2.98 | 11.2 | 0.682 | 0.77 | 0.65 | 0.94 | 0.99 | 0.84 | 0.81 | ||
| CLM4_CRUNCEPv7 | [-] | 386. | 385. | 0.00 | 380. | 374. | 6.23 | 15.3 | 1.60 | 0.61 | 0.62 | 0.76 | 0.95 | 0.78 | 0.72 | ||
| CLM4_GSWP3v1 | [-] | 377. | 376. | 0.00 | 380. | 374. | -2.98 | 11.2 | 0.682 | 0.77 | 0.65 | 0.94 | 0.99 | 0.84 | 0.81 | ||
| CLM5_CRUNCEPv7 | [-] | 386. | 385. | 0.00 | 380. | 374. | 6.23 | 15.3 | 1.60 | 0.61 | 0.62 | 0.76 | 0.95 | 0.78 | 0.72 | ||
| CLM5_GSWP3v1 | [-] | 377. | 376. | 0.00 | 380. | 374. | -2.98 | 11.2 | 0.682 | 0.77 | 0.65 | 0.94 | 0.99 | 0.84 | 0.81 |
Download Data |
Period Mean (original grids) [W/m2] |
Model Period Mean (intersection) [W/m2] |
Model Period Mean (complement) [W/m2] |
Benchmark Period Mean (intersection) [W/m2] |
Benchmark Period Mean (complement) [W/m2] |
Bias [W/m2] |
RMSE [W/m2] |
Phase Shift [months] |
Bias Score [1] |
RMSE Score [1] |
Seasonal Cycle Score [1] |
Spatial Distribution Score [1] |
Interannual Variability Score [1] |
Overall Score [1] |
|||
|---|---|---|---|---|---|---|---|---|---|---|---|---|---|---|---|---|---|
| Benchmark | [-] | 303. | |||||||||||||||
| CLM4.5_CRUNCEPv7 | [-] | 289. | 288. | 0.00 | 298. | 346. | -5.88 | 22.2 | 0.555 | 0.49 | 0.54 | 0.95 | 0.98 | 0.68 | 0.69 | ||
| CLM4.5_GSWP3v1 | [-] | 301. | 301. | 0.00 | 298. | 346. | 6.58 | 22.1 | 0.556 | 0.48 | 0.53 | 0.95 | 0.93 | 0.75 | 0.70 | ||
| CLM4_CRUNCEPv7 | [-] | 289. | 288. | 0.00 | 298. | 346. | -5.88 | 22.2 | 0.555 | 0.49 | 0.54 | 0.95 | 0.98 | 0.68 | 0.69 | ||
| CLM4_GSWP3v1 | [-] | 301. | 301. | 0.00 | 298. | 346. | 6.58 | 22.1 | 0.556 | 0.48 | 0.53 | 0.95 | 0.93 | 0.75 | 0.70 | ||
| CLM5_CRUNCEPv7 | [-] | 289. | 288. | 0.00 | 298. | 346. | -5.88 | 22.2 | 0.555 | 0.49 | 0.54 | 0.95 | 0.98 | 0.68 | 0.69 | ||
| CLM5_GSWP3v1 | [-] | 301. | 301. | 0.00 | 298. | 346. | 6.58 | 22.1 | 0.556 | 0.48 | 0.53 | 0.95 | 0.93 | 0.75 | 0.70 |
Temporally integrated period mean