Mean State
Download Data |
Period Mean (original grids) [Pg] |
Model Period Mean (intersection) [Pg] |
Model Period Mean (complement) [Pg] |
Benchmark Period Mean (intersection) [Pg] |
Benchmark Period Mean (complement) [Pg] |
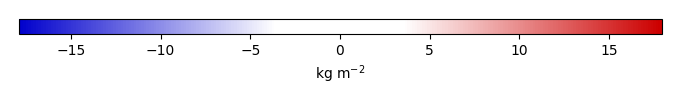
Bias [kg m-2] |
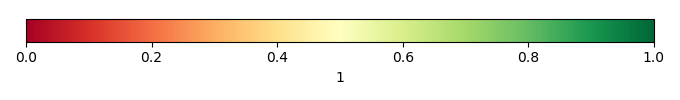
Bias Score [1] |
Spatial Distribution Score [1] |
Overall Score [1] |
|||
|---|---|---|---|---|---|---|---|---|---|---|---|---|
| Benchmark | [-] | 30.1 | ||||||||||
| CLM4.5_CRUNCEPv7 | [-] | 560. | 27.8 | 532. | 29.9 | 0.195 | 0.0652 | 0.600 | 0.827 | 0.714 | ||
| CLM4.5_GSWP3v1 | [-] | 453. | 21.1 | 432. | 29.9 | 0.195 | -0.690 | 0.585 | 0.717 | 0.651 | ||
| CLM4_CRUNCEPv7 | [-] | 582. | 22.9 | 559. | 29.9 | 0.195 | -0.538 | 0.615 | 0.774 | 0.694 | ||
| CLM4_GSWP3v1 | [-] | 467. | 18.2 | 448. | 29.9 | 0.195 | -1.10 | 0.592 | 0.587 | 0.590 | ||
| CLM5_CRUNCEPv7 | [-] | 589. | 29.0 | 560. | 29.9 | 0.195 | 0.319 | 0.597 | 0.839 | 0.718 | ||
| CLM5_GSWP3v1 | [-] | 487. | 22.3 | 465. | 29.9 | 0.195 | -0.481 | 0.575 | 0.774 | 0.674 |
Download Data |
Period Mean (original grids) [Pg] |
Model Period Mean (intersection) [Pg] |
Model Period Mean (complement) [Pg] |
Benchmark Period Mean (intersection) [Pg] |
Benchmark Period Mean (complement) [Pg] |
Bias [kg m-2] |
Bias Score [1] |
Spatial Distribution Score [1] |
Overall Score [1] |
|||
|---|---|---|---|---|---|---|---|---|---|---|---|---|
| Benchmark | [-] | 1.44 | ||||||||||
| CLM4.5_CRUNCEPv7 | [-] | 9.20 | 3.15 | 5.91 | 1.41 | 0.0279 | 1.69 | 0.483 | 0.805 | 0.644 | ||
| CLM4.5_GSWP3v1 | [-] | 7.93 | 2.85 | 4.96 | 1.41 | 0.0279 | 1.42 | 0.540 | 0.874 | 0.707 | ||
| CLM4_CRUNCEPv7 | [-] | 4.27 | 0.825 | 3.37 | 1.41 | 0.0279 | -0.354 | 0.498 | 0.646 | 0.572 | ||
| CLM4_GSWP3v1 | [-] | 3.07 | 0.712 | 2.34 | 1.41 | 0.0279 | -0.483 | 0.516 | 0.480 | 0.498 | ||
| CLM5_CRUNCEPv7 | [-] | 16.4 | 5.84 | 10.4 | 1.41 | 0.0279 | 4.22 | 0.263 | 0.351 | 0.307 | ||
| CLM5_GSWP3v1 | [-] | 14.5 | 5.95 | 8.42 | 1.41 | 0.0279 | 4.18 | 0.208 | 0.467 | 0.337 |
Download Data |
Period Mean (original grids) [Pg] |
Model Period Mean (intersection) [Pg] |
Model Period Mean (complement) [Pg] |
Benchmark Period Mean (intersection) [Pg] |
Benchmark Period Mean (complement) [Pg] |
Bias [kg m-2] |
Bias Score [1] |
Spatial Distribution Score [1] |
Overall Score [1] |
|||
|---|---|---|---|---|---|---|---|---|---|---|---|---|
| Benchmark | [-] | 0.00649 | ||||||||||
| CLM4.5_CRUNCEPv7 | [-] | 11.4 | 0.0173 | 11.1 | 0.00649 | 0.148 | 0.562 | 0.793 | 0.677 | |||
| CLM4.5_GSWP3v1 | [-] | 8.49 | 0.0210 | 8.21 | 0.00649 | 0.191 | 0.604 | 0.791 | 0.698 | |||
| CLM4_CRUNCEPv7 | [-] | 5.39 | 0.00905 | 5.08 | 0.00649 | 0.00778 | 0.433 | 0.0945 | 0.264 | |||
| CLM4_GSWP3v1 | [-] | 4.65 | 0.0130 | 4.37 | 0.00649 | 0.0455 | 0.422 | 0.0913 | 0.257 | |||
| CLM5_CRUNCEPv7 | [-] | 11.9 | 0.0238 | 11.6 | 0.00649 | 0.192 | 0.544 | 0.674 | 0.609 | |||
| CLM5_GSWP3v1 | [-] | 10.2 | 0.0250 | 9.91 | 0.00649 | 0.233 | 0.584 | 0.753 | 0.668 |
Download Data |
Period Mean (original grids) [Pg] |
Model Period Mean (intersection) [Pg] |
Model Period Mean (complement) [Pg] |
Benchmark Period Mean (intersection) [Pg] |
Benchmark Period Mean (complement) [Pg] |
Bias [kg m-2] |
Bias Score [1] |
Spatial Distribution Score [1] |
Overall Score [1] |
|||
|---|---|---|---|---|---|---|---|---|---|---|---|---|
| Benchmark | [-] | 17.4 | ||||||||||
| CLM4.5_CRUNCEPv7 | [-] | 20.4 | 19.9 | 0.343 | 17.3 | 0.0180 | 1.01 | 0.679 | 0.915 | 0.797 | ||
| CLM4.5_GSWP3v1 | [-] | 14.7 | 14.2 | 0.283 | 17.3 | 0.0180 | -0.425 | 0.657 | 0.912 | 0.784 | ||
| CLM4_CRUNCEPv7 | [-] | 16.4 | 16.0 | 0.277 | 17.3 | 0.0180 | -0.0107 | 0.674 | 0.911 | 0.792 | ||
| CLM4_GSWP3v1 | [-] | 13.4 | 13.0 | 0.213 | 17.3 | 0.0180 | -0.783 | 0.661 | 0.817 | 0.739 | ||
| CLM5_CRUNCEPv7 | [-] | 17.8 | 17.3 | 0.314 | 17.3 | 0.0180 | 0.419 | 0.686 | 0.919 | 0.803 | ||
| CLM5_GSWP3v1 | [-] | 12.0 | 11.6 | 0.244 | 17.3 | 0.0180 | -1.06 | 0.651 | 0.854 | 0.753 |
Download Data |
Period Mean (original grids) [Pg] |
Model Period Mean (intersection) [Pg] |
Model Period Mean (complement) [Pg] |
Benchmark Period Mean (intersection) [Pg] |
Benchmark Period Mean (complement) [Pg] |
Bias [kg m-2] |
Bias Score [1] |
Spatial Distribution Score [1] |
Overall Score [1] |
|||
|---|---|---|---|---|---|---|---|---|---|---|---|---|
| Benchmark | [-] | 1.52 | ||||||||||
| CLM4.5_CRUNCEPv7 | [-] | 34.8 | 1.47 | 33.5 | 1.46 | 0.0621 | 1.42 | 0.601 | 0.759 | 0.680 | ||
| CLM4.5_GSWP3v1 | [-] | 28.1 | 1.14 | 27.2 | 1.46 | 0.0621 | -0.184 | 0.551 | 0.621 | 0.586 | ||
| CLM4_CRUNCEPv7 | [-] | 25.1 | 1.02 | 24.2 | 1.46 | 0.0621 | -0.890 | 0.476 | 0.682 | 0.579 | ||
| CLM4_GSWP3v1 | [-] | 16.3 | 0.518 | 15.9 | 1.46 | 0.0621 | -3.45 | 0.429 | 0.406 | 0.417 | ||
| CLM5_CRUNCEPv7 | [-] | 56.8 | 2.46 | 54.5 | 1.46 | 0.0621 | 7.01 | 0.557 | 0.882 | 0.720 | ||
| CLM5_GSWP3v1 | [-] | 43.6 | 1.80 | 42.0 | 1.46 | 0.0621 | 3.72 | 0.646 | 0.903 | 0.774 |
Download Data |
Period Mean (original grids) [Pg] |
Model Period Mean (intersection) [Pg] |
Model Period Mean (complement) [Pg] |
Benchmark Period Mean (intersection) [Pg] |
Benchmark Period Mean (complement) [Pg] |
Bias [kg m-2] |
Bias Score [1] |
Spatial Distribution Score [1] |
Overall Score [1] |
|||
|---|---|---|---|---|---|---|---|---|---|---|---|---|
| Benchmark | [-] | 9.78 | ||||||||||
| CLM4.5_CRUNCEPv7 | [-] | 3.42 | 3.26 | 0.205 | 9.71 | 0.0683 | -1.67 | 0.475 | 0.261 | 0.368 | ||
| CLM4.5_GSWP3v1 | [-] | 2.99 | 2.84 | 0.195 | 9.71 | 0.0683 | -1.78 | 0.464 | 0.209 | 0.337 | ||
| CLM4_CRUNCEPv7 | [-] | 5.11 | 4.98 | 0.169 | 9.71 | 0.0683 | -1.19 | 0.547 | 0.421 | 0.484 | ||
| CLM4_GSWP3v1 | [-] | 4.00 | 3.89 | 0.164 | 9.71 | 0.0683 | -1.53 | 0.502 | 0.225 | 0.364 | ||
| CLM5_CRUNCEPv7 | [-] | 3.49 | 3.35 | 0.157 | 9.71 | 0.0683 | -1.61 | 0.492 | 0.568 | 0.530 | ||
| CLM5_GSWP3v1 | [-] | 3.04 | 2.93 | 0.149 | 9.71 | 0.0683 | -1.73 | 0.481 | 0.415 | 0.448 |
Temporally integrated period mean