Mean State
Download Data |
Period Mean (original grids) [Pg yr-1] |
Model Period Mean (intersection) [Pg yr-1] |
Model Period Mean (complement) [Pg yr-1] |
Benchmark Period Mean (intersection) [Pg yr-1] |
Benchmark Period Mean (complement) [Pg yr-1] |
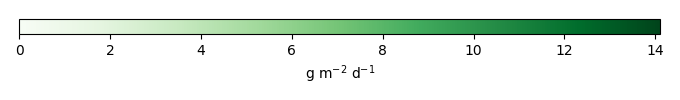
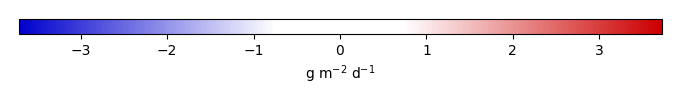
Bias [g m-2 d-1] |
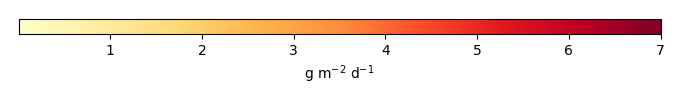
RMSE [g m-2 d-1] |
Phase Shift [months] |
Bias Score [1] |
RMSE Score [1] |
Seasonal Cycle Score [1] |
Spatial Distribution Score [1] |
Overall Score [1] |
|||
|---|---|---|---|---|---|---|---|---|---|---|---|---|---|---|---|---|
| Benchmark | [-] | 8.19 | ||||||||||||||
| CLM4.5_CRUNCEPv7 | [-] | 8.74 | 8.77 | 0.229 | 8.18 | 0.00755 | 0.534 | 2.18 | 2.49 | 0.161 | 0.245 | 0.535 | 0.875 | 0.412 | ||
| CLM4.5_GSWP3v1 | [-] | 7.63 | 7.61 | 0.236 | 8.18 | 0.00755 | -0.199 | 1.93 | 2.63 | 0.291 | 0.201 | 0.526 | 0.945 | 0.433 | ||
| CLM4_CRUNCEPv7 | [-] | 11.0 | 11.2 | 0.204 | 8.18 | 0.00755 | 2.05 | 3.23 | 2.40 | 0.109 | 0.114 | 0.530 | 0.755 | 0.324 | ||
| CLM4_GSWP3v1 | [-] | 10.1 | 10.3 | 0.192 | 8.18 | 0.00755 | 1.43 | 2.65 | 2.49 | 0.158 | 0.134 | 0.536 | 0.840 | 0.360 | ||
| CLM5_CRUNCEPv7 | [-] | 7.22 | 7.30 | 0.207 | 8.18 | 0.00755 | -0.403 | 1.71 | 2.07 | 0.316 | 0.270 | 0.588 | 0.981 | 0.485 | ||
| CLM5_GSWP3v1 | [-] | 6.96 | 6.98 | 0.219 | 8.18 | 0.00755 | -0.618 | 1.70 | 2.16 | 0.291 | 0.276 | 0.590 | 0.966 | 0.480 |
Download Data |
Period Mean (original grids) [Pg yr-1] |
Model Period Mean (intersection) [Pg yr-1] |
Model Period Mean (complement) [Pg yr-1] |
Benchmark Period Mean (intersection) [Pg yr-1] |
Benchmark Period Mean (complement) [Pg yr-1] |
Bias [g m-2 d-1] |
RMSE [g m-2 d-1] |
Phase Shift [months] |
Bias Score [1] |
RMSE Score [1] |
Seasonal Cycle Score [1] |
Spatial Distribution Score [1] |
Overall Score [1] |
|||
|---|---|---|---|---|---|---|---|---|---|---|---|---|---|---|---|---|
| Benchmark | [-] | 5.55 | ||||||||||||||
| CLM4.5_CRUNCEPv7 | [-] | 3.56 | 3.31 | 0.0120 | 5.55 | 0.00508 | -0.897 | 1.60 | 1.10 | 0.456 | 0.478 | 0.809 | 0.774 | 0.599 | ||
| CLM4.5_GSWP3v1 | [-] | 3.51 | 3.28 | 0.0142 | 5.55 | 0.00508 | -0.905 | 1.61 | 1.05 | 0.451 | 0.479 | 0.818 | 0.703 | 0.586 | ||
| CLM4_CRUNCEPv7 | [-] | 5.90 | 5.49 | 0.0139 | 5.55 | 0.00508 | -0.0216 | 1.26 | 0.948 | 0.637 | 0.481 | 0.870 | 0.936 | 0.681 | ||
| CLM4_GSWP3v1 | [-] | 6.27 | 5.87 | 0.0140 | 5.55 | 0.00508 | 0.136 | 1.20 | 0.872 | 0.672 | 0.489 | 0.866 | 0.948 | 0.693 | ||
| CLM5_CRUNCEPv7 | [-] | 5.26 | 4.98 | 0.0202 | 5.55 | 0.00508 | -0.213 | 1.75 | 1.18 | 0.585 | 0.405 | 0.815 | 0.889 | 0.620 | ||
| CLM5_GSWP3v1 | [-] | 5.36 | 5.09 | 0.0260 | 5.55 | 0.00508 | -0.166 | 1.76 | 1.52 | 0.575 | 0.417 | 0.742 | 0.834 | 0.597 |
Download Data |
Period Mean (original grids) [Pg yr-1] |
Model Period Mean (intersection) [Pg yr-1] |
Model Period Mean (complement) [Pg yr-1] |
Benchmark Period Mean (intersection) [Pg yr-1] |
Benchmark Period Mean (complement) [Pg yr-1] |
Bias [g m-2 d-1] |
RMSE [g m-2 d-1] |
Phase Shift [months] |
Bias Score [1] |
RMSE Score [1] |
Seasonal Cycle Score [1] |
Spatial Distribution Score [1] |
Overall Score [1] |
|||
|---|---|---|---|---|---|---|---|---|---|---|---|---|---|---|---|---|
| Benchmark | [-] | 9.94 | ||||||||||||||
| CLM4.5_CRUNCEPv7 | [-] | 6.13 | 5.75 | 0.314 | 9.92 | 0.0215 | -1.13 | 1.95 | 1.48 | 0.343 | 0.445 | 0.747 | 0.916 | 0.579 | ||
| CLM4.5_GSWP3v1 | [-] | 5.16 | 4.83 | 0.279 | 9.92 | 0.0215 | -1.42 | 2.09 | 1.61 | 0.299 | 0.449 | 0.718 | 0.824 | 0.548 | ||
| CLM4_CRUNCEPv7 | [-] | 7.41 | 7.05 | 0.270 | 9.92 | 0.0215 | -0.780 | 1.85 | 1.36 | 0.380 | 0.442 | 0.767 | 0.881 | 0.582 | ||
| CLM4_GSWP3v1 | [-] | 6.89 | 6.57 | 0.258 | 9.92 | 0.0215 | -0.927 | 1.72 | 1.42 | 0.420 | 0.448 | 0.763 | 0.942 | 0.604 | ||
| CLM5_CRUNCEPv7 | [-] | 8.89 | 8.42 | 0.383 | 9.92 | 0.0215 | -0.301 | 1.99 | 1.07 | 0.460 | 0.355 | 0.884 | 0.901 | 0.591 | ||
| CLM5_GSWP3v1 | [-] | 7.00 | 6.60 | 0.346 | 9.92 | 0.0215 | -0.858 | 2.08 | 1.35 | 0.391 | 0.375 | 0.822 | 0.914 | 0.575 |
Download Data |
Period Mean (original grids) [Pg yr-1] |
Model Period Mean (intersection) [Pg yr-1] |
Model Period Mean (complement) [Pg yr-1] |
Benchmark Period Mean (intersection) [Pg yr-1] |
Benchmark Period Mean (complement) [Pg yr-1] |
Bias [g m-2 d-1] |
RMSE [g m-2 d-1] |
Phase Shift [months] |
Bias Score [1] |
RMSE Score [1] |
Seasonal Cycle Score [1] |
Spatial Distribution Score [1] |
Overall Score [1] |
|||
|---|---|---|---|---|---|---|---|---|---|---|---|---|---|---|---|---|
| Benchmark | [-] | 1.03 | ||||||||||||||
| CLM4.5_CRUNCEPv7 | [-] | 1.12 | 1.09 | 0.0358 | 1.03 | 0.00296 | 0.119 | 1.20 | 0.193 | 0.684 | 0.498 | 0.983 | 0.752 | 0.683 | ||
| CLM4.5_GSWP3v1 | [-] | 1.12 | 1.09 | 0.0353 | 1.03 | 0.00296 | 0.118 | 1.13 | 0.392 | 0.689 | 0.511 | 0.967 | 0.767 | 0.689 | ||
| CLM4_CRUNCEPv7 | [-] | 0.311 | 0.293 | 0.0237 | 1.03 | 0.00296 | -0.597 | 1.24 | 0.990 | 0.585 | 0.448 | 0.886 | 0.788 | 0.631 | ||
| CLM4_GSWP3v1 | [-] | 0.338 | 0.323 | 0.0209 | 1.03 | 0.00296 | -0.574 | 1.19 | 0.933 | 0.601 | 0.462 | 0.889 | 0.804 | 0.644 | ||
| CLM5_CRUNCEPv7 | [-] | 1.63 | 1.58 | 0.0533 | 1.03 | 0.00296 | 0.571 | 2.18 | 0.311 | 0.529 | 0.306 | 0.969 | 0.512 | 0.524 | ||
| CLM5_GSWP3v1 | [-] | 1.61 | 1.56 | 0.0509 | 1.03 | 0.00296 | 0.549 | 1.85 | 0.240 | 0.592 | 0.393 | 0.981 | 0.623 | 0.596 |
Download Data |
Period Mean (original grids) [Pg yr-1] |
Model Period Mean (intersection) [Pg yr-1] |
Model Period Mean (complement) [Pg yr-1] |
Benchmark Period Mean (intersection) [Pg yr-1] |
Benchmark Period Mean (complement) [Pg yr-1] |
Bias [g m-2 d-1] |
RMSE [g m-2 d-1] |
Phase Shift [months] |
Bias Score [1] |
RMSE Score [1] |
Seasonal Cycle Score [1] |
Spatial Distribution Score [1] |
Overall Score [1] |
|||
|---|---|---|---|---|---|---|---|---|---|---|---|---|---|---|---|---|
| Benchmark | [-] | 7.13 | ||||||||||||||
| CLM4.5_CRUNCEPv7 | [-] | 9.60 | 8.10 | 1.45 | 6.94 | 0.197 | 3.71 | 3.96 | 1.83 | 0.0280 | 0.213 | 0.757 | 0.778 | 0.398 | ||
| CLM4.5_GSWP3v1 | [-] | 8.36 | 7.13 | 1.19 | 6.94 | 0.197 | 2.40 | 2.91 | 2.25 | 0.151 | 0.164 | 0.658 | 0.793 | 0.386 | ||
| CLM4_CRUNCEPv7 | [-] | 12.5 | 10.7 | 1.69 | 6.94 | 0.197 | 6.67 | 6.92 | 2.05 | 0.00798 | 0.110 | 0.723 | 0.976 | 0.385 | ||
| CLM4_GSWP3v1 | [-] | 10.7 | 9.32 | 1.38 | 6.94 | 0.197 | 4.76 | 5.14 | 2.15 | 0.0240 | 0.0810 | 0.699 | 0.977 | 0.372 | ||
| CLM5_CRUNCEPv7 | [-] | 7.05 | 5.92 | 1.09 | 6.94 | 0.197 | 0.910 | 2.10 | 1.59 | 0.191 | 0.193 | 0.804 | 0.299 | 0.336 | ||
| CLM5_GSWP3v1 | [-] | 6.19 | 5.16 | 0.976 | 6.94 | 0.197 | -0.0181 | 2.32 | 1.99 | 0.0902 | 0.187 | 0.712 | 0.283 | 0.292 |
Download Data |
Period Mean (original grids) [Pg yr-1] |
Model Period Mean (intersection) [Pg yr-1] |
Model Period Mean (complement) [Pg yr-1] |
Benchmark Period Mean (intersection) [Pg yr-1] |
Benchmark Period Mean (complement) [Pg yr-1] |
Bias [g m-2 d-1] |
RMSE [g m-2 d-1] |
Phase Shift [months] |
Bias Score [1] |
RMSE Score [1] |
Seasonal Cycle Score [1] |
Spatial Distribution Score [1] |
Overall Score [1] |
|||
|---|---|---|---|---|---|---|---|---|---|---|---|---|---|---|---|---|
| Benchmark | [-] | 6.86 | ||||||||||||||
| CLM4.5_CRUNCEPv7 | [-] | 7.77 | 7.51 | 0.0812 | 6.85 | 0.00296 | 0.233 | 1.34 | 0.529 | 0.783 | 0.661 | 0.962 | 0.797 | 0.773 | ||
| CLM4.5_GSWP3v1 | [-] | 6.85 | 6.62 | 0.0753 | 6.85 | 0.00296 | -0.0388 | 1.29 | 0.638 | 0.800 | 0.660 | 0.955 | 0.880 | 0.791 | ||
| CLM4_CRUNCEPv7 | [-] | 7.77 | 7.52 | 0.0792 | 6.85 | 0.00296 | 0.242 | 1.51 | 0.504 | 0.750 | 0.631 | 0.962 | 0.679 | 0.730 | ||
| CLM4_GSWP3v1 | [-] | 6.42 | 6.21 | 0.0610 | 6.85 | 0.00296 | -0.170 | 1.54 | 0.637 | 0.753 | 0.603 | 0.954 | 0.858 | 0.754 | ||
| CLM5_CRUNCEPv7 | [-] | 9.43 | 9.11 | 0.0917 | 6.85 | 0.00296 | 0.730 | 1.79 | 0.472 | 0.734 | 0.576 | 0.967 | 0.863 | 0.743 | ||
| CLM5_GSWP3v1 | [-] | 7.45 | 7.19 | 0.0801 | 6.85 | 0.00296 | 0.132 | 1.38 | 0.512 | 0.792 | 0.649 | 0.964 | 0.822 | 0.775 |
Download Data |
Period Mean (original grids) [Pg yr-1] |
Model Period Mean (intersection) [Pg yr-1] |
Model Period Mean (complement) [Pg yr-1] |
Benchmark Period Mean (intersection) [Pg yr-1] |
Benchmark Period Mean (complement) [Pg yr-1] |
Bias [g m-2 d-1] |
RMSE [g m-2 d-1] |
Phase Shift [months] |
Bias Score [1] |
RMSE Score [1] |
Seasonal Cycle Score [1] |
Spatial Distribution Score [1] |
Overall Score [1] |
|||
|---|---|---|---|---|---|---|---|---|---|---|---|---|---|---|---|---|
| Benchmark | [-] | 10.1 | ||||||||||||||
| CLM4.5_CRUNCEPv7 | [-] | 11.4 | 11.1 | 0.409 | 10.0 | 0.0375 | 0.271 | 1.15 | 0.800 | 0.643 | 0.551 | 0.970 | 0.892 | 0.722 | ||
| CLM4.5_GSWP3v1 | [-] | 11.3 | 11.0 | 0.379 | 10.0 | 0.0375 | 0.243 | 1.12 | 0.871 | 0.653 | 0.577 | 0.969 | 0.901 | 0.735 | ||
| CLM4_CRUNCEPv7 | [-] | 13.3 | 13.0 | 0.462 | 10.0 | 0.0375 | 0.575 | 1.43 | 0.818 | 0.522 | 0.529 | 0.968 | 0.741 | 0.658 | ||
| CLM4_GSWP3v1 | [-] | 12.4 | 12.2 | 0.394 | 10.0 | 0.0375 | 0.431 | 1.29 | 0.825 | 0.556 | 0.575 | 0.968 | 0.808 | 0.696 | ||
| CLM5_CRUNCEPv7 | [-] | 11.1 | 10.9 | 0.370 | 10.0 | 0.0375 | 0.232 | 1.29 | 1.07 | 0.763 | 0.521 | 0.928 | 0.970 | 0.740 | ||
| CLM5_GSWP3v1 | [-] | 10.5 | 10.3 | 0.320 | 10.0 | 0.0375 | 0.128 | 1.24 | 1.04 | 0.706 | 0.547 | 0.926 | 0.950 | 0.735 |
Download Data |
Period Mean (original grids) [Pg yr-1] |
Model Period Mean (intersection) [Pg yr-1] |
Model Period Mean (complement) [Pg yr-1] |
Benchmark Period Mean (intersection) [Pg yr-1] |
Benchmark Period Mean (complement) [Pg yr-1] |
Bias [g m-2 d-1] |
RMSE [g m-2 d-1] |
Phase Shift [months] |
Bias Score [1] |
RMSE Score [1] |
Seasonal Cycle Score [1] |
Spatial Distribution Score [1] |
Overall Score [1] |
|||
|---|---|---|---|---|---|---|---|---|---|---|---|---|---|---|---|---|
| Benchmark | [-] | 8.37 | ||||||||||||||
| CLM4.5_CRUNCEPv7 | [-] | 8.30 | 7.59 | 0.551 | 8.32 | 0.0454 | 0.234 | 2.07 | 1.08 | 0.439 | 0.369 | 0.886 | 0.898 | 0.592 | ||
| CLM4.5_GSWP3v1 | [-] | 7.77 | 7.13 | 0.498 | 8.32 | 0.0454 | 0.00409 | 2.00 | 1.22 | 0.437 | 0.390 | 0.848 | 0.924 | 0.598 | ||
| CLM4_CRUNCEPv7 | [-] | 10.7 | 9.90 | 0.551 | 8.32 | 0.0454 | 1.19 | 2.35 | 1.06 | 0.390 | 0.315 | 0.894 | 0.823 | 0.547 | ||
| CLM4_GSWP3v1 | [-] | 10.1 | 9.49 | 0.462 | 8.32 | 0.0454 | 0.941 | 2.10 | 1.12 | 0.415 | 0.378 | 0.879 | 0.890 | 0.588 | ||
| CLM5_CRUNCEPv7 | [-] | 7.42 | 6.79 | 0.513 | 8.32 | 0.0454 | -0.162 | 2.05 | 2.27 | 0.474 | 0.346 | 0.676 | 0.951 | 0.559 | ||
| CLM5_GSWP3v1 | [-] | 7.16 | 6.53 | 0.481 | 8.32 | 0.0454 | -0.302 | 2.05 | 2.75 | 0.468 | 0.353 | 0.581 | 0.951 | 0.541 |
Download Data |
Period Mean (original grids) [Pg yr-1] |
Model Period Mean (intersection) [Pg yr-1] |
Model Period Mean (complement) [Pg yr-1] |
Benchmark Period Mean (intersection) [Pg yr-1] |
Benchmark Period Mean (complement) [Pg yr-1] |
Bias [g m-2 d-1] |
RMSE [g m-2 d-1] |
Phase Shift [months] |
Bias Score [1] |
RMSE Score [1] |
Seasonal Cycle Score [1] |
Spatial Distribution Score [1] |
Overall Score [1] |
|||
|---|---|---|---|---|---|---|---|---|---|---|---|---|---|---|---|---|
| Benchmark | [-] | 1.28 | ||||||||||||||
| CLM4.5_CRUNCEPv7 | [-] | 1.27 | 1.30 | 0.0217 | 1.28 | 0.00137 | 0.0423 | 1.07 | 0.457 | 0.766 | 0.568 | 0.970 | 0.845 | 0.743 | ||
| CLM4.5_GSWP3v1 | [-] | 1.29 | 1.31 | 0.0203 | 1.28 | 0.00137 | 0.0534 | 0.936 | 0.372 | 0.800 | 0.611 | 0.972 | 0.948 | 0.788 | ||
| CLM4_CRUNCEPv7 | [-] | 0.261 | 0.272 | 0.0144 | 1.28 | 0.00137 | -0.781 | 1.45 | 1.07 | 0.573 | 0.447 | 0.923 | 0.711 | 0.620 | ||
| CLM4_GSWP3v1 | [-] | 0.242 | 0.258 | 0.00758 | 1.28 | 0.00137 | -0.801 | 1.45 | 1.04 | 0.571 | 0.441 | 0.925 | 0.631 | 0.602 | ||
| CLM5_CRUNCEPv7 | [-] | 2.30 | 2.33 | 0.0389 | 1.28 | 0.00137 | 0.886 | 2.61 | 0.189 | 0.554 | 0.283 | 0.991 | 0.679 | 0.558 | ||
| CLM5_GSWP3v1 | [-] | 1.99 | 2.02 | 0.0328 | 1.28 | 0.00137 | 0.631 | 1.93 | 0.168 | 0.663 | 0.399 | 0.993 | 0.840 | 0.659 |
Download Data |
Period Mean (original grids) [Pg yr-1] |
Model Period Mean (intersection) [Pg yr-1] |
Model Period Mean (complement) [Pg yr-1] |
Benchmark Period Mean (intersection) [Pg yr-1] |
Benchmark Period Mean (complement) [Pg yr-1] |
Bias [g m-2 d-1] |
RMSE [g m-2 d-1] |
Phase Shift [months] |
Bias Score [1] |
RMSE Score [1] |
Seasonal Cycle Score [1] |
Spatial Distribution Score [1] |
Overall Score [1] |
|||
|---|---|---|---|---|---|---|---|---|---|---|---|---|---|---|---|---|
| Benchmark | [-] | 3.53 | ||||||||||||||
| CLM4.5_CRUNCEPv7 | [-] | 3.47 | 3.02 | 0.423 | 3.49 | 0.0402 | 0.0255 | 0.878 | 1.49 | 0.530 | 0.359 | 0.874 | 0.924 | 0.609 | ||
| CLM4.5_GSWP3v1 | [-] | 3.57 | 3.11 | 0.434 | 3.49 | 0.0402 | 0.0690 | 0.907 | 1.57 | 0.510 | 0.367 | 0.870 | 0.916 | 0.606 | ||
| CLM4_CRUNCEPv7 | [-] | 3.15 | 2.72 | 0.400 | 3.49 | 0.0402 | -0.0920 | 0.727 | 1.58 | 0.495 | 0.425 | 0.871 | 0.864 | 0.616 | ||
| CLM4_GSWP3v1 | [-] | 3.46 | 3.04 | 0.395 | 3.49 | 0.0402 | 0.0173 | 0.716 | 1.66 | 0.551 | 0.402 | 0.865 | 0.889 | 0.622 | ||
| CLM5_CRUNCEPv7 | [-] | 5.05 | 4.50 | 0.517 | 3.49 | 0.0402 | 0.601 | 1.37 | 1.71 | 0.427 | 0.229 | 0.845 | 0.793 | 0.505 | ||
| CLM5_GSWP3v1 | [-] | 4.92 | 4.36 | 0.531 | 3.49 | 0.0402 | 0.562 | 1.29 | 2.04 | 0.452 | 0.258 | 0.809 | 0.817 | 0.519 |
Download Data |
Period Mean (original grids) [Pg yr-1] |
Model Period Mean (intersection) [Pg yr-1] |
Model Period Mean (complement) [Pg yr-1] |
Benchmark Period Mean (intersection) [Pg yr-1] |
Benchmark Period Mean (complement) [Pg yr-1] |
Bias [g m-2 d-1] |
RMSE [g m-2 d-1] |
Phase Shift [months] |
Bias Score [1] |
RMSE Score [1] |
Seasonal Cycle Score [1] |
Spatial Distribution Score [1] |
Overall Score [1] |
|||
|---|---|---|---|---|---|---|---|---|---|---|---|---|---|---|---|---|
| Benchmark | [-] | 5.29 | ||||||||||||||
| CLM4.5_CRUNCEPv7 | [-] | 5.15 | 4.85 | 0.229 | 5.26 | 0.0312 | 0.154 | 1.58 | 0.556 | 0.765 | 0.568 | 0.961 | 0.892 | 0.751 | ||
| CLM4.5_GSWP3v1 | [-] | 4.76 | 4.50 | 0.204 | 5.26 | 0.0312 | -0.0506 | 1.55 | 0.542 | 0.753 | 0.572 | 0.964 | 0.858 | 0.744 | ||
| CLM4_CRUNCEPv7 | [-] | 4.16 | 3.91 | 0.202 | 5.26 | 0.0312 | -0.374 | 1.87 | 0.438 | 0.675 | 0.518 | 0.971 | 0.944 | 0.725 | ||
| CLM4_GSWP3v1 | [-] | 3.61 | 3.42 | 0.159 | 5.26 | 0.0312 | -0.676 | 1.97 | 0.418 | 0.636 | 0.497 | 0.973 | 0.939 | 0.708 | ||
| CLM5_CRUNCEPv7 | [-] | 6.19 | 5.83 | 0.272 | 5.26 | 0.0312 | 0.738 | 2.21 | 0.322 | 0.729 | 0.499 | 0.980 | 0.903 | 0.722 | ||
| CLM5_GSWP3v1 | [-] | 5.13 | 4.83 | 0.225 | 5.26 | 0.0312 | 0.164 | 1.80 | 0.315 | 0.712 | 0.576 | 0.981 | 0.799 | 0.729 |
Download Data |
Period Mean (original grids) [Pg yr-1] |
Model Period Mean (intersection) [Pg yr-1] |
Model Period Mean (complement) [Pg yr-1] |
Benchmark Period Mean (intersection) [Pg yr-1] |
Benchmark Period Mean (complement) [Pg yr-1] |
Bias [g m-2 d-1] |
RMSE [g m-2 d-1] |
Phase Shift [months] |
Bias Score [1] |
RMSE Score [1] |
Seasonal Cycle Score [1] |
Spatial Distribution Score [1] |
Overall Score [1] |
|||
|---|---|---|---|---|---|---|---|---|---|---|---|---|---|---|---|---|
| Benchmark | [-] | 119. | ||||||||||||||
| CLM4.5_CRUNCEPv7 | [-] | 122. | 116. | 5.96 | 118. | 0.802 | 0.177 | 1.54 | 1.23 | 0.431 | 0.392 | 0.794 | 0.926 | 0.587 | ||
| CLM4.5_GSWP3v1 | [-] | 110. | 105. | 5.36 | 118. | 0.802 | -0.0894 | 1.47 | 1.33 | 0.438 | 0.388 | 0.767 | 0.947 | 0.585 | ||
| CLM4_CRUNCEPv7 | [-] | 141. | 135. | 5.82 | 118. | 0.802 | 0.594 | 1.86 | 1.27 | 0.359 | 0.349 | 0.787 | 0.782 | 0.525 | ||
| CLM4_GSWP3v1 | [-] | 127. | 122. | 4.95 | 118. | 0.802 | 0.264 | 1.62 | 1.32 | 0.393 | 0.361 | 0.770 | 0.871 | 0.551 | ||
| CLM5_CRUNCEPv7 | [-] | 128. | 122. | 5.76 | 118. | 0.802 | 0.298 | 1.74 | 1.22 | 0.457 | 0.366 | 0.815 | 0.953 | 0.591 | ||
| CLM5_GSWP3v1 | [-] | 115. | 110. | 5.38 | 118. | 0.802 | 0.0236 | 1.62 | 1.33 | 0.434 | 0.384 | 0.786 | 0.933 | 0.584 |
Download Data |
Period Mean (original grids) [Pg yr-1] |
Model Period Mean (intersection) [Pg yr-1] |
Model Period Mean (complement) [Pg yr-1] |
Benchmark Period Mean (intersection) [Pg yr-1] |
Benchmark Period Mean (complement) [Pg yr-1] |
Bias [g m-2 d-1] |
RMSE [g m-2 d-1] |
Phase Shift [months] |
Bias Score [1] |
RMSE Score [1] |
Seasonal Cycle Score [1] |
Spatial Distribution Score [1] |
Overall Score [1] |
|||
|---|---|---|---|---|---|---|---|---|---|---|---|---|---|---|---|---|
| Benchmark | [-] | 0.864 | ||||||||||||||
| CLM4.5_CRUNCEPv7 | [-] | 1.06 | 1.02 | 0.0519 | 0.859 | 0.00579 | 0.0935 | 0.402 | 2.25 | 0.478 | 0.351 | 0.843 | 0.874 | 0.579 | ||
| CLM4.5_GSWP3v1 | [-] | 0.992 | 0.950 | 0.0511 | 0.859 | 0.00579 | 0.0749 | 0.369 | 2.24 | 0.479 | 0.366 | 0.846 | 0.881 | 0.588 | ||
| CLM4_CRUNCEPv7 | [-] | 0.937 | 0.893 | 0.0411 | 0.859 | 0.00579 | 0.0433 | 0.326 | 2.24 | 0.487 | 0.385 | 0.850 | 0.889 | 0.599 | ||
| CLM4_GSWP3v1 | [-] | 0.980 | 0.944 | 0.0426 | 0.859 | 0.00579 | 0.0603 | 0.328 | 2.18 | 0.492 | 0.390 | 0.844 | 0.892 | 0.602 | ||
| CLM5_CRUNCEPv7 | [-] | 1.65 | 1.59 | 0.0769 | 0.859 | 0.00579 | 0.294 | 0.742 | 2.32 | 0.431 | 0.204 | 0.860 | 0.843 | 0.508 | ||
| CLM5_GSWP3v1 | [-] | 1.54 | 1.49 | 0.0758 | 0.859 | 0.00579 | 0.268 | 0.681 | 2.31 | 0.453 | 0.244 | 0.866 | 0.853 | 0.532 |
Download Data |
Period Mean (original grids) [Pg yr-1] |
Model Period Mean (intersection) [Pg yr-1] |
Model Period Mean (complement) [Pg yr-1] |
Benchmark Period Mean (intersection) [Pg yr-1] |
Benchmark Period Mean (complement) [Pg yr-1] |
Bias [g m-2 d-1] |
RMSE [g m-2 d-1] |
Phase Shift [months] |
Bias Score [1] |
RMSE Score [1] |
Seasonal Cycle Score [1] |
Spatial Distribution Score [1] |
Overall Score [1] |
|||
|---|---|---|---|---|---|---|---|---|---|---|---|---|---|---|---|---|
| Benchmark | [-] | 1.56 | ||||||||||||||
| CLM4.5_CRUNCEPv7 | [-] | 2.48 | 2.39 | 0.0631 | 1.55 | 0.00323 | 0.418 | 1.15 | 0.945 | 0.559 | 0.388 | 0.962 | 0.678 | 0.595 | ||
| CLM4.5_GSWP3v1 | [-] | 2.32 | 2.23 | 0.0588 | 1.55 | 0.00323 | 0.347 | 0.992 | 1.06 | 0.585 | 0.437 | 0.950 | 0.696 | 0.621 | ||
| CLM4_CRUNCEPv7 | [-] | 1.40 | 1.34 | 0.0367 | 1.55 | 0.00323 | -0.0444 | 0.820 | 1.30 | 0.608 | 0.496 | 0.943 | 0.765 | 0.661 | ||
| CLM4_GSWP3v1 | [-] | 1.14 | 1.11 | 0.0264 | 1.55 | 0.00323 | -0.157 | 0.678 | 1.42 | 0.659 | 0.533 | 0.927 | 0.871 | 0.705 | ||
| CLM5_CRUNCEPv7 | [-] | 3.09 | 2.97 | 0.0897 | 1.55 | 0.00323 | 0.684 | 1.79 | 0.557 | 0.446 | 0.261 | 0.971 | 0.513 | 0.491 | ||
| CLM5_GSWP3v1 | [-] | 2.94 | 2.84 | 0.0836 | 1.55 | 0.00323 | 0.616 | 1.53 | 0.589 | 0.484 | 0.313 | 0.973 | 0.553 | 0.527 |
Download Data |
Period Mean (original grids) [Pg yr-1] |
Model Period Mean (intersection) [Pg yr-1] |
Model Period Mean (complement) [Pg yr-1] |
Benchmark Period Mean (intersection) [Pg yr-1] |
Benchmark Period Mean (complement) [Pg yr-1] |
Bias [g m-2 d-1] |
RMSE [g m-2 d-1] |
Phase Shift [months] |
Bias Score [1] |
RMSE Score [1] |
Seasonal Cycle Score [1] |
Spatial Distribution Score [1] |
Overall Score [1] |
|||
|---|---|---|---|---|---|---|---|---|---|---|---|---|---|---|---|---|
| Benchmark | [-] | 3.62 | ||||||||||||||
| CLM4.5_CRUNCEPv7 | [-] | 3.58 | 3.04 | 0.453 | 3.60 | 0.0267 | 0.381 | 2.33 | 1.21 | 0.323 | 0.254 | 0.822 | 0.850 | 0.501 | ||
| CLM4.5_GSWP3v1 | [-] | 3.03 | 2.56 | 0.388 | 3.60 | 0.0267 | -0.243 | 2.11 | 1.47 | 0.306 | 0.286 | 0.779 | 0.916 | 0.515 | ||
| CLM4_CRUNCEPv7 | [-] | 2.68 | 2.30 | 0.311 | 3.60 | 0.0267 | -0.607 | 2.18 | 1.12 | 0.238 | 0.343 | 0.851 | 0.887 | 0.533 | ||
| CLM4_GSWP3v1 | [-] | 2.45 | 2.12 | 0.260 | 3.60 | 0.0267 | -0.890 | 2.10 | 1.28 | 0.229 | 0.344 | 0.825 | 0.908 | 0.530 | ||
| CLM5_CRUNCEPv7 | [-] | 3.45 | 2.94 | 0.436 | 3.60 | 0.0267 | 0.219 | 1.97 | 1.46 | 0.401 | 0.323 | 0.789 | 0.926 | 0.552 | ||
| CLM5_GSWP3v1 | [-] | 3.29 | 2.78 | 0.428 | 3.60 | 0.0267 | 0.0289 | 1.89 | 1.52 | 0.370 | 0.344 | 0.772 | 0.944 | 0.555 |
Download Data |
Period Mean (original grids) [Pg yr-1] |
Model Period Mean (intersection) [Pg yr-1] |
Model Period Mean (complement) [Pg yr-1] |
Benchmark Period Mean (intersection) [Pg yr-1] |
Benchmark Period Mean (complement) [Pg yr-1] |
Bias [g m-2 d-1] |
RMSE [g m-2 d-1] |
Phase Shift [months] |
Bias Score [1] |
RMSE Score [1] |
Seasonal Cycle Score [1] |
Spatial Distribution Score [1] |
Overall Score [1] |
|||
|---|---|---|---|---|---|---|---|---|---|---|---|---|---|---|---|---|
| Benchmark | [-] | 5.09 | ||||||||||||||
| CLM4.5_CRUNCEPv7 | [-] | 6.09 | 5.82 | 0.192 | 5.09 | 0.00487 | 0.728 | 2.17 | 0.800 | 0.699 | 0.532 | 0.935 | 0.788 | 0.697 | ||
| CLM4.5_GSWP3v1 | [-] | 5.48 | 5.23 | 0.176 | 5.09 | 0.00487 | 0.305 | 1.96 | 0.710 | 0.744 | 0.560 | 0.945 | 0.897 | 0.741 | ||
| CLM4_CRUNCEPv7 | [-] | 6.72 | 6.43 | 0.203 | 5.09 | 0.00487 | 1.16 | 2.60 | 0.769 | 0.606 | 0.513 | 0.941 | 0.597 | 0.634 | ||
| CLM4_GSWP3v1 | [-] | 6.42 | 6.16 | 0.183 | 5.09 | 0.00487 | 0.940 | 2.29 | 0.676 | 0.641 | 0.546 | 0.949 | 0.741 | 0.685 | ||
| CLM5_CRUNCEPv7 | [-] | 5.46 | 5.20 | 0.159 | 5.09 | 0.00487 | 0.264 | 1.84 | 0.759 | 0.811 | 0.582 | 0.939 | 0.981 | 0.779 | ||
| CLM5_GSWP3v1 | [-] | 4.79 | 4.55 | 0.143 | 5.09 | 0.00487 | -0.209 | 1.80 | 0.672 | 0.733 | 0.617 | 0.942 | 0.930 | 0.768 |
Download Data |
Period Mean (original grids) [Pg yr-1] |
Model Period Mean (intersection) [Pg yr-1] |
Model Period Mean (complement) [Pg yr-1] |
Benchmark Period Mean (intersection) [Pg yr-1] |
Benchmark Period Mean (complement) [Pg yr-1] |
Bias [g m-2 d-1] |
RMSE [g m-2 d-1] |
Phase Shift [months] |
Bias Score [1] |
RMSE Score [1] |
Seasonal Cycle Score [1] |
Spatial Distribution Score [1] |
Overall Score [1] |
|||
|---|---|---|---|---|---|---|---|---|---|---|---|---|---|---|---|---|
| Benchmark | [-] | 3.36 | ||||||||||||||
| CLM4.5_CRUNCEPv7 | [-] | 5.18 | 5.15 | 0.0732 | 3.34 | 0.0222 | 1.06 | 1.84 | 0.614 | 0.579 | 0.515 | 0.962 | 0.851 | 0.684 | ||
| CLM4.5_GSWP3v1 | [-] | 4.82 | 4.78 | 0.0708 | 3.34 | 0.0222 | 0.861 | 1.56 | 0.703 | 0.630 | 0.564 | 0.955 | 0.884 | 0.719 | ||
| CLM4_CRUNCEPv7 | [-] | 5.08 | 5.03 | 0.0803 | 3.34 | 0.0222 | 0.998 | 1.74 | 0.624 | 0.580 | 0.549 | 0.960 | 0.700 | 0.668 | ||
| CLM4_GSWP3v1 | [-] | 4.21 | 4.16 | 0.0680 | 3.34 | 0.0222 | 0.516 | 1.40 | 0.673 | 0.663 | 0.582 | 0.957 | 0.844 | 0.725 | ||
| CLM5_CRUNCEPv7 | [-] | 5.98 | 5.92 | 0.0889 | 3.34 | 0.0222 | 1.49 | 2.44 | 0.636 | 0.497 | 0.431 | 0.958 | 0.891 | 0.642 | ||
| CLM5_GSWP3v1 | [-] | 5.10 | 5.05 | 0.0739 | 3.34 | 0.0222 | 1.01 | 1.85 | 0.553 | 0.604 | 0.523 | 0.964 | 0.914 | 0.705 |
Download Data |
Period Mean (original grids) [Pg yr-1] |
Model Period Mean (intersection) [Pg yr-1] |
Model Period Mean (complement) [Pg yr-1] |
Benchmark Period Mean (intersection) [Pg yr-1] |
Benchmark Period Mean (complement) [Pg yr-1] |
Bias [g m-2 d-1] |
RMSE [g m-2 d-1] |
Phase Shift [months] |
Bias Score [1] |
RMSE Score [1] |
Seasonal Cycle Score [1] |
Spatial Distribution Score [1] |
Overall Score [1] |
|||
|---|---|---|---|---|---|---|---|---|---|---|---|---|---|---|---|---|
| Benchmark | [-] | 1.79 | ||||||||||||||
| CLM4.5_CRUNCEPv7 | [-] | 1.43 | 1.48 | 0.0157 | 1.79 | 0.00506 | -0.163 | 0.845 | 0.902 | 0.638 | 0.501 | 0.917 | 0.919 | 0.695 | ||
| CLM4.5_GSWP3v1 | [-] | 1.42 | 1.48 | 0.0146 | 1.79 | 0.00506 | -0.161 | 0.854 | 0.946 | 0.637 | 0.492 | 0.907 | 0.908 | 0.687 | ||
| CLM4_CRUNCEPv7 | [-] | 1.75 | 1.80 | 0.0156 | 1.79 | 0.00506 | 0.0632 | 0.821 | 0.867 | 0.632 | 0.527 | 0.926 | 0.933 | 0.709 | ||
| CLM4_GSWP3v1 | [-] | 1.66 | 1.72 | 0.0113 | 1.79 | 0.00506 | 0.00693 | 0.828 | 0.847 | 0.633 | 0.508 | 0.929 | 0.947 | 0.705 | ||
| CLM5_CRUNCEPv7 | [-] | 1.58 | 1.65 | 0.0176 | 1.79 | 0.00506 | -0.0385 | 1.17 | 0.879 | 0.566 | 0.416 | 0.930 | 0.923 | 0.650 | ||
| CLM5_GSWP3v1 | [-] | 1.65 | 1.74 | 0.0131 | 1.79 | 0.00506 | 0.0233 | 1.21 | 0.943 | 0.544 | 0.415 | 0.921 | 0.920 | 0.643 |
Download Data |
Period Mean (original grids) [Pg yr-1] |
Model Period Mean (intersection) [Pg yr-1] |
Model Period Mean (complement) [Pg yr-1] |
Benchmark Period Mean (intersection) [Pg yr-1] |
Benchmark Period Mean (complement) [Pg yr-1] |
Bias [g m-2 d-1] |
RMSE [g m-2 d-1] |
Phase Shift [months] |
Bias Score [1] |
RMSE Score [1] |
Seasonal Cycle Score [1] |
Spatial Distribution Score [1] |
Overall Score [1] |
|||
|---|---|---|---|---|---|---|---|---|---|---|---|---|---|---|---|---|
| Benchmark | [-] | 23.2 | ||||||||||||||
| CLM4.5_CRUNCEPv7 | [-] | 25.1 | 24.8 | 0.195 | 23.2 | 0.0226 | 0.787 | 2.08 | 2.63 | 0.275 | 0.215 | 0.571 | 0.906 | 0.436 | ||
| CLM4.5_GSWP3v1 | [-] | 21.0 | 20.8 | 0.176 | 23.2 | 0.0226 | -0.554 | 2.06 | 2.91 | 0.247 | 0.172 | 0.518 | 0.884 | 0.399 | ||
| CLM4_CRUNCEPv7 | [-] | 33.3 | 33.0 | 0.186 | 23.2 | 0.0226 | 3.41 | 4.33 | 2.90 | 0.0623 | 0.109 | 0.511 | 0.608 | 0.280 | ||
| CLM4_GSWP3v1 | [-] | 27.2 | 26.9 | 0.153 | 23.2 | 0.0226 | 1.40 | 2.98 | 3.16 | 0.126 | 0.118 | 0.458 | 0.700 | 0.304 | ||
| CLM5_CRUNCEPv7 | [-] | 22.0 | 21.7 | 0.174 | 23.2 | 0.0226 | -0.268 | 1.83 | 2.24 | 0.176 | 0.265 | 0.653 | 0.902 | 0.452 | ||
| CLM5_GSWP3v1 | [-] | 19.4 | 19.1 | 0.167 | 23.2 | 0.0226 | -1.14 | 2.18 | 2.45 | 0.110 | 0.228 | 0.620 | 0.911 | 0.420 |
Download Data |
Period Mean (original grids) [Pg yr-1] |
Model Period Mean (intersection) [Pg yr-1] |
Model Period Mean (complement) [Pg yr-1] |
Benchmark Period Mean (intersection) [Pg yr-1] |
Benchmark Period Mean (complement) [Pg yr-1] |
Bias [g m-2 d-1] |
RMSE [g m-2 d-1] |
Phase Shift [months] |
Bias Score [1] |
RMSE Score [1] |
Seasonal Cycle Score [1] |
Spatial Distribution Score [1] |
Overall Score [1] |
|||
|---|---|---|---|---|---|---|---|---|---|---|---|---|---|---|---|---|
| Benchmark | [-] | 10.4 | ||||||||||||||
| CLM4.5_CRUNCEPv7 | [-] | 8.80 | 8.54 | 0.354 | 10.4 | 0.00314 | -0.662 | 2.34 | 1.14 | 0.424 | 0.431 | 0.861 | 0.716 | 0.573 | ||
| CLM4.5_GSWP3v1 | [-] | 7.81 | 7.57 | 0.310 | 10.4 | 0.00314 | -1.09 | 2.44 | 1.42 | 0.386 | 0.436 | 0.818 | 0.774 | 0.570 | ||
| CLM4_CRUNCEPv7 | [-] | 11.4 | 11.3 | 0.300 | 10.4 | 0.00314 | 0.482 | 2.85 | 0.984 | 0.346 | 0.404 | 0.885 | 0.491 | 0.506 | ||
| CLM4_GSWP3v1 | [-] | 10.4 | 10.2 | 0.261 | 10.4 | 0.00314 | 0.0177 | 2.65 | 1.20 | 0.382 | 0.425 | 0.852 | 0.572 | 0.531 | ||
| CLM5_CRUNCEPv7 | [-] | 10.8 | 10.7 | 0.343 | 10.4 | 0.00314 | 0.227 | 2.30 | 1.00 | 0.489 | 0.411 | 0.906 | 0.787 | 0.601 | ||
| CLM5_GSWP3v1 | [-] | 10.2 | 10.0 | 0.321 | 10.4 | 0.00314 | -0.0344 | 1.98 | 1.01 | 0.545 | 0.451 | 0.906 | 0.872 | 0.645 |
Download Data |
Period Mean (original grids) [Pg yr-1] |
Model Period Mean (intersection) [Pg yr-1] |
Model Period Mean (complement) [Pg yr-1] |
Benchmark Period Mean (intersection) [Pg yr-1] |
Benchmark Period Mean (complement) [Pg yr-1] |
Bias [g m-2 d-1] |
RMSE [g m-2 d-1] |
Phase Shift [months] |
Bias Score [1] |
RMSE Score [1] |
Seasonal Cycle Score [1] |
Spatial Distribution Score [1] |
Overall Score [1] |
|||
|---|---|---|---|---|---|---|---|---|---|---|---|---|---|---|---|---|
| Benchmark | [-] | 1.16 | ||||||||||||||
| CLM4.5_CRUNCEPv7 | [-] | 1.02 | 0.966 | 0.0415 | 1.14 | 0.0148 | 0.0209 | 0.827 | 1.50 | 0.399 | 0.403 | 0.887 | 0.911 | 0.601 | ||
| CLM4.5_GSWP3v1 | [-] | 1.19 | 1.13 | 0.0479 | 1.14 | 0.0148 | 0.171 | 0.883 | 1.51 | 0.397 | 0.414 | 0.871 | 0.906 | 0.600 | ||
| CLM4_CRUNCEPv7 | [-] | 0.991 | 0.965 | 0.0382 | 1.14 | 0.0148 | 0.0394 | 0.815 | 1.25 | 0.386 | 0.385 | 0.897 | 0.871 | 0.585 | ||
| CLM4_GSWP3v1 | [-] | 1.25 | 1.21 | 0.0402 | 1.14 | 0.0148 | 0.251 | 0.868 | 1.33 | 0.396 | 0.403 | 0.886 | 0.854 | 0.588 | ||
| CLM5_CRUNCEPv7 | [-] | 1.36 | 1.25 | 0.0673 | 1.14 | 0.0148 | 0.343 | 1.19 | 1.36 | 0.400 | 0.310 | 0.911 | 0.899 | 0.566 | ||
| CLM5_GSWP3v1 | [-] | 1.60 | 1.48 | 0.0727 | 1.14 | 0.0148 | 0.524 | 1.24 | 1.44 | 0.406 | 0.373 | 0.888 | 0.905 | 0.589 |
Temporally integrated period mean