Mean State
Download Data |
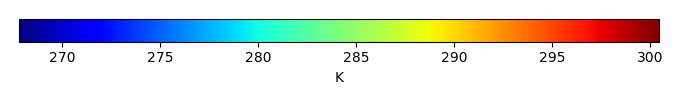
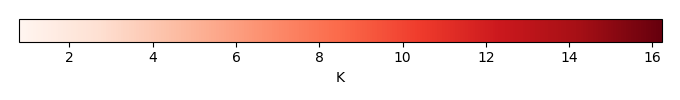
Period Mean (original grids) [K] |
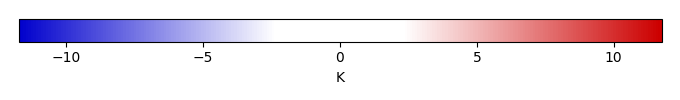
Bias [K] |
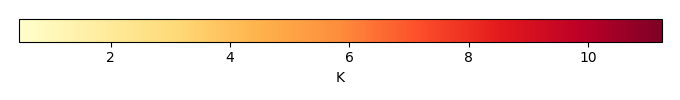
RMSE [K] |
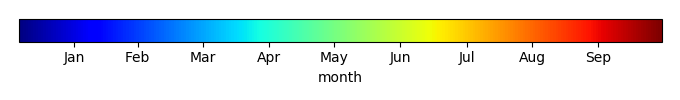
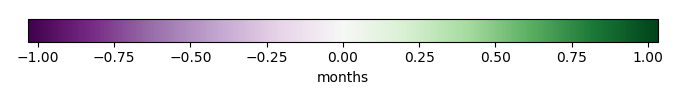
Phase Shift [months] |
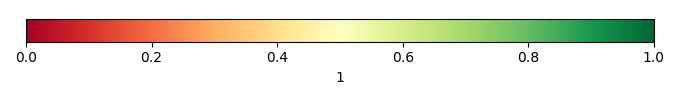
Bias Score [1] |
RMSE Score [1] |
Seasonal Cycle Score [1] |
Interannual Variability Score [1] |
Overall Score [1] |
|||
|---|---|---|---|---|---|---|---|---|---|---|---|---|
| Benchmark | [-] | 295. | ||||||||||
| CLM4.5_CRUNCEPv7 | [-] | 296. | 0.982 | 1.67 | 1.00 | 0.775 | 0.674 | 0.935 | 0.856 | 0.783 | ||
| CLM4.5_GSWP3v1 | [-] | 296. | 0.586 | 1.60 | 0.508 | 0.814 | 0.662 | 0.966 | 0.819 | 0.785 | ||
| CLM4_CRUNCEPv7 | [-] | 296. | 0.980 | 1.65 | 0.508 | 0.774 | 0.673 | 0.966 | 0.852 | 0.788 | ||
| CLM4_GSWP3v1 | [-] | 296. | 0.578 | 1.62 | 0.508 | 0.820 | 0.656 | 0.966 | 0.813 | 0.782 | ||
| CLM5_CRUNCEPv7 | [-] | 297. | 1.12 | 1.70 | 0.508 | 0.739 | 0.678 | 0.966 | 0.866 | 0.785 | ||
| CLM5_GSWP3v1 | [-] | 296. | 0.822 | 1.61 | 0.508 | 0.807 | 0.671 | 0.966 | 0.839 | 0.791 |
Download Data |
Period Mean (original grids) [K] |
Bias [K] |
RMSE [K] |
Phase Shift [months] |
Bias Score [1] |
RMSE Score [1] |
Seasonal Cycle Score [1] |
Interannual Variability Score [1] |
Overall Score [1] |
|||
|---|---|---|---|---|---|---|---|---|---|---|---|---|
| Benchmark | [-] | 275. | ||||||||||
| CLM4.5_CRUNCEPv7 | [-] | 257. | -17.8 | 15.7 | 0.00 | 0.0949 | 0.150 | 1.00 | 0.215 | 0.322 | ||
| CLM4.5_GSWP3v1 | [-] | 259. | -15.3 | 13.7 | 0.00 | 0.132 | 0.181 | 1.00 | 0.271 | 0.353 | ||
| CLM4_CRUNCEPv7 | [-] | 256. | -18.5 | 16.4 | 0.00 | 0.0872 | 0.145 | 1.00 | 0.212 | 0.318 | ||
| CLM4_GSWP3v1 | [-] | 259. | -15.5 | 14.1 | 0.00 | 0.129 | 0.176 | 1.00 | 0.266 | 0.349 | ||
| CLM5_CRUNCEPv7 | [-] | 259. | -16.2 | 14.4 | 0.00 | 0.118 | 0.169 | 1.00 | 0.249 | 0.341 | ||
| CLM5_GSWP3v1 | [-] | 260. | -15.0 | 13.4 | 0.00 | 0.138 | 0.185 | 1.00 | 0.274 | 0.356 |
Download Data |
Period Mean (original grids) [K] |
Bias [K] |
RMSE [K] |
Phase Shift [months] |
Bias Score [1] |
RMSE Score [1] |
Seasonal Cycle Score [1] |
Interannual Variability Score [1] |
Overall Score [1] |
|||
|---|---|---|---|---|---|---|---|---|---|---|---|---|
| Benchmark | [-] | 300. | ||||||||||
| CLM4.5_CRUNCEPv7 | [-] | 298. | -1.91 | 1.95 | 0.00 | 0.00874 | 0.325 | 1.00 | 0.938 | 0.520 | ||
| CLM4.5_GSWP3v1 | [-] | 298. | -1.58 | 1.62 | 0.00 | 0.0195 | 0.336 | 1.00 | 0.963 | 0.531 | ||
| CLM4_CRUNCEPv7 | [-] | 298. | -2.07 | 2.11 | 0.00 | 0.00581 | 0.327 | 1.00 | 0.969 | 0.526 | ||
| CLM4_GSWP3v1 | [-] | 298. | -1.89 | 1.91 | 0.00 | 0.00902 | 0.339 | 1.00 | 0.983 | 0.534 | ||
| CLM5_CRUNCEPv7 | [-] | 298. | -1.57 | 1.62 | 0.00 | 0.0202 | 0.321 | 1.00 | 0.987 | 0.530 | ||
| CLM5_GSWP3v1 | [-] | 298. | -1.26 | 1.32 | 0.00 | 0.0435 | 0.321 | 1.00 | 0.924 | 0.522 |
Download Data |
Period Mean (original grids) [K] |
Bias [K] |
RMSE [K] |
Phase Shift [months] |
Bias Score [1] |
RMSE Score [1] |
Seasonal Cycle Score [1] |
Interannual Variability Score [1] |
Overall Score [1] |
|||
|---|---|---|---|---|---|---|---|---|---|---|---|---|
| Benchmark | [-] | 277. | ||||||||||
| CLM4.5_CRUNCEPv7 | [-] | 270. | -6.71 | 7.29 | 0.508 | 0.585 | 0.629 | 0.966 | 0.790 | 0.720 | ||
| CLM4.5_GSWP3v1 | [-] | 272. | -5.05 | 6.10 | 0.508 | 0.667 | 0.645 | 0.966 | 0.845 | 0.754 | ||
| CLM4_CRUNCEPv7 | [-] | 270. | -6.76 | 7.34 | 0.508 | 0.583 | 0.628 | 0.966 | 0.786 | 0.718 | ||
| CLM4_GSWP3v1 | [-] | 272. | -5.03 | 6.05 | 0.508 | 0.669 | 0.647 | 0.966 | 0.847 | 0.755 | ||
| CLM5_CRUNCEPv7 | [-] | 272. | -4.93 | 5.99 | 0.508 | 0.674 | 0.647 | 0.966 | 0.852 | 0.757 | ||
| CLM5_GSWP3v1 | [-] | 272. | -4.21 | 5.58 | 0.508 | 0.713 | 0.653 | 0.966 | 0.874 | 0.772 |
Download Data |
Period Mean (original grids) [K] |
Bias [K] |
RMSE [K] |
Phase Shift [months] |
Bias Score [1] |
RMSE Score [1] |
Seasonal Cycle Score [1] |
Interannual Variability Score [1] |
Overall Score [1] |
|||
|---|---|---|---|---|---|---|---|---|---|---|---|---|
| Benchmark | [-] | 291. | ||||||||||
| CLM4.5_CRUNCEPv7 | [-] | 292. | 1.28 | 2.02 | 0.00 | 0.670 | 0.684 | 1.00 | 0.970 | 0.801 | ||
| CLM4.5_GSWP3v1 | [-] | 293. | 2.03 | 2.63 | 0.00 | 0.570 | 0.682 | 1.00 | 0.972 | 0.781 | ||
| CLM4_CRUNCEPv7 | [-] | 292. | 1.24 | 2.02 | 0.508 | 0.657 | 0.688 | 0.966 | 0.980 | 0.796 | ||
| CLM4_GSWP3v1 | [-] | 293. | 2.01 | 2.61 | 0.00 | 0.559 | 0.685 | 1.00 | 0.988 | 0.783 | ||
| CLM5_CRUNCEPv7 | [-] | 293. | 1.88 | 2.52 | 0.00 | 0.594 | 0.686 | 1.00 | 0.976 | 0.788 | ||
| CLM5_GSWP3v1 | [-] | 293. | 2.26 | 2.83 | 0.00 | 0.536 | 0.689 | 1.00 | 0.982 | 0.779 |
Download Data |
Period Mean (original grids) [K] |
Bias [K] |
RMSE [K] |
Phase Shift [months] |
Bias Score [1] |
RMSE Score [1] |
Seasonal Cycle Score [1] |
Interannual Variability Score [1] |
Overall Score [1] |
|||
|---|---|---|---|---|---|---|---|---|---|---|---|---|
| Benchmark | [-] | 283. | ||||||||||
| CLM4.5_CRUNCEPv7 | [-] | 282. | -0.558 | 2.31 | 0.297 | 0.810 | 0.788 | 0.976 | 0.888 | 0.850 | ||
| CLM4.5_GSWP3v1 | [-] | 283. | -0.139 | 2.16 | 0.317 | 0.820 | 0.798 | 0.972 | 0.909 | 0.859 | ||
| CLM4_CRUNCEPv7 | [-] | 282. | -0.464 | 2.34 | 0.297 | 0.808 | 0.786 | 0.973 | 0.885 | 0.848 | ||
| CLM4_GSWP3v1 | [-] | 283. | -0.0582 | 2.19 | 0.277 | 0.817 | 0.795 | 0.975 | 0.906 | 0.858 | ||
| CLM5_CRUNCEPv7 | [-] | 283. | 0.236 | 2.11 | 0.277 | 0.822 | 0.812 | 0.975 | 0.919 | 0.868 | ||
| CLM5_GSWP3v1 | [-] | 283. | 0.424 | 2.09 | 0.277 | 0.825 | 0.814 | 0.975 | 0.926 | 0.871 |
Download Data |
Period Mean (original grids) [K] |
Bias [K] |
RMSE [K] |
Phase Shift [months] |
Bias Score [1] |
RMSE Score [1] |
Seasonal Cycle Score [1] |
Interannual Variability Score [1] |
Overall Score [1] |
|||
|---|---|---|---|---|---|---|---|---|---|---|---|---|
| Benchmark | [-] | 283. | ||||||||||
| CLM4.5_CRUNCEPv7 | [-] | 281. | -1.41 | 2.82 | 0.207 | 0.778 | 0.770 | 0.984 | 0.888 | 0.838 | ||
| CLM4.5_GSWP3v1 | [-] | 282. | -0.692 | 2.40 | 0.208 | 0.815 | 0.783 | 0.983 | 0.919 | 0.857 | ||
| CLM4_CRUNCEPv7 | [-] | 281. | -1.40 | 2.87 | 0.208 | 0.775 | 0.769 | 0.983 | 0.886 | 0.836 | ||
| CLM4_GSWP3v1 | [-] | 282. | -0.656 | 2.41 | 0.188 | 0.814 | 0.782 | 0.984 | 0.919 | 0.856 | ||
| CLM5_CRUNCEPv7 | [-] | 282. | -0.497 | 2.42 | 0.188 | 0.809 | 0.790 | 0.984 | 0.922 | 0.859 | ||
| CLM5_GSWP3v1 | [-] | 282. | -0.178 | 2.31 | 0.198 | 0.822 | 0.794 | 0.983 | 0.930 | 0.865 |
Download Data |
Period Mean (original grids) [K] |
Bias [K] |
RMSE [K] |
Phase Shift [months] |
Bias Score [1] |
RMSE Score [1] |
Seasonal Cycle Score [1] |
Interannual Variability Score [1] |
Overall Score [1] |
|||
|---|---|---|---|---|---|---|---|---|---|---|---|---|
| Benchmark | [-] | 292. | ||||||||||
| CLM4.5_CRUNCEPv7 | [-] | 294. | 2.00 | 2.73 | 0.00 | 0.699 | 0.783 | 1.00 | 0.902 | 0.833 | ||
| CLM4.5_GSWP3v1 | [-] | 293. | 1.46 | 2.19 | 0.00 | 0.769 | 0.798 | 1.00 | 0.950 | 0.863 | ||
| CLM4_CRUNCEPv7 | [-] | 294. | 2.07 | 2.78 | 0.00 | 0.690 | 0.792 | 1.00 | 0.919 | 0.839 | ||
| CLM4_GSWP3v1 | [-] | 293. | 1.52 | 2.20 | 0.00 | 0.762 | 0.805 | 1.00 | 0.967 | 0.868 | ||
| CLM5_CRUNCEPv7 | [-] | 294. | 2.23 | 2.90 | 0.00 | 0.671 | 0.799 | 1.00 | 0.947 | 0.843 | ||
| CLM5_GSWP3v1 | [-] | 294. | 1.82 | 2.46 | 1.03 | 0.722 | 0.808 | 0.930 | 0.985 | 0.851 |
Download Data |
Period Mean (original grids) [K] |
Bias [K] |
RMSE [K] |
Phase Shift [months] |
Bias Score [1] |
RMSE Score [1] |
Seasonal Cycle Score [1] |
Interannual Variability Score [1] |
Overall Score [1] |
|||
|---|---|---|---|---|---|---|---|---|---|---|---|---|
| Benchmark | [-] | 284. | ||||||||||
| CLM4.5_CRUNCEPv7 | [-] | 283. | -1.43 | 2.37 | 0.0984 | 0.842 | 0.804 | 0.993 | 0.905 | 0.870 | ||
| CLM4.5_GSWP3v1 | [-] | 284. | -0.606 | 1.91 | 0.0984 | 0.904 | 0.824 | 0.993 | 0.943 | 0.898 | ||
| CLM4_CRUNCEPv7 | [-] | 283. | -1.49 | 2.42 | 0.0984 | 0.833 | 0.808 | 0.993 | 0.907 | 0.870 | ||
| CLM4_GSWP3v1 | [-] | 284. | -0.621 | 1.90 | 0.0984 | 0.902 | 0.826 | 0.993 | 0.948 | 0.899 | ||
| CLM5_CRUNCEPv7 | [-] | 284. | -0.523 | 1.96 | 0.0984 | 0.901 | 0.821 | 0.993 | 0.934 | 0.894 | ||
| CLM5_GSWP3v1 | [-] | 284. | -0.173 | 1.88 | 0.0984 | 0.910 | 0.827 | 0.993 | 0.945 | 0.901 |
Download Data |
Period Mean (original grids) [K] |
Bias [K] |
RMSE [K] |
Phase Shift [months] |
Bias Score [1] |
RMSE Score [1] |
Seasonal Cycle Score [1] |
Interannual Variability Score [1] |
Overall Score [1] |
|||
|---|---|---|---|---|---|---|---|---|---|---|---|---|
| Benchmark | [-] | 274. | ||||||||||
| CLM4.5_CRUNCEPv7 | [-] | 270. | -4.23 | 4.42 | 0.00 | 0.732 | 0.818 | 1.00 | 0.915 | 0.857 | ||
| CLM4.5_GSWP3v1 | [-] | 272. | -2.39 | 2.95 | 0.00 | 0.842 | 0.840 | 1.00 | 0.979 | 0.900 | ||
| CLM4_CRUNCEPv7 | [-] | 270. | -4.33 | 4.57 | 0.00 | 0.726 | 0.812 | 1.00 | 0.905 | 0.851 | ||
| CLM4_GSWP3v1 | [-] | 272. | -2.33 | 2.95 | 0.00 | 0.846 | 0.837 | 1.00 | 0.970 | 0.898 | ||
| CLM5_CRUNCEPv7 | [-] | 272. | -2.53 | 3.04 | 0.00 | 0.834 | 0.837 | 1.00 | 0.965 | 0.895 | ||
| CLM5_GSWP3v1 | [-] | 273. | -1.72 | 2.63 | 0.00 | 0.886 | 0.842 | 1.00 | 0.981 | 0.910 |
Download Data |
Period Mean (original grids) [K] |
Bias [K] |
RMSE [K] |
Phase Shift [months] |
Bias Score [1] |
RMSE Score [1] |
Seasonal Cycle Score [1] |
Interannual Variability Score [1] |
Overall Score [1] |
|||
|---|---|---|---|---|---|---|---|---|---|---|---|---|
| Benchmark | [-] | 286. | ||||||||||
| CLM4.5_CRUNCEPv7 | [-] | 286. | -0.0244 | 2.54 | 0.169 | 0.864 | 0.742 | 0.989 | 0.908 | 0.849 | ||
| CLM4.5_GSWP3v1 | [-] | 286. | 0.472 | 2.35 | 0.169 | 0.864 | 0.759 | 0.989 | 0.944 | 0.863 | ||
| CLM4_CRUNCEPv7 | [-] | 286. | -0.164 | 2.43 | 0.169 | 0.869 | 0.747 | 0.989 | 0.918 | 0.854 | ||
| CLM4_GSWP3v1 | [-] | 286. | 0.323 | 2.29 | 0.169 | 0.877 | 0.759 | 0.989 | 0.949 | 0.867 | ||
| CLM5_CRUNCEPv7 | [-] | 286. | 0.395 | 2.39 | 0.169 | 0.859 | 0.762 | 0.989 | 0.946 | 0.864 | ||
| CLM5_GSWP3v1 | [-] | 287. | 0.668 | 2.41 | 0.169 | 0.847 | 0.766 | 0.989 | 0.955 | 0.865 |
Download Data |
Period Mean (original grids) [K] |
Bias [K] |
RMSE [K] |
Phase Shift [months] |
Bias Score [1] |
RMSE Score [1] |
Seasonal Cycle Score [1] |
Interannual Variability Score [1] |
Overall Score [1] |
|||
|---|---|---|---|---|---|---|---|---|---|---|---|---|
| Benchmark | [-] | 299. | ||||||||||
| CLM4.5_CRUNCEPv7 | [-] | 300. | 1.27 | 1.47 | 0.00 | 0.284 | 0.498 | 1.00 | 0.806 | 0.617 | ||
| CLM4.5_GSWP3v1 | [-] | 300. | 0.655 | 0.938 | 0.00 | 0.523 | 0.479 | 1.00 | 0.770 | 0.650 | ||
| CLM4_CRUNCEPv7 | [-] | 300. | 1.10 | 1.32 | 0.00 | 0.335 | 0.498 | 1.00 | 0.807 | 0.628 | ||
| CLM4_GSWP3v1 | [-] | 300. | 0.893 | 1.11 | 0.00 | 0.413 | 0.479 | 1.00 | 0.894 | 0.653 | ||
| CLM5_CRUNCEPv7 | [-] | 301. | 1.42 | 1.59 | 0.00 | 0.245 | 0.499 | 1.00 | 0.818 | 0.612 | ||
| CLM5_GSWP3v1 | [-] | 300. | 1.22 | 1.40 | 0.00 | 0.298 | 0.489 | 1.00 | 0.764 | 0.608 |
Temporally integrated period mean