Mean State
Download Data |
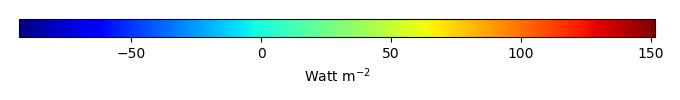
Period Mean (original grids) [Watt m-2] |
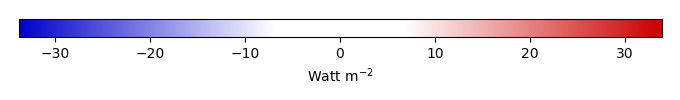
Bias [Watt m-2] |
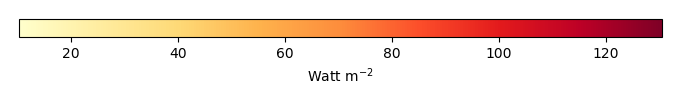
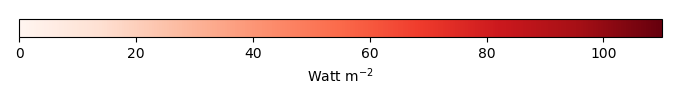
RMSE [Watt m-2] |
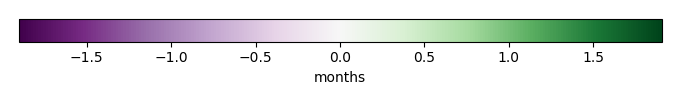
Phase Shift [months] |
Bias Score [1] |
RMSE Score [1] |
Seasonal Cycle Score [1] |
Interannual Variability Score [1] |
Overall Score [1] |
|||
|---|---|---|---|---|---|---|---|---|---|---|---|---|
| Benchmark | [-] | 19.5 | ||||||||||
| CLM4.5_CRUNCEPv7 | [-] | 69.4 | 40.1 | 81.8 | 1.02 | 0.172 | 0.472 | 0.933 | 0.154 | 0.441 | ||
| CLM4.5_GSWP3v1 | [-] | 60.8 | 37.1 | 75.0 | 0.508 | 0.186 | 0.551 | 0.966 | 0.172 | 0.485 | ||
| CLM4_CRUNCEPv7 | [-] | 68.3 | 38.2 | 80.6 | 1.02 | 0.173 | 0.471 | 0.933 | 0.152 | 0.440 | ||
| CLM4_GSWP3v1 | [-] | 59.8 | 35.0 | 74.0 | 0.508 | 0.185 | 0.550 | 0.966 | 0.170 | 0.484 | ||
| CLM5_CRUNCEPv7 | [-] | 65.7 | 36.6 | 82.1 | 1.02 | 0.183 | 0.455 | 0.933 | 0.150 | 0.435 | ||
| CLM5_GSWP3v1 | [-] | 57.9 | 34.9 | 75.1 | 0.508 | 0.193 | 0.541 | 0.966 | 0.170 | 0.482 |
Download Data |
Period Mean (original grids) [Watt m-2] |
Bias [Watt m-2] |
RMSE [Watt m-2] |
Phase Shift [months] |
Bias Score [1] |
RMSE Score [1] |
Seasonal Cycle Score [1] |
Interannual Variability Score [1] |
Overall Score [1] |
|||
|---|---|---|---|---|---|---|---|---|---|---|---|---|
| Benchmark | [-] | 38.3 | ||||||||||
| CLM4.5_CRUNCEPv7 | [-] | 71.4 | 10.6 | 32.9 | 0.583 | 0.252 | 0.696 | 0.961 | 0.308 | 0.583 | ||
| CLM4.5_GSWP3v1 | [-] | 66.6 | 9.61 | 34.1 | 0.583 | 0.251 | 0.659 | 0.953 | 0.332 | 0.571 | ||
| CLM4_CRUNCEPv7 | [-] | 71.6 | 12.0 | 33.0 | 0.511 | 0.247 | 0.701 | 0.966 | 0.319 | 0.587 | ||
| CLM4_GSWP3v1 | [-] | 67.2 | 10.6 | 34.0 | 0.510 | 0.246 | 0.661 | 0.958 | 0.334 | 0.572 | ||
| CLM5_CRUNCEPv7 | [-] | 67.8 | 6.30 | 33.3 | 0.511 | 0.260 | 0.691 | 0.966 | 0.305 | 0.582 | ||
| CLM5_GSWP3v1 | [-] | 63.8 | 7.18 | 34.9 | 0.511 | 0.259 | 0.612 | 0.958 | 0.338 | 0.556 |
Download Data |
Period Mean (original grids) [Watt m-2] |
Bias [Watt m-2] |
RMSE [Watt m-2] |
Phase Shift [months] |
Bias Score [1] |
RMSE Score [1] |
Seasonal Cycle Score [1] |
Interannual Variability Score [1] |
Overall Score [1] |
|||
|---|---|---|---|---|---|---|---|---|---|---|---|---|
| Benchmark | [-] | 66.3 | ||||||||||
| CLM4.5_CRUNCEPv7 | [-] | 61.3 | -15.0 | 22.2 | 1.02 | 0.192 | 0.576 | 0.933 | 0.685 | 0.592 | ||
| CLM4.5_GSWP3v1 | [-] | 55.5 | -23.6 | 30.6 | 0.00 | 0.140 | 0.569 | 1.00 | 0.764 | 0.608 | ||
| CLM4_CRUNCEPv7 | [-] | 61.1 | -14.8 | 22.1 | 1.02 | 0.194 | 0.577 | 0.933 | 0.690 | 0.594 | ||
| CLM4_GSWP3v1 | [-] | 55.9 | -22.6 | 29.7 | 0.00 | 0.146 | 0.572 | 1.00 | 0.770 | 0.612 | ||
| CLM5_CRUNCEPv7 | [-] | 61.2 | -14.4 | 22.0 | 1.02 | 0.197 | 0.578 | 0.933 | 0.706 | 0.598 | ||
| CLM5_GSWP3v1 | [-] | 55.4 | -23.0 | 30.5 | 0.00 | 0.143 | 0.564 | 1.00 | 0.779 | 0.610 |
Download Data |
Period Mean (original grids) [Watt m-2] |
Bias [Watt m-2] |
RMSE [Watt m-2] |
Phase Shift [months] |
Bias Score [1] |
RMSE Score [1] |
Seasonal Cycle Score [1] |
Interannual Variability Score [1] |
Overall Score [1] |
|||
|---|---|---|---|---|---|---|---|---|---|---|---|---|
| Benchmark | [-] | 80.3 | ||||||||||
| CLM4.5_CRUNCEPv7 | [-] | 92.3 | 8.47 | 22.5 | 0.407 | 0.572 | 0.748 | 0.973 | 0.615 | 0.731 | ||
| CLM4.5_GSWP3v1 | [-] | 85.8 | 2.54 | 19.5 | 0.407 | 0.592 | 0.767 | 0.973 | 0.651 | 0.750 | ||
| CLM4_CRUNCEPv7 | [-] | 95.1 | 11.8 | 23.7 | 0.203 | 0.548 | 0.753 | 0.987 | 0.618 | 0.732 | ||
| CLM4_GSWP3v1 | [-] | 88.3 | 5.78 | 20.9 | 0.407 | 0.561 | 0.773 | 0.973 | 0.658 | 0.748 | ||
| CLM5_CRUNCEPv7 | [-] | 84.6 | 1.07 | 21.9 | 0.203 | 0.597 | 0.735 | 0.987 | 0.596 | 0.730 | ||
| CLM5_GSWP3v1 | [-] | 79.9 | -2.92 | 19.0 | 0.203 | 0.624 | 0.769 | 0.987 | 0.651 | 0.760 |
Download Data |
Period Mean (original grids) [Watt m-2] |
Bias [Watt m-2] |
RMSE [Watt m-2] |
Phase Shift [months] |
Bias Score [1] |
RMSE Score [1] |
Seasonal Cycle Score [1] |
Interannual Variability Score [1] |
Overall Score [1] |
|||
|---|---|---|---|---|---|---|---|---|---|---|---|---|
| Benchmark | [-] | 62.7 | ||||||||||
| CLM4.5_CRUNCEPv7 | [-] | 62.1 | -0.549 | 13.7 | 0.254 | 0.970 | 0.775 | 0.983 | 0.910 | 0.883 | ||
| CLM4.5_GSWP3v1 | [-] | 64.5 | 1.85 | 15.0 | 0.762 | 0.938 | 0.764 | 0.920 | 0.898 | 0.857 | ||
| CLM4_CRUNCEPv7 | [-] | 64.6 | 1.97 | 13.5 | 0.254 | 0.955 | 0.781 | 0.983 | 0.918 | 0.883 | ||
| CLM4_GSWP3v1 | [-] | 66.1 | 3.48 | 15.3 | 0.762 | 0.934 | 0.765 | 0.920 | 0.903 | 0.857 | ||
| CLM5_CRUNCEPv7 | [-] | 61.4 | -1.26 | 13.4 | 0.254 | 0.978 | 0.781 | 0.983 | 0.915 | 0.888 | ||
| CLM5_GSWP3v1 | [-] | 65.5 | 2.88 | 14.8 | 0.762 | 0.941 | 0.769 | 0.920 | 0.945 | 0.869 |
Temporally integrated period mean