Mean State
Download Data |
Period Mean (original grids) [Pg] |
Model Period Mean (intersection) [Pg] |
Model Period Mean (complement) [Pg] |
Benchmark Period Mean (intersection) [Pg] |
Benchmark Period Mean (complement) [Pg] |
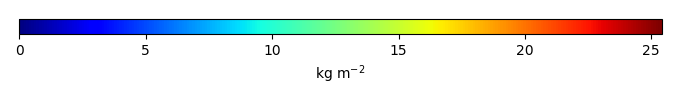
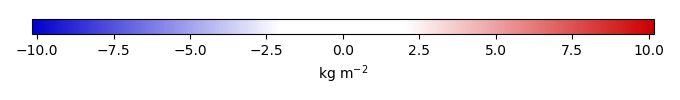
Bias [kg m-2] |
Bias Score [1] |
Spatial Distribution Score [1] |
Overall Score [1] |
|||
|---|---|---|---|---|---|---|---|---|---|---|---|---|
| Benchmark | [-] | 38.7 | ||||||||||
| CLM5PHSOFF | [-] | 47.1 | 46.4 | 0.867 | 38.7 | 0.0457 | 1.70 | 0.669 | 0.850 | 0.760 | ||
| CLM5PHSON | [-] | 38.5 | 38.7 | 0.202 | 38.7 | 0.0457 | 0.293 | 0.774 | 0.952 | 0.863 |
Download Data |
Period Mean (original grids) [Pg] |
Model Period Mean (intersection) [Pg] |
Model Period Mean (complement) [Pg] |
Benchmark Period Mean (intersection) [Pg] |
Benchmark Period Mean (complement) [Pg] |
Bias [kg m-2] |
Bias Score [1] |
Spatial Distribution Score [1] |
Overall Score [1] |
|||
|---|---|---|---|---|---|---|---|---|---|---|---|---|
| Benchmark | [-] | 11.9 | ||||||||||
| CLM5PHSOFF | [-] | 2.31 | 1.97 | 0.0401 | 11.9 | 0.0196 | -1.49 | 0.421 | 0.511 | 0.466 | ||
| CLM5PHSON | [-] | 3.25 | 2.85 | 0.0430 | 11.9 | 0.0196 | -1.35 | 0.454 | 0.594 | 0.524 |
Download Data |
Period Mean (original grids) [Pg] |
Model Period Mean (intersection) [Pg] |
Model Period Mean (complement) [Pg] |
Benchmark Period Mean (intersection) [Pg] |
Benchmark Period Mean (complement) [Pg] |
Bias [kg m-2] |
Bias Score [1] |
Spatial Distribution Score [1] |
Overall Score [1] |
|||
|---|---|---|---|---|---|---|---|---|---|---|---|---|
| Benchmark | [-] | 24.6 | ||||||||||
| CLM5PHSOFF | [-] | 10.4 | 8.53 | 1.41 | 24.5 | 0.0612 | -1.72 | 0.439 | 0.723 | 0.581 | ||
| CLM5PHSON | [-] | 12.3 | 11.7 | 0.367 | 24.5 | 0.0612 | -1.21 | 0.507 | 0.799 | 0.653 |
Download Data |
Period Mean (original grids) [Pg] |
Model Period Mean (intersection) [Pg] |
Model Period Mean (complement) [Pg] |
Benchmark Period Mean (intersection) [Pg] |
Benchmark Period Mean (complement) [Pg] |
Bias [kg m-2] |
Bias Score [1] |
Spatial Distribution Score [1] |
Overall Score [1] |
|||
|---|---|---|---|---|---|---|---|---|---|---|---|---|
| Benchmark | [-] | 36.8 | ||||||||||
| CLM5PHSOFF | [-] | 78.2 | 66.6 | 9.40 | 35.7 | 1.10 | 8.86 | 0.606 | 0.918 | 0.762 | ||
| CLM5PHSON | [-] | 39.9 | 37.9 | 1.80 | 35.7 | 1.10 | 5.14 | 0.715 | 0.918 | 0.817 |
Download Data |
Period Mean (original grids) [Pg] |
Model Period Mean (intersection) [Pg] |
Model Period Mean (complement) [Pg] |
Benchmark Period Mean (intersection) [Pg] |
Benchmark Period Mean (complement) [Pg] |
Bias [kg m-2] |
Bias Score [1] |
Spatial Distribution Score [1] |
Overall Score [1] |
|||
|---|---|---|---|---|---|---|---|---|---|---|---|---|
| Benchmark | [-] | 38.4 | ||||||||||
| CLM5PHSOFF | [-] | 27.7 | 22.1 | 5.53 | 38.3 | 0.0891 | -2.14 | 0.551 | 0.807 | 0.679 | ||
| CLM5PHSON | [-] | 31.6 | 23.2 | 9.15 | 38.3 | 0.0891 | -1.53 | 0.586 | 0.801 | 0.694 |
Download Data |
Period Mean (original grids) [Pg] |
Model Period Mean (intersection) [Pg] |
Model Period Mean (complement) [Pg] |
Benchmark Period Mean (intersection) [Pg] |
Benchmark Period Mean (complement) [Pg] |
Bias [kg m-2] |
Bias Score [1] |
Spatial Distribution Score [1] |
Overall Score [1] |
|||
|---|---|---|---|---|---|---|---|---|---|---|---|---|
| Benchmark | [-] | 43.7 | ||||||||||
| CLM5PHSOFF | [-] | 32.8 | 27.7 | 3.21 | 43.4 | 0.257 | -2.24 | 0.560 | 0.824 | 0.692 | ||
| CLM5PHSON | [-] | 24.8 | 23.2 | 0.670 | 43.4 | 0.257 | -1.98 | 0.606 | 0.890 | 0.748 |
Download Data |
Period Mean (original grids) [Pg] |
Model Period Mean (intersection) [Pg] |
Model Period Mean (complement) [Pg] |
Benchmark Period Mean (intersection) [Pg] |
Benchmark Period Mean (complement) [Pg] |
Bias [kg m-2] |
Bias Score [1] |
Spatial Distribution Score [1] |
Overall Score [1] |
|||
|---|---|---|---|---|---|---|---|---|---|---|---|---|
| Benchmark | [-] | 13.7 | ||||||||||
| CLM5PHSOFF | [-] | 18.2 | 3.44 | 14.2 | 13.5 | 0.139 | -1.61 | 0.409 | 0.596 | 0.502 | ||
| CLM5PHSON | [-] | 11.0 | 3.66 | 7.16 | 13.5 | 0.139 | -1.38 | 0.445 | 0.638 | 0.541 |
Download Data |
Period Mean (original grids) [Pg] |
Model Period Mean (intersection) [Pg] |
Model Period Mean (complement) [Pg] |
Benchmark Period Mean (intersection) [Pg] |
Benchmark Period Mean (complement) [Pg] |
Bias [kg m-2] |
Bias Score [1] |
Spatial Distribution Score [1] |
Overall Score [1] |
|||
|---|---|---|---|---|---|---|---|---|---|---|---|---|
| Benchmark | [-] | 352. | ||||||||||
| CLM5PHSOFF | [-] | 542. | 370. | 172. | 348. | 3.81 | 0.288 | 0.557 | 0.736 | 0.646 | ||
| CLM5PHSON | [-] | 486. | 309. | 178. | 348. | 3.81 | 0.0653 | 0.638 | 0.854 | 0.746 |
Download Data |
Period Mean (original grids) [Pg] |
Model Period Mean (intersection) [Pg] |
Model Period Mean (complement) [Pg] |
Benchmark Period Mean (intersection) [Pg] |
Benchmark Period Mean (complement) [Pg] |
Bias [kg m-2] |
Bias Score [1] |
Spatial Distribution Score [1] |
Overall Score [1] |
|||
|---|---|---|---|---|---|---|---|---|---|---|---|---|
| Benchmark | [-] | 2.53 | ||||||||||
| CLM5PHSOFF | [-] | 0.976 | 0.0715 | 0.806 | 2.53 | 0.00250 | -1.11 | 0.376 | 0.00299 | 0.189 | ||
| CLM5PHSON | [-] | 1.55 | 0.211 | 1.35 | 2.53 | 0.00250 | -1.04 | 0.395 | 0.0211 | 0.208 |
Download Data |
Period Mean (original grids) [Pg] |
Model Period Mean (intersection) [Pg] |
Model Period Mean (complement) [Pg] |
Benchmark Period Mean (intersection) [Pg] |
Benchmark Period Mean (complement) [Pg] |
Bias [kg m-2] |
Bias Score [1] |
Spatial Distribution Score [1] |
Overall Score [1] |
|||
|---|---|---|---|---|---|---|---|---|---|---|---|---|
| Benchmark | [-] | 11.1 | ||||||||||
| CLM5PHSOFF | [-] | 16.3 | 13.5 | 1.99 | 10.9 | 0.149 | 0.792 | 0.543 | 0.665 | 0.604 | ||
| CLM5PHSON | [-] | 10.2 | 9.38 | 0.547 | 10.9 | 0.149 | 0.813 | 0.607 | 0.775 | 0.691 |
Download Data |
Period Mean (original grids) [Pg] |
Model Period Mean (intersection) [Pg] |
Model Period Mean (complement) [Pg] |
Benchmark Period Mean (intersection) [Pg] |
Benchmark Period Mean (complement) [Pg] |
Bias [kg m-2] |
Bias Score [1] |
Spatial Distribution Score [1] |
Overall Score [1] |
|||
|---|---|---|---|---|---|---|---|---|---|---|---|---|
| Benchmark | [-] | 1.55 | ||||||||||
| CLM5PHSOFF | [-] | 7.10 | 1.11 | 5.64 | 1.52 | 0.0247 | -0.473 | 0.500 | 0.719 | 0.609 | ||
| CLM5PHSON | [-] | 11.9 | 1.32 | 10.5 | 1.52 | 0.0247 | 0.434 | 0.550 | 0.683 | 0.617 |
Download Data |
Period Mean (original grids) [Pg] |
Model Period Mean (intersection) [Pg] |
Model Period Mean (complement) [Pg] |
Benchmark Period Mean (intersection) [Pg] |
Benchmark Period Mean (complement) [Pg] |
Bias [kg m-2] |
Bias Score [1] |
Spatial Distribution Score [1] |
Overall Score [1] |
|||
|---|---|---|---|---|---|---|---|---|---|---|---|---|
| Benchmark | [-] | 0.219 | ||||||||||
| CLM5PHSOFF | [-] | 1.45 | 0.0491 | 1.50 | 0.219 | -0.542 | 0.424 | 0.0202 | 0.222 | |||
| CLM5PHSON | [-] | 3.04 | 0.0844 | 2.99 | 0.219 | -0.433 | 0.468 | 0.0819 | 0.275 |
Download Data |
Period Mean (original grids) [Pg] |
Model Period Mean (intersection) [Pg] |
Model Period Mean (complement) [Pg] |
Benchmark Period Mean (intersection) [Pg] |
Benchmark Period Mean (complement) [Pg] |
Bias [kg m-2] |
Bias Score [1] |
Spatial Distribution Score [1] |
Overall Score [1] |
|||
|---|---|---|---|---|---|---|---|---|---|---|---|---|
| Benchmark | [-] | 100. | ||||||||||
| CLM5PHSOFF | [-] | 149. | 147. | 1.94 | 100. | 0.0690 | 5.46 | 0.585 | 0.721 | 0.653 | ||
| CLM5PHSON | [-] | 128. | 128. | 0.396 | 100. | 0.0690 | 3.63 | 0.709 | 0.919 | 0.814 |
Download Data |
Period Mean (original grids) [Pg] |
Model Period Mean (intersection) [Pg] |
Model Period Mean (complement) [Pg] |
Benchmark Period Mean (intersection) [Pg] |
Benchmark Period Mean (complement) [Pg] |
Bias [kg m-2] |
Bias Score [1] |
Spatial Distribution Score [1] |
Overall Score [1] |
|||
|---|---|---|---|---|---|---|---|---|---|---|---|---|
| Benchmark | [-] | 18.4 | ||||||||||
| CLM5PHSOFF | [-] | 20.6 | 19.4 | 1.25 | 18.4 | 0.0281 | 0.100 | 0.497 | 0.523 | 0.510 | ||
| CLM5PHSON | [-] | 21.8 | 21.8 | 0.347 | 18.4 | 0.0281 | 0.735 | 0.546 | 0.579 | 0.563 |
Download Data |
Period Mean (original grids) [Pg] |
Model Period Mean (intersection) [Pg] |
Model Period Mean (complement) [Pg] |
Benchmark Period Mean (intersection) [Pg] |
Benchmark Period Mean (complement) [Pg] |
Bias [kg m-2] |
Bias Score [1] |
Spatial Distribution Score [1] |
Overall Score [1] |
|||
|---|---|---|---|---|---|---|---|---|---|---|---|---|
| Benchmark | [-] | 7.28 | ||||||||||
| CLM5PHSOFF | [-] | 8.11 | 7.83 | 0.482 | 7.15 | 0.128 | 0.290 | 0.484 | 0.496 | 0.490 | ||
| CLM5PHSON | [-] | 6.25 | 6.14 | 0.145 | 7.15 | 0.128 | 0.387 | 0.524 | 0.568 | 0.546 |
Temporally integrated period mean