Mean State
Download Data |
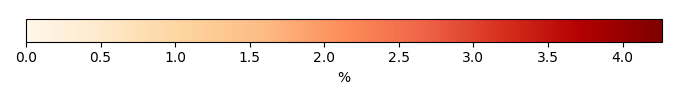
Period Mean (original grids) [%] |
Model Period Mean (intersection) [%] |
Model Period Mean (complement) [%] |
Benchmark Period Mean (intersection) [%] |
Benchmark Period Mean (complement) [%] |
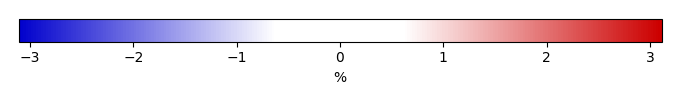
Bias [%] |
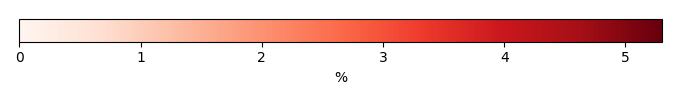
RMSE [%] |
Phase Shift [months] |
Bias Score [1] |
RMSE Score [1] |
Seasonal Cycle Score [1] |
Spatial Distribution Score [1] |
Interannual Variability Score [1] |
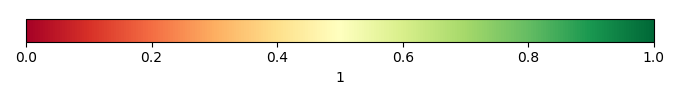
Overall Score [1] |
|||
|---|---|---|---|---|---|---|---|---|---|---|---|---|---|---|---|---|---|
| Benchmark | [-] | 0.419 | |||||||||||||||
| CLM5PHSOFF | [-] | 0.242 | 0.293 | 0.0279 | 0.420 | 0.0175 | -0.139 | 1.17 | 1.89 | 0.716 | 0.369 | 0.876 | 0.503 | 0.504 | 0.556 | ||
| CLM5PHSON | [-] | 0.237 | 0.291 | 0.0207 | 0.420 | 0.0175 | -0.150 | 1.27 | 1.98 | 0.695 | 0.345 | 0.806 | 0.526 | 0.510 | 0.538 |
Download Data |
Period Mean (original grids) [%] |
Model Period Mean (intersection) [%] |
Model Period Mean (complement) [%] |
Benchmark Period Mean (intersection) [%] |
Benchmark Period Mean (complement) [%] |
Bias [%] |
RMSE [%] |
Phase Shift [months] |
Bias Score [1] |
RMSE Score [1] |
Seasonal Cycle Score [1] |
Spatial Distribution Score [1] |
Interannual Variability Score [1] |
Overall Score [1] |
|||
|---|---|---|---|---|---|---|---|---|---|---|---|---|---|---|---|---|---|
| Benchmark | [-] | 1.70 | |||||||||||||||
| CLM5PHSOFF | [-] | 0.923 | 0.945 | 0.0329 | 1.70 | 0.140 | -0.753 | 3.65 | 1.70 | 0.754 | 0.393 | 0.868 | 0.455 | 0.483 | 0.558 | ||
| CLM5PHSON | [-] | 1.00 | 1.02 | 0.0263 | 1.70 | 0.140 | -0.687 | 4.04 | 2.16 | 0.753 | 0.358 | 0.735 | 0.538 | 0.503 | 0.541 |
Download Data |
Period Mean (original grids) [%] |
Model Period Mean (intersection) [%] |
Model Period Mean (complement) [%] |
Benchmark Period Mean (intersection) [%] |
Benchmark Period Mean (complement) [%] |
Bias [%] |
RMSE [%] |
Phase Shift [months] |
Bias Score [1] |
RMSE Score [1] |
Seasonal Cycle Score [1] |
Spatial Distribution Score [1] |
Interannual Variability Score [1] |
Overall Score [1] |
|||
|---|---|---|---|---|---|---|---|---|---|---|---|---|---|---|---|---|---|
| Benchmark | [-] | 1.56 | |||||||||||||||
| CLM5PHSOFF | [-] | 0.650 | 0.697 | 0.122 | 1.57 | 0.174 | -0.888 | 3.16 | 1.41 | 0.693 | 0.398 | 0.855 | 0.357 | 0.493 | 0.532 | ||
| CLM5PHSON | [-] | 1.12 | 1.14 | 0.174 | 1.57 | 0.174 | -0.477 | 3.94 | 1.68 | 0.717 | 0.328 | 0.759 | 0.735 | 0.554 | 0.570 |
Download Data |
Period Mean (original grids) [%] |
Model Period Mean (intersection) [%] |
Model Period Mean (complement) [%] |
Benchmark Period Mean (intersection) [%] |
Benchmark Period Mean (complement) [%] |
Bias [%] |
RMSE [%] |
Phase Shift [months] |
Bias Score [1] |
RMSE Score [1] |
Seasonal Cycle Score [1] |
Spatial Distribution Score [1] |
Interannual Variability Score [1] |
Overall Score [1] |
|||
|---|---|---|---|---|---|---|---|---|---|---|---|---|---|---|---|---|---|
| Benchmark | [-] | 0.0193 | |||||||||||||||
| CLM5PHSOFF | [-] | 0.0266 | 0.0299 | 0.000510 | 0.0194 | 0.00172 | 0.0109 | 0.279 | 2.23 | 0.867 | 0.345 | 0.943 | 0.383 | 0.401 | 0.547 | ||
| CLM5PHSON | [-] | 0.178 | 0.187 | 0.00219 | 0.0194 | 0.00172 | 0.157 | 0.691 | 2.20 | 0.746 | 0.276 | 0.954 | 0.0713 | 0.438 | 0.460 |
Download Data |
Period Mean (original grids) [%] |
Model Period Mean (intersection) [%] |
Model Period Mean (complement) [%] |
Benchmark Period Mean (intersection) [%] |
Benchmark Period Mean (complement) [%] |
Bias [%] |
RMSE [%] |
Phase Shift [months] |
Bias Score [1] |
RMSE Score [1] |
Seasonal Cycle Score [1] |
Spatial Distribution Score [1] |
Interannual Variability Score [1] |
Overall Score [1] |
|||
|---|---|---|---|---|---|---|---|---|---|---|---|---|---|---|---|---|---|
| Benchmark | [-] | 0.0475 | |||||||||||||||
| CLM5PHSOFF | [-] | 0.100 | 0.0914 | 0.130 | 0.0503 | 0.0178 | 0.0419 | 0.307 | 1.90 | 0.727 | 0.305 | 0.860 | 0.531 | 0.474 | 0.534 | ||
| CLM5PHSON | [-] | 0.0826 | 0.0764 | 0.144 | 0.0503 | 0.0178 | 0.0344 | 0.295 | 1.88 | 0.733 | 0.312 | 0.862 | 0.596 | 0.481 | 0.549 |
Download Data |
Period Mean (original grids) [%] |
Model Period Mean (intersection) [%] |
Model Period Mean (complement) [%] |
Benchmark Period Mean (intersection) [%] |
Benchmark Period Mean (complement) [%] |
Bias [%] |
RMSE [%] |
Phase Shift [months] |
Bias Score [1] |
RMSE Score [1] |
Seasonal Cycle Score [1] |
Spatial Distribution Score [1] |
Interannual Variability Score [1] |
Overall Score [1] |
|||
|---|---|---|---|---|---|---|---|---|---|---|---|---|---|---|---|---|---|
| Benchmark | [-] | 0.0788 | |||||||||||||||
| CLM5PHSOFF | [-] | 0.0451 | 0.0456 | 0.00282 | 0.0789 | 0.0300 | -0.0323 | 0.511 | 1.83 | 0.841 | 0.349 | 0.768 | 0.616 | 0.462 | 0.564 | ||
| CLM5PHSON | [-] | 0.150 | 0.151 | 0.00510 | 0.0789 | 0.0300 | 0.0719 | 0.798 | 1.71 | 0.798 | 0.298 | 0.740 | 0.482 | 0.475 | 0.515 |
Download Data |
Period Mean (original grids) [%] |
Model Period Mean (intersection) [%] |
Model Period Mean (complement) [%] |
Benchmark Period Mean (intersection) [%] |
Benchmark Period Mean (complement) [%] |
Bias [%] |
RMSE [%] |
Phase Shift [months] |
Bias Score [1] |
RMSE Score [1] |
Seasonal Cycle Score [1] |
Spatial Distribution Score [1] |
Interannual Variability Score [1] |
Overall Score [1] |
|||
|---|---|---|---|---|---|---|---|---|---|---|---|---|---|---|---|---|---|
| Benchmark | [-] | 0.115 | |||||||||||||||
| CLM5PHSOFF | [-] | 0.0836 | 0.0977 | 0.00409 | 0.114 | 0.190 | -0.0169 | 0.626 | 2.29 | 0.772 | 0.355 | 0.758 | 0.569 | 0.414 | 0.537 | ||
| CLM5PHSON | [-] | 0.207 | 0.235 | 0.0116 | 0.114 | 0.190 | 0.111 | 0.869 | 2.38 | 0.774 | 0.327 | 0.784 | 0.460 | 0.457 | 0.521 |
Download Data |
Period Mean (original grids) [%] |
Model Period Mean (intersection) [%] |
Model Period Mean (complement) [%] |
Benchmark Period Mean (intersection) [%] |
Benchmark Period Mean (complement) [%] |
Bias [%] |
RMSE [%] |
Phase Shift [months] |
Bias Score [1] |
RMSE Score [1] |
Seasonal Cycle Score [1] |
Spatial Distribution Score [1] |
Interannual Variability Score [1] |
Overall Score [1] |
|||
|---|---|---|---|---|---|---|---|---|---|---|---|---|---|---|---|---|---|
| Benchmark | [-] | 0.177 | |||||||||||||||
| CLM5PHSOFF | [-] | 0.178 | 0.190 | 0.0908 | 0.179 | 0.0206 | 0.0132 | 0.661 | 1.53 | 0.725 | 0.348 | 0.843 | 0.637 | 0.476 | 0.563 | ||
| CLM5PHSON | [-] | 0.215 | 0.229 | 0.0345 | 0.179 | 0.0206 | 0.0437 | 0.761 | 1.58 | 0.686 | 0.328 | 0.837 | 0.620 | 0.448 | 0.541 |
Download Data |
Period Mean (original grids) [%] |
Model Period Mean (intersection) [%] |
Model Period Mean (complement) [%] |
Benchmark Period Mean (intersection) [%] |
Benchmark Period Mean (complement) [%] |
Bias [%] |
RMSE [%] |
Phase Shift [months] |
Bias Score [1] |
RMSE Score [1] |
Seasonal Cycle Score [1] |
Spatial Distribution Score [1] |
Interannual Variability Score [1] |
Overall Score [1] |
|||
|---|---|---|---|---|---|---|---|---|---|---|---|---|---|---|---|---|---|
| Benchmark | [-] | 0.00900 | |||||||||||||||
| CLM5PHSOFF | [-] | 0.0584 | 0.0633 | 0.000858 | 0.00902 | 0.000132 | 0.0535 | 0.333 | 2.14 | 0.832 | 0.318 | 0.833 | 0.0667 | 0.440 | 0.468 | ||
| CLM5PHSON | [-] | 0.170 | 0.175 | 0.000402 | 0.00902 | 0.000132 | 0.161 | 0.612 | 2.14 | 0.733 | 0.273 | 0.840 | 0.0123 | 0.422 | 0.426 |
Download Data |
Period Mean (original grids) [%] |
Model Period Mean (intersection) [%] |
Model Period Mean (complement) [%] |
Benchmark Period Mean (intersection) [%] |
Benchmark Period Mean (complement) [%] |
Bias [%] |
RMSE [%] |
Phase Shift [months] |
Bias Score [1] |
RMSE Score [1] |
Seasonal Cycle Score [1] |
Spatial Distribution Score [1] |
Interannual Variability Score [1] |
Overall Score [1] |
|||
|---|---|---|---|---|---|---|---|---|---|---|---|---|---|---|---|---|---|
| Benchmark | [-] | 0.529 | |||||||||||||||
| CLM5PHSOFF | [-] | 0.227 | 0.235 | 0.146 | 0.532 | 0.281 | -0.299 | 2.08 | 1.71 | 0.769 | 0.365 | 0.783 | 0.375 | 0.418 | 0.512 | ||
| CLM5PHSON | [-] | 0.407 | 0.416 | 0.153 | 0.532 | 0.281 | -0.139 | 2.23 | 1.57 | 0.776 | 0.362 | 0.825 | 0.542 | 0.424 | 0.549 |
Download Data |
Period Mean (original grids) [%] |
Model Period Mean (intersection) [%] |
Model Period Mean (complement) [%] |
Benchmark Period Mean (intersection) [%] |
Benchmark Period Mean (complement) [%] |
Bias [%] |
RMSE [%] |
Phase Shift [months] |
Bias Score [1] |
RMSE Score [1] |
Seasonal Cycle Score [1] |
Spatial Distribution Score [1] |
Interannual Variability Score [1] |
Overall Score [1] |
|||
|---|---|---|---|---|---|---|---|---|---|---|---|---|---|---|---|---|---|
| Benchmark | [-] | 0.0201 | |||||||||||||||
| CLM5PHSOFF | [-] | 0.0274 | 0.0273 | 0.0248 | 0.0202 | 0.0135 | 0.00666 | 0.124 | 2.25 | 0.758 | 0.336 | 0.839 | 0.642 | 0.441 | 0.559 | ||
| CLM5PHSON | [-] | 0.106 | 0.111 | 0.0354 | 0.0202 | 0.0135 | 0.0860 | 0.280 | 2.18 | 0.625 | 0.246 | 0.858 | 0.118 | 0.469 | 0.427 |
Download Data |
Period Mean (original grids) [%] |
Model Period Mean (intersection) [%] |
Model Period Mean (complement) [%] |
Benchmark Period Mean (intersection) [%] |
Benchmark Period Mean (complement) [%] |
Bias [%] |
RMSE [%] |
Phase Shift [months] |
Bias Score [1] |
RMSE Score [1] |
Seasonal Cycle Score [1] |
Spatial Distribution Score [1] |
Interannual Variability Score [1] |
Overall Score [1] |
|||
|---|---|---|---|---|---|---|---|---|---|---|---|---|---|---|---|---|---|
| Benchmark | [-] | 0.319 | |||||||||||||||
| CLM5PHSOFF | [-] | 0.173 | 0.210 | 0.0221 | 0.324 | 0.0464 | -0.115 | 0.957 | 1.95 | 0.730 | 0.379 | 0.844 | 0.522 | 0.475 | 0.555 | ||
| CLM5PHSON | [-] | 0.275 | 0.321 | 0.0130 | 0.324 | 0.0464 | -0.0180 | 1.17 | 1.97 | 0.732 | 0.338 | 0.774 | 0.699 | 0.503 | 0.564 |
Download Data |
Period Mean (original grids) [%] |
Model Period Mean (intersection) [%] |
Model Period Mean (complement) [%] |
Benchmark Period Mean (intersection) [%] |
Benchmark Period Mean (complement) [%] |
Bias [%] |
RMSE [%] |
Phase Shift [months] |
Bias Score [1] |
RMSE Score [1] |
Seasonal Cycle Score [1] |
Spatial Distribution Score [1] |
Interannual Variability Score [1] |
Overall Score [1] |
|||
|---|---|---|---|---|---|---|---|---|---|---|---|---|---|---|---|---|---|
| Benchmark | [-] | 0.0194 | |||||||||||||||
| CLM5PHSOFF | [-] | 0.00916 | 0.0269 | 0.00162 | 0.0196 | 0.00365 | 0.00934 | 0.119 | 2.35 | 0.729 | 0.332 | 0.801 | 0.594 | 0.406 | 0.532 | ||
| CLM5PHSON | [-] | 0.0296 | 0.0892 | 0.00166 | 0.0196 | 0.00365 | 0.0760 | 0.219 | 2.48 | 0.665 | 0.313 | 0.786 | 0.212 | 0.427 | 0.453 |
Download Data |
Period Mean (original grids) [%] |
Model Period Mean (intersection) [%] |
Model Period Mean (complement) [%] |
Benchmark Period Mean (intersection) [%] |
Benchmark Period Mean (complement) [%] |
Bias [%] |
RMSE [%] |
Phase Shift [months] |
Bias Score [1] |
RMSE Score [1] |
Seasonal Cycle Score [1] |
Spatial Distribution Score [1] |
Interannual Variability Score [1] |
Overall Score [1] |
|||
|---|---|---|---|---|---|---|---|---|---|---|---|---|---|---|---|---|---|
| Benchmark | [-] | 0.0156 | |||||||||||||||
| CLM5PHSOFF | [-] | 0.00392 | 0.00516 | 0.000246 | 0.0156 | 6.09e-05 | -0.0102 | 0.154 | 2.52 | 0.892 | 0.363 | 0.785 | 0.447 | 0.394 | 0.541 | ||
| CLM5PHSON | [-] | 0.0152 | 0.0184 | 0.000483 | 0.0156 | 6.09e-05 | 0.00242 | 0.186 | 2.49 | 0.884 | 0.357 | 0.875 | 0.512 | 0.398 | 0.564 |
Download Data |
Period Mean (original grids) [%] |
Model Period Mean (intersection) [%] |
Model Period Mean (complement) [%] |
Benchmark Period Mean (intersection) [%] |
Benchmark Period Mean (complement) [%] |
Bias [%] |
RMSE [%] |
Phase Shift [months] |
Bias Score [1] |
RMSE Score [1] |
Seasonal Cycle Score [1] |
Spatial Distribution Score [1] |
Interannual Variability Score [1] |
Overall Score [1] |
|||
|---|---|---|---|---|---|---|---|---|---|---|---|---|---|---|---|---|---|
| Benchmark | [-] | 0.0820 | |||||||||||||||
| CLM5PHSOFF | [-] | 0.222 | 0.248 | 0.0844 | 0.0842 | 0.0187 | 0.161 | 0.556 | 1.67 | 0.650 | 0.300 | 0.838 | 0.234 | 0.474 | 0.466 | ||
| CLM5PHSON | [-] | 0.442 | 0.473 | 0.0841 | 0.0842 | 0.0187 | 0.322 | 0.868 | 1.64 | 0.570 | 0.270 | 0.860 | 0.0879 | 0.390 | 0.408 |
Download Data |
Period Mean (original grids) [%] |
Model Period Mean (intersection) [%] |
Model Period Mean (complement) [%] |
Benchmark Period Mean (intersection) [%] |
Benchmark Period Mean (complement) [%] |
Bias [%] |
RMSE [%] |
Phase Shift [months] |
Bias Score [1] |
RMSE Score [1] |
Seasonal Cycle Score [1] |
Spatial Distribution Score [1] |
Interannual Variability Score [1] |
Overall Score [1] |
|||
|---|---|---|---|---|---|---|---|---|---|---|---|---|---|---|---|---|---|
| Benchmark | [-] | 0.0297 | |||||||||||||||
| CLM5PHSOFF | [-] | 0.0272 | 0.0279 | 0.0146 | 0.0299 | 0.00710 | -0.00216 | 0.161 | 2.95 | 0.700 | 0.280 | 0.571 | 0.623 | 0.445 | 0.483 | ||
| CLM5PHSON | [-] | 0.0389 | 0.0389 | 0.00472 | 0.0299 | 0.00710 | 0.00771 | 0.214 | 3.07 | 0.682 | 0.256 | 0.516 | 0.639 | 0.430 | 0.463 |
Download Data |
Period Mean (original grids) [%] |
Model Period Mean (intersection) [%] |
Model Period Mean (complement) [%] |
Benchmark Period Mean (intersection) [%] |
Benchmark Period Mean (complement) [%] |
Bias [%] |
RMSE [%] |
Phase Shift [months] |
Bias Score [1] |
RMSE Score [1] |
Seasonal Cycle Score [1] |
Spatial Distribution Score [1] |
Interannual Variability Score [1] |
Overall Score [1] |
|||
|---|---|---|---|---|---|---|---|---|---|---|---|---|---|---|---|---|---|
| Benchmark | [-] | 0.0271 | |||||||||||||||
| CLM5PHSOFF | [-] | 0.0129 | 0.0131 | 0.00200 | 0.0273 | 0.000223 | -0.0138 | 0.247 | 2.34 | 0.878 | 0.353 | 0.831 | 0.557 | 0.422 | 0.566 | ||
| CLM5PHSON | [-] | 0.0294 | 0.0285 | 0.00691 | 0.0273 | 0.000223 | 0.000160 | 0.276 | 2.27 | 0.862 | 0.343 | 0.848 | 0.481 | 0.419 | 0.549 |
Download Data |
Period Mean (original grids) [%] |
Model Period Mean (intersection) [%] |
Model Period Mean (complement) [%] |
Benchmark Period Mean (intersection) [%] |
Benchmark Period Mean (complement) [%] |
Bias [%] |
RMSE [%] |
Phase Shift [months] |
Bias Score [1] |
RMSE Score [1] |
Seasonal Cycle Score [1] |
Spatial Distribution Score [1] |
Interannual Variability Score [1] |
Overall Score [1] |
|||
|---|---|---|---|---|---|---|---|---|---|---|---|---|---|---|---|---|---|
| Benchmark | [-] | 0.0297 | |||||||||||||||
| CLM5PHSOFF | [-] | 0.0290 | 0.0315 | 0.0346 | 0.0297 | 0.0262 | 0.00202 | 0.263 | 2.46 | 0.822 | 0.344 | 0.674 | 0.427 | 0.388 | 0.500 | ||
| CLM5PHSON | [-] | 0.152 | 0.154 | 0.103 | 0.0297 | 0.0262 | 0.125 | 0.490 | 2.03 | 0.703 | 0.280 | 0.781 | 0.0960 | 0.415 | 0.426 |
Download Data |
Period Mean (original grids) [%] |
Model Period Mean (intersection) [%] |
Model Period Mean (complement) [%] |
Benchmark Period Mean (intersection) [%] |
Benchmark Period Mean (complement) [%] |
Bias [%] |
RMSE [%] |
Phase Shift [months] |
Bias Score [1] |
RMSE Score [1] |
Seasonal Cycle Score [1] |
Spatial Distribution Score [1] |
Interannual Variability Score [1] |
Overall Score [1] |
|||
|---|---|---|---|---|---|---|---|---|---|---|---|---|---|---|---|---|---|
| Benchmark | [-] | 0.125 | |||||||||||||||
| CLM5PHSOFF | [-] | 0.145 | 0.148 | 0.0347 | 0.125 | 0.0201 | 0.0248 | 0.494 | 1.24 | 0.715 | 0.317 | 0.908 | 0.635 | 0.489 | 0.563 | ||
| CLM5PHSON | [-] | 0.101 | 0.101 | 0.0471 | 0.125 | 0.0201 | -0.0252 | 0.438 | 1.26 | 0.689 | 0.314 | 0.892 | 0.730 | 0.440 | 0.563 |
Download Data |
Period Mean (original grids) [%] |
Model Period Mean (intersection) [%] |
Model Period Mean (complement) [%] |
Benchmark Period Mean (intersection) [%] |
Benchmark Period Mean (complement) [%] |
Bias [%] |
RMSE [%] |
Phase Shift [months] |
Bias Score [1] |
RMSE Score [1] |
Seasonal Cycle Score [1] |
Spatial Distribution Score [1] |
Interannual Variability Score [1] |
Overall Score [1] |
|||
|---|---|---|---|---|---|---|---|---|---|---|---|---|---|---|---|---|---|
| Benchmark | [-] | 0.224 | |||||||||||||||
| CLM5PHSOFF | [-] | 0.401 | 0.412 | 0.0286 | 0.225 | 0.0102 | 0.185 | 1.01 | 1.52 | 0.688 | 0.316 | 0.828 | 0.763 | 0.495 | 0.568 | ||
| CLM5PHSON | [-] | 0.504 | 0.511 | 0.0432 | 0.225 | 0.0102 | 0.262 | 1.24 | 1.44 | 0.655 | 0.296 | 0.849 | 0.580 | 0.466 | 0.524 |
Download Data |
Period Mean (original grids) [%] |
Model Period Mean (intersection) [%] |
Model Period Mean (complement) [%] |
Benchmark Period Mean (intersection) [%] |
Benchmark Period Mean (complement) [%] |
Bias [%] |
RMSE [%] |
Phase Shift [months] |
Bias Score [1] |
RMSE Score [1] |
Seasonal Cycle Score [1] |
Spatial Distribution Score [1] |
Interannual Variability Score [1] |
Overall Score [1] |
|||
|---|---|---|---|---|---|---|---|---|---|---|---|---|---|---|---|---|---|
| Benchmark | [-] | 0.0270 | |||||||||||||||
| CLM5PHSOFF | [-] | 0.142 | 0.154 | 0.0297 | 0.0272 | 0.00281 | 0.122 | 0.452 | 1.74 | 0.719 | 0.304 | 0.749 | 0.130 | 0.364 | 0.428 | ||
| CLM5PHSON | [-] | 0.274 | 0.279 | 0.0483 | 0.0272 | 0.00281 | 0.233 | 0.594 | 1.66 | 0.707 | 0.291 | 0.859 | 0.0643 | 0.409 | 0.437 |
Temporally integrated period mean