Mean State
Download Data |
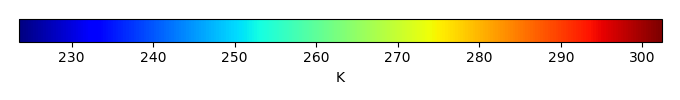
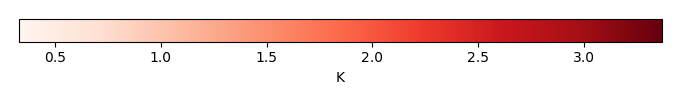
Period Mean (original grids) [K] |
Model Period Mean (intersection) [K] |
Model Period Mean (complement) [K] |
Benchmark Period Mean (intersection) [K] |
Benchmark Period Mean (complement) [K] |
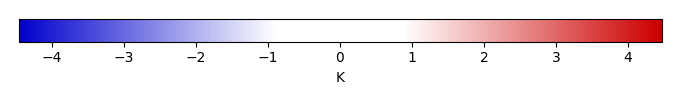
Bias [K] |
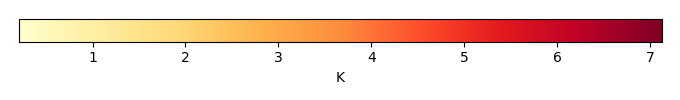
RMSE [K] |
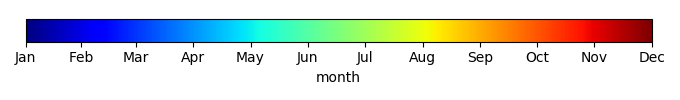
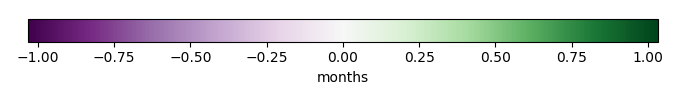
Phase Shift [months] |
Bias Score [1] |
RMSE Score [1] |
Seasonal Cycle Score [1] |
Spatial Distribution Score [1] |
Interannual Variability Score [1] |
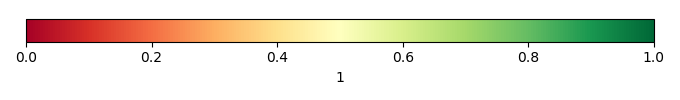
Overall Score [1] |
|||
|---|---|---|---|---|---|---|---|---|---|---|---|---|---|---|---|---|---|
| Benchmark | [-] | 299. | |||||||||||||||
| CLM5PHSOFF | [-] | 299. | 299. | 300. | 298. | 300. | 0.225 | 0.724 | 0.428 | 0.647 | 0.753 | 0.963 | 1.00 | 0.954 | 0.845 | ||
| CLM5PHSON | [-] | 299. | 299. | 300. | 298. | 300. | 0.285 | 0.690 | 0.366 | 0.667 | 0.779 | 0.967 | 1.00 | 0.955 | 0.858 |
Download Data |
Period Mean (original grids) [K] |
Model Period Mean (intersection) [K] |
Model Period Mean (complement) [K] |
Benchmark Period Mean (intersection) [K] |
Benchmark Period Mean (complement) [K] |
Bias [K] |
RMSE [K] |
Phase Shift [months] |
Bias Score [1] |
RMSE Score [1] |
Seasonal Cycle Score [1] |
Spatial Distribution Score [1] |
Interannual Variability Score [1] |
Overall Score [1] |
|||
|---|---|---|---|---|---|---|---|---|---|---|---|---|---|---|---|---|---|
| Benchmark | [-] | 300. | |||||||||||||||
| CLM5PHSOFF | [-] | 301. | 301. | 300. | 300. | 300. | 0.460 | 0.798 | 0.168 | 0.747 | 0.862 | 0.987 | 0.989 | 0.965 | 0.902 | ||
| CLM5PHSON | [-] | 301. | 301. | 301. | 300. | 300. | 0.473 | 0.802 | 0.168 | 0.746 | 0.862 | 0.987 | 0.990 | 0.964 | 0.902 |
Download Data |
Period Mean (original grids) [K] |
Model Period Mean (intersection) [K] |
Model Period Mean (complement) [K] |
Benchmark Period Mean (intersection) [K] |
Benchmark Period Mean (complement) [K] |
Bias [K] |
RMSE [K] |
Phase Shift [months] |
Bias Score [1] |
RMSE Score [1] |
Seasonal Cycle Score [1] |
Spatial Distribution Score [1] |
Interannual Variability Score [1] |
Overall Score [1] |
|||
|---|---|---|---|---|---|---|---|---|---|---|---|---|---|---|---|---|---|
| Benchmark | [-] | 295. | |||||||||||||||
| CLM5PHSOFF | [-] | 296. | 296. | 297. | 295. | 297. | 0.525 | 0.859 | 0.287 | 0.703 | 0.871 | 0.967 | 0.999 | 0.962 | 0.895 | ||
| CLM5PHSON | [-] | 296. | 296. | 296. | 295. | 297. | 0.505 | 0.854 | 0.273 | 0.707 | 0.867 | 0.968 | 0.999 | 0.960 | 0.895 |
Download Data |
Period Mean (original grids) [K] |
Model Period Mean (intersection) [K] |
Model Period Mean (complement) [K] |
Benchmark Period Mean (intersection) [K] |
Benchmark Period Mean (complement) [K] |
Bias [K] |
RMSE [K] |
Phase Shift [months] |
Bias Score [1] |
RMSE Score [1] |
Seasonal Cycle Score [1] |
Spatial Distribution Score [1] |
Interannual Variability Score [1] |
Overall Score [1] |
|||
|---|---|---|---|---|---|---|---|---|---|---|---|---|---|---|---|---|---|
| Benchmark | [-] | 262. | |||||||||||||||
| CLM5PHSOFF | [-] | 262. | 262. | 269. | 262. | 266. | 0.253 | 1.14 | 0.0145 | 0.941 | 0.956 | 0.999 | 1.00 | 0.938 | 0.965 | ||
| CLM5PHSON | [-] | 262. | 261. | 267. | 262. | 266. | 0.258 | 1.13 | 0.0161 | 0.941 | 0.957 | 0.999 | 1.00 | 0.939 | 0.965 |
Download Data |
Period Mean (original grids) [K] |
Model Period Mean (intersection) [K] |
Model Period Mean (complement) [K] |
Benchmark Period Mean (intersection) [K] |
Benchmark Period Mean (complement) [K] |
Bias [K] |
RMSE [K] |
Phase Shift [months] |
Bias Score [1] |
RMSE Score [1] |
Seasonal Cycle Score [1] |
Spatial Distribution Score [1] |
Interannual Variability Score [1] |
Overall Score [1] |
|||
|---|---|---|---|---|---|---|---|---|---|---|---|---|---|---|---|---|---|
| Benchmark | [-] | 299. | |||||||||||||||
| CLM5PHSOFF | [-] | 299. | 299. | 300. | 299. | 299. | 0.160 | 0.746 | 0.476 | 0.430 | 0.710 | 0.930 | 0.962 | 0.913 | 0.776 | ||
| CLM5PHSON | [-] | 299. | 299. | 300. | 299. | 299. | 0.226 | 0.750 | 0.486 | 0.425 | 0.725 | 0.930 | 0.963 | 0.913 | 0.780 |
Download Data |
Period Mean (original grids) [K] |
Model Period Mean (intersection) [K] |
Model Period Mean (complement) [K] |
Benchmark Period Mean (intersection) [K] |
Benchmark Period Mean (complement) [K] |
Bias [K] |
RMSE [K] |
Phase Shift [months] |
Bias Score [1] |
RMSE Score [1] |
Seasonal Cycle Score [1] |
Spatial Distribution Score [1] |
Interannual Variability Score [1] |
Overall Score [1] |
|||
|---|---|---|---|---|---|---|---|---|---|---|---|---|---|---|---|---|---|
| Benchmark | [-] | 271. | |||||||||||||||
| CLM5PHSOFF | [-] | 271. | 271. | 275. | 271. | 274. | -0.0455 | 0.709 | 0.00842 | 0.966 | 0.965 | 0.999 | 1.00 | 0.980 | 0.979 | ||
| CLM5PHSON | [-] | 271. | 271. | 275. | 271. | 274. | -0.0249 | 0.647 | 0.00842 | 0.966 | 0.971 | 0.999 | 1.00 | 0.979 | 0.981 |
Download Data |
Period Mean (original grids) [K] |
Model Period Mean (intersection) [K] |
Model Period Mean (complement) [K] |
Benchmark Period Mean (intersection) [K] |
Benchmark Period Mean (complement) [K] |
Bias [K] |
RMSE [K] |
Phase Shift [months] |
Bias Score [1] |
RMSE Score [1] |
Seasonal Cycle Score [1] |
Spatial Distribution Score [1] |
Interannual Variability Score [1] |
Overall Score [1] |
|||
|---|---|---|---|---|---|---|---|---|---|---|---|---|---|---|---|---|---|
| Benchmark | [-] | 280. | |||||||||||||||
| CLM5PHSOFF | [-] | 281. | 281. | 289. | 280. | 285. | 0.283 | 1.10 | 0.0208 | 0.900 | 0.956 | 0.999 | 1.00 | 0.966 | 0.963 | ||
| CLM5PHSON | [-] | 281. | 280. | 288. | 280. | 285. | 0.249 | 1.09 | 0.0222 | 0.901 | 0.956 | 0.998 | 1.00 | 0.965 | 0.963 |
Download Data |
Period Mean (original grids) [K] |
Model Period Mean (intersection) [K] |
Model Period Mean (complement) [K] |
Benchmark Period Mean (intersection) [K] |
Benchmark Period Mean (complement) [K] |
Bias [K] |
RMSE [K] |
Phase Shift [months] |
Bias Score [1] |
RMSE Score [1] |
Seasonal Cycle Score [1] |
Spatial Distribution Score [1] |
Interannual Variability Score [1] |
Overall Score [1] |
|||
|---|---|---|---|---|---|---|---|---|---|---|---|---|---|---|---|---|---|
| Benchmark | [-] | 297. | |||||||||||||||
| CLM5PHSOFF | [-] | 297. | 297. | 300. | 297. | 300. | 0.162 | 1.07 | 0.164 | 0.764 | 0.879 | 0.984 | 1.00 | 0.950 | 0.909 | ||
| CLM5PHSON | [-] | 297. | 297. | 300. | 297. | 300. | 0.110 | 1.08 | 0.181 | 0.766 | 0.877 | 0.983 | 1.00 | 0.946 | 0.908 |
Download Data |
Period Mean (original grids) [K] |
Model Period Mean (intersection) [K] |
Model Period Mean (complement) [K] |
Benchmark Period Mean (intersection) [K] |
Benchmark Period Mean (complement) [K] |
Bias [K] |
RMSE [K] |
Phase Shift [months] |
Bias Score [1] |
RMSE Score [1] |
Seasonal Cycle Score [1] |
Spatial Distribution Score [1] |
Interannual Variability Score [1] |
Overall Score [1] |
|||
|---|---|---|---|---|---|---|---|---|---|---|---|---|---|---|---|---|---|
| Benchmark | [-] | 264. | |||||||||||||||
| CLM5PHSOFF | [-] | 264. | 264. | 268. | 264. | 264. | 0.0749 | 0.718 | 0.0130 | 0.967 | 0.966 | 0.999 | 1.00 | 0.962 | 0.977 | ||
| CLM5PHSON | [-] | 264. | 264. | 267. | 264. | 264. | 0.0517 | 0.717 | 0.0135 | 0.967 | 0.966 | 0.999 | 1.00 | 0.963 | 0.977 |
Download Data |
Period Mean (original grids) [K] |
Model Period Mean (intersection) [K] |
Model Period Mean (complement) [K] |
Benchmark Period Mean (intersection) [K] |
Benchmark Period Mean (complement) [K] |
Bias [K] |
RMSE [K] |
Phase Shift [months] |
Bias Score [1] |
RMSE Score [1] |
Seasonal Cycle Score [1] |
Spatial Distribution Score [1] |
Interannual Variability Score [1] |
Overall Score [1] |
|||
|---|---|---|---|---|---|---|---|---|---|---|---|---|---|---|---|---|---|
| Benchmark | [-] | 295. | |||||||||||||||
| CLM5PHSOFF | [-] | 295. | 295. | 293. | 295. | 294. | 0.473 | 0.695 | 0.0952 | 0.877 | 0.927 | 0.993 | 1.00 | 0.969 | 0.949 | ||
| CLM5PHSON | [-] | 295. | 295. | 294. | 295. | 294. | 0.479 | 0.699 | 0.0807 | 0.876 | 0.929 | 0.994 | 1.00 | 0.969 | 0.950 |
Download Data |
Period Mean (original grids) [K] |
Model Period Mean (intersection) [K] |
Model Period Mean (complement) [K] |
Benchmark Period Mean (intersection) [K] |
Benchmark Period Mean (complement) [K] |
Bias [K] |
RMSE [K] |
Phase Shift [months] |
Bias Score [1] |
RMSE Score [1] |
Seasonal Cycle Score [1] |
Spatial Distribution Score [1] |
Interannual Variability Score [1] |
Overall Score [1] |
|||
|---|---|---|---|---|---|---|---|---|---|---|---|---|---|---|---|---|---|
| Benchmark | [-] | 282. | |||||||||||||||
| CLM5PHSOFF | [-] | 282. | 282. | 285. | 282. | 286. | 0.175 | 0.883 | 0.126 | 0.897 | 0.935 | 0.992 | 1.00 | 0.970 | 0.955 | ||
| CLM5PHSON | [-] | 282. | 282. | 284. | 282. | 286. | 0.117 | 0.866 | 0.145 | 0.899 | 0.936 | 0.990 | 1.00 | 0.970 | 0.955 |
Download Data |
Period Mean (original grids) [K] |
Model Period Mean (intersection) [K] |
Model Period Mean (complement) [K] |
Benchmark Period Mean (intersection) [K] |
Benchmark Period Mean (complement) [K] |
Bias [K] |
RMSE [K] |
Phase Shift [months] |
Bias Score [1] |
RMSE Score [1] |
Seasonal Cycle Score [1] |
Spatial Distribution Score [1] |
Interannual Variability Score [1] |
Overall Score [1] |
|||
|---|---|---|---|---|---|---|---|---|---|---|---|---|---|---|---|---|---|
| Benchmark | [-] | 287. | |||||||||||||||
| CLM5PHSOFF | [-] | 283. | 287. | 262. | 287. | 292. | 0.236 | 0.910 | 0.143 | 0.828 | 0.904 | 0.985 | 1.00 | 0.960 | 0.930 | ||
| CLM5PHSON | [-] | 283. | 287. | 249. | 287. | 292. | 0.227 | 0.898 | 0.137 | 0.829 | 0.907 | 0.986 | 1.00 | 0.959 | 0.931 |
Download Data |
Period Mean (original grids) [K] |
Model Period Mean (intersection) [K] |
Model Period Mean (complement) [K] |
Benchmark Period Mean (intersection) [K] |
Benchmark Period Mean (complement) [K] |
Bias [K] |
RMSE [K] |
Phase Shift [months] |
Bias Score [1] |
RMSE Score [1] |
Seasonal Cycle Score [1] |
Spatial Distribution Score [1] |
Interannual Variability Score [1] |
Overall Score [1] |
|||
|---|---|---|---|---|---|---|---|---|---|---|---|---|---|---|---|---|---|
| Benchmark | [-] | 296. | |||||||||||||||
| CLM5PHSOFF | [-] | 296. | 296. | 296. | 296. | 297. | 0.214 | 0.830 | 0.131 | 0.898 | 0.939 | 0.990 | 0.999 | 0.964 | 0.955 | ||
| CLM5PHSON | [-] | 296. | 296. | 296. | 296. | 297. | 0.191 | 0.824 | 0.134 | 0.898 | 0.939 | 0.990 | 0.999 | 0.963 | 0.955 |
Download Data |
Period Mean (original grids) [K] |
Model Period Mean (intersection) [K] |
Model Period Mean (complement) [K] |
Benchmark Period Mean (intersection) [K] |
Benchmark Period Mean (complement) [K] |
Bias [K] |
RMSE [K] |
Phase Shift [months] |
Bias Score [1] |
RMSE Score [1] |
Seasonal Cycle Score [1] |
Spatial Distribution Score [1] |
Interannual Variability Score [1] |
Overall Score [1] |
|||
|---|---|---|---|---|---|---|---|---|---|---|---|---|---|---|---|---|---|
| Benchmark | [-] | 265. | |||||||||||||||
| CLM5PHSOFF | [-] | 265. | 265. | 267. | 265. | 266. | 0.262 | 0.982 | 0.0180 | 0.944 | 0.951 | 0.999 | 1.00 | 0.958 | 0.967 | ||
| CLM5PHSON | [-] | 265. | 265. | 266. | 265. | 266. | 0.255 | 0.978 | 0.0188 | 0.944 | 0.951 | 0.999 | 1.00 | 0.959 | 0.967 |
Download Data |
Period Mean (original grids) [K] |
Model Period Mean (intersection) [K] |
Model Period Mean (complement) [K] |
Benchmark Period Mean (intersection) [K] |
Benchmark Period Mean (complement) [K] |
Bias [K] |
RMSE [K] |
Phase Shift [months] |
Bias Score [1] |
RMSE Score [1] |
Seasonal Cycle Score [1] |
Spatial Distribution Score [1] |
Interannual Variability Score [1] |
Overall Score [1] |
|||
|---|---|---|---|---|---|---|---|---|---|---|---|---|---|---|---|---|---|
| Benchmark | [-] | 296. | |||||||||||||||
| CLM5PHSOFF | [-] | 296. | 296. | 299. | 296. | 298. | 0.406 | 1.19 | 0.246 | 0.666 | 0.857 | 0.979 | 0.997 | 0.949 | 0.884 | ||
| CLM5PHSON | [-] | 296. | 295. | 298. | 296. | 298. | 0.401 | 1.19 | 0.241 | 0.667 | 0.862 | 0.979 | 0.997 | 0.945 | 0.885 |
Download Data |
Period Mean (original grids) [K] |
Model Period Mean (intersection) [K] |
Model Period Mean (complement) [K] |
Benchmark Period Mean (intersection) [K] |
Benchmark Period Mean (complement) [K] |
Bias [K] |
RMSE [K] |
Phase Shift [months] |
Bias Score [1] |
RMSE Score [1] |
Seasonal Cycle Score [1] |
Spatial Distribution Score [1] |
Interannual Variability Score [1] |
Overall Score [1] |
|||
|---|---|---|---|---|---|---|---|---|---|---|---|---|---|---|---|---|---|
| Benchmark | [-] | 286. | |||||||||||||||
| CLM5PHSOFF | [-] | 287. | 287. | 293. | 286. | 292. | 0.325 | 0.636 | 0.0307 | 0.940 | 0.958 | 0.998 | 1.00 | 0.974 | 0.971 | ||
| CLM5PHSON | [-] | 286. | 286. | 294. | 286. | 292. | 0.281 | 0.608 | 0.0307 | 0.942 | 0.960 | 0.998 | 1.00 | 0.973 | 0.972 |
Download Data |
Period Mean (original grids) [K] |
Model Period Mean (intersection) [K] |
Model Period Mean (complement) [K] |
Benchmark Period Mean (intersection) [K] |
Benchmark Period Mean (complement) [K] |
Bias [K] |
RMSE [K] |
Phase Shift [months] |
Bias Score [1] |
RMSE Score [1] |
Seasonal Cycle Score [1] |
Spatial Distribution Score [1] |
Interannual Variability Score [1] |
Overall Score [1] |
|||
|---|---|---|---|---|---|---|---|---|---|---|---|---|---|---|---|---|---|
| Benchmark | [-] | 275. | |||||||||||||||
| CLM5PHSOFF | [-] | 275. | 275. | 279. | 274. | 278. | 0.104 | 0.719 | 0.0418 | 0.943 | 0.955 | 0.997 | 0.999 | 0.972 | 0.970 | ||
| CLM5PHSON | [-] | 274. | 274. | 278. | 274. | 278. | 0.109 | 0.688 | 0.0418 | 0.943 | 0.959 | 0.997 | 0.999 | 0.972 | 0.971 |
Download Data |
Period Mean (original grids) [K] |
Model Period Mean (intersection) [K] |
Model Period Mean (complement) [K] |
Benchmark Period Mean (intersection) [K] |
Benchmark Period Mean (complement) [K] |
Bias [K] |
RMSE [K] |
Phase Shift [months] |
Bias Score [1] |
RMSE Score [1] |
Seasonal Cycle Score [1] |
Spatial Distribution Score [1] |
Interannual Variability Score [1] |
Overall Score [1] |
|||
|---|---|---|---|---|---|---|---|---|---|---|---|---|---|---|---|---|---|
| Benchmark | [-] | 284. | |||||||||||||||
| CLM5PHSOFF | [-] | 284. | 284. | 287. | 284. | 286. | 0.380 | 1.13 | 0.0293 | 0.879 | 0.933 | 0.998 | 1.00 | 0.964 | 0.951 | ||
| CLM5PHSON | [-] | 284. | 284. | 287. | 284. | 286. | 0.371 | 1.11 | 0.0268 | 0.879 | 0.936 | 0.998 | 1.00 | 0.963 | 0.952 |
Download Data |
Period Mean (original grids) [K] |
Model Period Mean (intersection) [K] |
Model Period Mean (complement) [K] |
Benchmark Period Mean (intersection) [K] |
Benchmark Period Mean (complement) [K] |
Bias [K] |
RMSE [K] |
Phase Shift [months] |
Bias Score [1] |
RMSE Score [1] |
Seasonal Cycle Score [1] |
Spatial Distribution Score [1] |
Interannual Variability Score [1] |
Overall Score [1] |
|||
|---|---|---|---|---|---|---|---|---|---|---|---|---|---|---|---|---|---|
| Benchmark | [-] | 299. | |||||||||||||||
| CLM5PHSOFF | [-] | 299. | 299. | 300. | 299. | 299. | 0.120 | 0.712 | 0.439 | 0.656 | 0.756 | 0.943 | 0.998 | 0.924 | 0.839 | ||
| CLM5PHSON | [-] | 299. | 299. | 300. | 299. | 299. | 0.168 | 0.688 | 0.391 | 0.654 | 0.785 | 0.948 | 0.999 | 0.925 | 0.849 |
Download Data |
Period Mean (original grids) [K] |
Model Period Mean (intersection) [K] |
Model Period Mean (complement) [K] |
Benchmark Period Mean (intersection) [K] |
Benchmark Period Mean (complement) [K] |
Bias [K] |
RMSE [K] |
Phase Shift [months] |
Bias Score [1] |
RMSE Score [1] |
Seasonal Cycle Score [1] |
Spatial Distribution Score [1] |
Interannual Variability Score [1] |
Overall Score [1] |
|||
|---|---|---|---|---|---|---|---|---|---|---|---|---|---|---|---|---|---|
| Benchmark | [-] | 296. | |||||||||||||||
| CLM5PHSOFF | [-] | 296. | 296. | 296. | 296. | 293. | 0.410 | 0.678 | 0.236 | 0.760 | 0.877 | 0.971 | 1.00 | 0.964 | 0.908 | ||
| CLM5PHSON | [-] | 296. | 296. | 296. | 296. | 293. | 0.383 | 0.666 | 0.220 | 0.763 | 0.880 | 0.973 | 1.00 | 0.963 | 0.910 |
Download Data |
Period Mean (original grids) [K] |
Model Period Mean (intersection) [K] |
Model Period Mean (complement) [K] |
Benchmark Period Mean (intersection) [K] |
Benchmark Period Mean (complement) [K] |
Bias [K] |
RMSE [K] |
Phase Shift [months] |
Bias Score [1] |
RMSE Score [1] |
Seasonal Cycle Score [1] |
Spatial Distribution Score [1] |
Interannual Variability Score [1] |
Overall Score [1] |
|||
|---|---|---|---|---|---|---|---|---|---|---|---|---|---|---|---|---|---|
| Benchmark | [-] | 284. | |||||||||||||||
| CLM5PHSOFF | [-] | 285. | 284. | 288. | 284. | 285. | 0.513 | 1.56 | 0.189 | 0.659 | 0.861 | 0.977 | 1.00 | 0.951 | 0.885 | ||
| CLM5PHSON | [-] | 285. | 284. | 288. | 284. | 285. | 0.483 | 1.54 | 0.183 | 0.661 | 0.862 | 0.977 | 1.00 | 0.952 | 0.886 |
Temporally integrated period mean