Mean State
Download Data |
Period Mean (original grids) [W/m2] |
Model Period Mean (intersection) [W/m2] |
Model Period Mean (complement) [W/m2] |
Benchmark Period Mean (intersection) [W/m2] |
Benchmark Period Mean (complement) [W/m2] |
Bias [W/m2] |
RMSE [W/m2] |
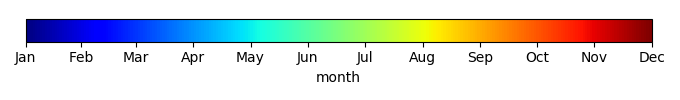
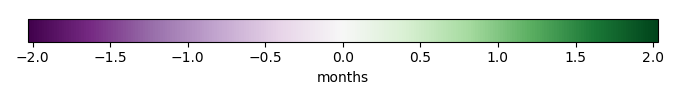
Phase Shift [months] |
Bias Score [1] |
RMSE Score [1] |
Seasonal Cycle Score [1] |
Spatial Distribution Score [1] |
Interannual Variability Score [1] |
Overall Score [1] |
|||
|---|---|---|---|---|---|---|---|---|---|---|---|---|---|---|---|---|---|
| Benchmark | [-] | 218. | |||||||||||||||
| CLM5PHSOFF | [-] | 216. | 215. | 218. | 219. | -2.67 | 17.1 | 0.845 | 0.743 | 0.489 | 0.903 | 0.937 | 0.819 | 0.730 | |||
| CLM5PHSON | [-] | 215. | 215. | 218. | 219. | -2.67 | 17.1 | 0.845 | 0.743 | 0.489 | 0.903 | 0.937 | 0.819 | 0.730 |
Download Data |
Period Mean (original grids) [W/m2] |
Model Period Mean (intersection) [W/m2] |
Model Period Mean (complement) [W/m2] |
Benchmark Period Mean (intersection) [W/m2] |
Benchmark Period Mean (complement) [W/m2] |
Bias [W/m2] |
RMSE [W/m2] |
Phase Shift [months] |
Bias Score [1] |
RMSE Score [1] |
Seasonal Cycle Score [1] |
Spatial Distribution Score [1] |
Interannual Variability Score [1] |
Overall Score [1] |
|||
|---|---|---|---|---|---|---|---|---|---|---|---|---|---|---|---|---|---|
| Benchmark | [-] | 243. | |||||||||||||||
| CLM5PHSOFF | [-] | 240. | 241. | 243. | 228. | -2.41 | 14.7 | 0.393 | 0.807 | 0.547 | 0.972 | 0.988 | 0.863 | 0.787 | |||
| CLM5PHSON | [-] | 240. | 241. | 243. | 228. | -2.41 | 14.7 | 0.393 | 0.807 | 0.547 | 0.972 | 0.988 | 0.863 | 0.787 |
Download Data |
Period Mean (original grids) [W/m2] |
Model Period Mean (intersection) [W/m2] |
Model Period Mean (complement) [W/m2] |
Benchmark Period Mean (intersection) [W/m2] |
Benchmark Period Mean (complement) [W/m2] |
Bias [W/m2] |
RMSE [W/m2] |
Phase Shift [months] |
Bias Score [1] |
RMSE Score [1] |
Seasonal Cycle Score [1] |
Spatial Distribution Score [1] |
Interannual Variability Score [1] |
Overall Score [1] |
|||
|---|---|---|---|---|---|---|---|---|---|---|---|---|---|---|---|---|---|
| Benchmark | [-] | 233. | |||||||||||||||
| CLM5PHSOFF | [-] | 232. | 232. | 233. | 234. | -0.710 | 16.8 | 0.786 | 0.840 | 0.570 | 0.897 | 0.981 | 0.756 | 0.769 | |||
| CLM5PHSON | [-] | 232. | 232. | 233. | 234. | -0.710 | 16.8 | 0.786 | 0.840 | 0.570 | 0.897 | 0.981 | 0.756 | 0.769 |
Download Data |
Period Mean (original grids) [W/m2] |
Model Period Mean (intersection) [W/m2] |
Model Period Mean (complement) [W/m2] |
Benchmark Period Mean (intersection) [W/m2] |
Benchmark Period Mean (complement) [W/m2] |
Bias [W/m2] |
RMSE [W/m2] |
Phase Shift [months] |
Bias Score [1] |
RMSE Score [1] |
Seasonal Cycle Score [1] |
Spatial Distribution Score [1] |
Interannual Variability Score [1] |
Overall Score [1] |
|||
|---|---|---|---|---|---|---|---|---|---|---|---|---|---|---|---|---|---|
| Benchmark | [-] | 111. | |||||||||||||||
| CLM5PHSOFF | [-] | 106. | 106. | 112. | 108. | -5.28 | 21.6 | 0.895 | 0.937 | 0.793 | 0.937 | 0.995 | 0.741 | 0.866 | |||
| CLM5PHSON | [-] | 106. | 107. | 112. | 108. | -5.28 | 21.6 | 0.895 | 0.937 | 0.793 | 0.937 | 0.995 | 0.741 | 0.866 |
Download Data |
Period Mean (original grids) [W/m2] |
Model Period Mean (intersection) [W/m2] |
Model Period Mean (complement) [W/m2] |
Benchmark Period Mean (intersection) [W/m2] |
Benchmark Period Mean (complement) [W/m2] |
Bias [W/m2] |
RMSE [W/m2] |
Phase Shift [months] |
Bias Score [1] |
RMSE Score [1] |
Seasonal Cycle Score [1] |
Spatial Distribution Score [1] |
Interannual Variability Score [1] |
Overall Score [1] |
|||
|---|---|---|---|---|---|---|---|---|---|---|---|---|---|---|---|---|---|
| Benchmark | [-] | 212. | |||||||||||||||
| CLM5PHSOFF | [-] | 208. | 207. | 209. | 219. | -2.31 | 17.6 | 1.09 | 0.708 | 0.437 | 0.829 | 0.964 | 0.778 | 0.692 | |||
| CLM5PHSON | [-] | 203. | 202. | 209. | 219. | -2.31 | 17.6 | 1.09 | 0.708 | 0.437 | 0.829 | 0.964 | 0.778 | 0.692 |
Download Data |
Period Mean (original grids) [W/m2] |
Model Period Mean (intersection) [W/m2] |
Model Period Mean (complement) [W/m2] |
Benchmark Period Mean (intersection) [W/m2] |
Benchmark Period Mean (complement) [W/m2] |
Bias [W/m2] |
RMSE [W/m2] |
Phase Shift [months] |
Bias Score [1] |
RMSE Score [1] |
Seasonal Cycle Score [1] |
Spatial Distribution Score [1] |
Interannual Variability Score [1] |
Overall Score [1] |
|||
|---|---|---|---|---|---|---|---|---|---|---|---|---|---|---|---|---|---|
| Benchmark | [-] | 126. | |||||||||||||||
| CLM5PHSOFF | [-] | 126. | 126. | 126. | 139. | -0.0545 | 14.7 | 0.342 | 0.956 | 0.833 | 0.972 | 0.964 | 0.643 | 0.867 | |||
| CLM5PHSON | [-] | 126. | 125. | 126. | 139. | -0.0545 | 14.7 | 0.342 | 0.956 | 0.833 | 0.972 | 0.964 | 0.643 | 0.867 |
Download Data |
Period Mean (original grids) [W/m2] |
Model Period Mean (intersection) [W/m2] |
Model Period Mean (complement) [W/m2] |
Benchmark Period Mean (intersection) [W/m2] |
Benchmark Period Mean (complement) [W/m2] |
Bias [W/m2] |
RMSE [W/m2] |
Phase Shift [months] |
Bias Score [1] |
RMSE Score [1] |
Seasonal Cycle Score [1] |
Spatial Distribution Score [1] |
Interannual Variability Score [1] |
Overall Score [1] |
|||
|---|---|---|---|---|---|---|---|---|---|---|---|---|---|---|---|---|---|
| Benchmark | [-] | 174. | |||||||||||||||
| CLM5PHSOFF | [-] | 170. | 170. | 175. | 164. | -4.69 | 17.9 | 0.365 | 0.868 | 0.775 | 0.969 | 0.977 | 0.625 | 0.832 | |||
| CLM5PHSON | [-] | 171. | 170. | 175. | 164. | -4.69 | 17.9 | 0.365 | 0.868 | 0.775 | 0.969 | 0.977 | 0.625 | 0.832 |
Download Data |
Period Mean (original grids) [W/m2] |
Model Period Mean (intersection) [W/m2] |
Model Period Mean (complement) [W/m2] |
Benchmark Period Mean (intersection) [W/m2] |
Benchmark Period Mean (complement) [W/m2] |
Bias [W/m2] |
RMSE [W/m2] |
Phase Shift [months] |
Bias Score [1] |
RMSE Score [1] |
Seasonal Cycle Score [1] |
Spatial Distribution Score [1] |
Interannual Variability Score [1] |
Overall Score [1] |
|||
|---|---|---|---|---|---|---|---|---|---|---|---|---|---|---|---|---|---|
| Benchmark | [-] | 210. | |||||||||||||||
| CLM5PHSOFF | [-] | 208. | 208. | 210. | 218. | -1.45 | 19.3 | 0.328 | 0.807 | 0.623 | 0.973 | 0.937 | 0.745 | 0.784 | |||
| CLM5PHSON | [-] | 207. | 207. | 210. | 218. | -1.45 | 19.3 | 0.328 | 0.807 | 0.623 | 0.973 | 0.937 | 0.745 | 0.784 |
Download Data |
Period Mean (original grids) [W/m2] |
Model Period Mean (intersection) [W/m2] |
Model Period Mean (complement) [W/m2] |
Benchmark Period Mean (intersection) [W/m2] |
Benchmark Period Mean (complement) [W/m2] |
Bias [W/m2] |
RMSE [W/m2] |
Phase Shift [months] |
Bias Score [1] |
RMSE Score [1] |
Seasonal Cycle Score [1] |
Spatial Distribution Score [1] |
Interannual Variability Score [1] |
Overall Score [1] |
|||
|---|---|---|---|---|---|---|---|---|---|---|---|---|---|---|---|---|---|
| Benchmark | [-] | 98.9 | |||||||||||||||
| CLM5PHSOFF | [-] | 95.4 | 95.6 | 99.3 | 90.5 | -3.59 | 20.4 | 0.692 | 0.950 | 0.806 | 0.953 | 0.886 | 0.671 | 0.845 | |||
| CLM5PHSON | [-] | 96.0 | 96.3 | 99.3 | 90.5 | -3.59 | 20.4 | 0.692 | 0.950 | 0.806 | 0.953 | 0.886 | 0.671 | 0.845 |
Download Data |
Period Mean (original grids) [W/m2] |
Model Period Mean (intersection) [W/m2] |
Model Period Mean (complement) [W/m2] |
Benchmark Period Mean (intersection) [W/m2] |
Benchmark Period Mean (complement) [W/m2] |
Bias [W/m2] |
RMSE [W/m2] |
Phase Shift [months] |
Bias Score [1] |
RMSE Score [1] |
Seasonal Cycle Score [1] |
Spatial Distribution Score [1] |
Interannual Variability Score [1] |
Overall Score [1] |
|||
|---|---|---|---|---|---|---|---|---|---|---|---|---|---|---|---|---|---|
| Benchmark | [-] | 235. | |||||||||||||||
| CLM5PHSOFF | [-] | 229. | 229. | 237. | 210. | -7.53 | 17.8 | 0.369 | 0.855 | 0.773 | 0.971 | 0.996 | 0.727 | 0.849 | |||
| CLM5PHSON | [-] | 231. | 231. | 237. | 210. | -7.53 | 17.8 | 0.369 | 0.855 | 0.773 | 0.971 | 0.996 | 0.727 | 0.849 |
Download Data |
Period Mean (original grids) [W/m2] |
Model Period Mean (intersection) [W/m2] |
Model Period Mean (complement) [W/m2] |
Benchmark Period Mean (intersection) [W/m2] |
Benchmark Period Mean (complement) [W/m2] |
Bias [W/m2] |
RMSE [W/m2] |
Phase Shift [months] |
Bias Score [1] |
RMSE Score [1] |
Seasonal Cycle Score [1] |
Spatial Distribution Score [1] |
Interannual Variability Score [1] |
Overall Score [1] |
|||
|---|---|---|---|---|---|---|---|---|---|---|---|---|---|---|---|---|---|
| Benchmark | [-] | 140. | |||||||||||||||
| CLM5PHSOFF | [-] | 138. | 138. | 138. | 155. | -0.611 | 14.4 | 0.228 | 0.939 | 0.844 | 0.985 | 0.998 | 0.646 | 0.876 | |||
| CLM5PHSON | [-] | 135. | 135. | 138. | 155. | -0.611 | 14.4 | 0.228 | 0.939 | 0.844 | 0.985 | 0.998 | 0.646 | 0.876 |
Download Data |
Period Mean (original grids) [W/m2] |
Model Period Mean (intersection) [W/m2] |
Model Period Mean (complement) [W/m2] |
Benchmark Period Mean (intersection) [W/m2] |
Benchmark Period Mean (complement) [W/m2] |
Bias [W/m2] |
RMSE [W/m2] |
Phase Shift [months] |
Bias Score [1] |
RMSE Score [1] |
Seasonal Cycle Score [1] |
Spatial Distribution Score [1] |
Interannual Variability Score [1] |
Overall Score [1] |
|||
|---|---|---|---|---|---|---|---|---|---|---|---|---|---|---|---|---|---|
| Benchmark | [-] | 187. | |||||||||||||||
| CLM5PHSOFF | [-] | 181. | 181. | 186. | 187. | -5.34 | 18.5 | 0.425 | 0.855 | 0.726 | 0.958 | 0.998 | 0.726 | 0.831 | |||
| CLM5PHSON | [-] | 182. | 182. | 186. | 187. | -5.34 | 18.5 | 0.425 | 0.855 | 0.726 | 0.958 | 0.998 | 0.726 | 0.831 |
Download Data |
Period Mean (original grids) [W/m2] |
Model Period Mean (intersection) [W/m2] |
Model Period Mean (complement) [W/m2] |
Benchmark Period Mean (intersection) [W/m2] |
Benchmark Period Mean (complement) [W/m2] |
Bias [W/m2] |
RMSE [W/m2] |
Phase Shift [months] |
Bias Score [1] |
RMSE Score [1] |
Seasonal Cycle Score [1] |
Spatial Distribution Score [1] |
Interannual Variability Score [1] |
Overall Score [1] |
|||
|---|---|---|---|---|---|---|---|---|---|---|---|---|---|---|---|---|---|
| Benchmark | [-] | 249. | |||||||||||||||
| CLM5PHSOFF | [-] | 240. | 240. | 250. | 234. | -10.3 | 17.6 | 0.354 | 0.803 | 0.771 | 0.971 | 0.999 | 0.707 | 0.837 | |||
| CLM5PHSON | [-] | 240. | 240. | 250. | 234. | -10.3 | 17.6 | 0.354 | 0.803 | 0.771 | 0.971 | 0.999 | 0.707 | 0.837 |
Download Data |
Period Mean (original grids) [W/m2] |
Model Period Mean (intersection) [W/m2] |
Model Period Mean (complement) [W/m2] |
Benchmark Period Mean (intersection) [W/m2] |
Benchmark Period Mean (complement) [W/m2] |
Bias [W/m2] |
RMSE [W/m2] |
Phase Shift [months] |
Bias Score [1] |
RMSE Score [1] |
Seasonal Cycle Score [1] |
Spatial Distribution Score [1] |
Interannual Variability Score [1] |
Overall Score [1] |
|||
|---|---|---|---|---|---|---|---|---|---|---|---|---|---|---|---|---|---|
| Benchmark | [-] | 116. | |||||||||||||||
| CLM5PHSOFF | [-] | 108. | 107. | 116. | 114. | -8.44 | 23.8 | 0.659 | 0.913 | 0.791 | 0.949 | 0.991 | 0.752 | 0.865 | |||
| CLM5PHSON | [-] | 108. | 108. | 116. | 114. | -8.44 | 23.8 | 0.659 | 0.913 | 0.791 | 0.949 | 0.991 | 0.752 | 0.865 |
Download Data |
Period Mean (original grids) [W/m2] |
Model Period Mean (intersection) [W/m2] |
Model Period Mean (complement) [W/m2] |
Benchmark Period Mean (intersection) [W/m2] |
Benchmark Period Mean (complement) [W/m2] |
Bias [W/m2] |
RMSE [W/m2] |
Phase Shift [months] |
Bias Score [1] |
RMSE Score [1] |
Seasonal Cycle Score [1] |
Spatial Distribution Score [1] |
Interannual Variability Score [1] |
Overall Score [1] |
|||
|---|---|---|---|---|---|---|---|---|---|---|---|---|---|---|---|---|---|
| Benchmark | [-] | 230. | |||||||||||||||
| CLM5PHSOFF | [-] | 227. | 227. | 229. | 232. | -2.36 | 17.1 | 0.281 | 0.809 | 0.688 | 0.971 | 0.995 | 0.768 | 0.820 | |||
| CLM5PHSON | [-] | 225. | 226. | 229. | 232. | -2.36 | 17.1 | 0.281 | 0.809 | 0.688 | 0.971 | 0.995 | 0.768 | 0.820 |
Download Data |
Period Mean (original grids) [W/m2] |
Model Period Mean (intersection) [W/m2] |
Model Period Mean (complement) [W/m2] |
Benchmark Period Mean (intersection) [W/m2] |
Benchmark Period Mean (complement) [W/m2] |
Bias [W/m2] |
RMSE [W/m2] |
Phase Shift [months] |
Bias Score [1] |
RMSE Score [1] |
Seasonal Cycle Score [1] |
Spatial Distribution Score [1] |
Interannual Variability Score [1] |
Overall Score [1] |
|||
|---|---|---|---|---|---|---|---|---|---|---|---|---|---|---|---|---|---|
| Benchmark | [-] | 177. | |||||||||||||||
| CLM5PHSOFF | [-] | 174. | 173. | 176. | 204. | -2.36 | 14.9 | 0.261 | 0.946 | 0.798 | 0.983 | 0.996 | 0.649 | 0.862 | |||
| CLM5PHSON | [-] | 172. | 172. | 176. | 204. | -2.36 | 14.9 | 0.261 | 0.946 | 0.798 | 0.983 | 0.996 | 0.649 | 0.862 |
Download Data |
Period Mean (original grids) [W/m2] |
Model Period Mean (intersection) [W/m2] |
Model Period Mean (complement) [W/m2] |
Benchmark Period Mean (intersection) [W/m2] |
Benchmark Period Mean (complement) [W/m2] |
Bias [W/m2] |
RMSE [W/m2] |
Phase Shift [months] |
Bias Score [1] |
RMSE Score [1] |
Seasonal Cycle Score [1] |
Spatial Distribution Score [1] |
Interannual Variability Score [1] |
Overall Score [1] |
|||
|---|---|---|---|---|---|---|---|---|---|---|---|---|---|---|---|---|---|
| Benchmark | [-] | 136. | |||||||||||||||
| CLM5PHSOFF | [-] | 135. | 135. | 137. | 128. | -1.63 | 14.4 | 0.185 | 0.953 | 0.836 | 0.987 | 0.997 | 0.652 | 0.877 | |||
| CLM5PHSON | [-] | 135. | 135. | 137. | 128. | -1.63 | 14.4 | 0.185 | 0.953 | 0.836 | 0.987 | 0.997 | 0.652 | 0.877 |
Download Data |
Period Mean (original grids) [W/m2] |
Model Period Mean (intersection) [W/m2] |
Model Period Mean (complement) [W/m2] |
Benchmark Period Mean (intersection) [W/m2] |
Benchmark Period Mean (complement) [W/m2] |
Bias [W/m2] |
RMSE [W/m2] |
Phase Shift [months] |
Bias Score [1] |
RMSE Score [1] |
Seasonal Cycle Score [1] |
Spatial Distribution Score [1] |
Interannual Variability Score [1] |
Overall Score [1] |
|||
|---|---|---|---|---|---|---|---|---|---|---|---|---|---|---|---|---|---|
| Benchmark | [-] | 199. | |||||||||||||||
| CLM5PHSOFF | [-] | 194. | 194. | 200. | 176. | -5.87 | 15.0 | 0.152 | 0.915 | 0.841 | 0.990 | 0.982 | 0.679 | 0.874 | |||
| CLM5PHSON | [-] | 194. | 194. | 200. | 176. | -5.87 | 15.0 | 0.152 | 0.915 | 0.841 | 0.990 | 0.982 | 0.679 | 0.874 |
Download Data |
Period Mean (original grids) [W/m2] |
Model Period Mean (intersection) [W/m2] |
Model Period Mean (complement) [W/m2] |
Benchmark Period Mean (intersection) [W/m2] |
Benchmark Period Mean (complement) [W/m2] |
Bias [W/m2] |
RMSE [W/m2] |
Phase Shift [months] |
Bias Score [1] |
RMSE Score [1] |
Seasonal Cycle Score [1] |
Spatial Distribution Score [1] |
Interannual Variability Score [1] |
Overall Score [1] |
|||
|---|---|---|---|---|---|---|---|---|---|---|---|---|---|---|---|---|---|
| Benchmark | [-] | 206. | |||||||||||||||
| CLM5PHSOFF | [-] | 201. | 201. | 206. | 229. | -4.44 | 16.2 | 0.734 | 0.705 | 0.471 | 0.906 | 0.999 | 0.806 | 0.726 | |||
| CLM5PHSON | [-] | 200. | 200. | 206. | 229. | -4.44 | 16.2 | 0.734 | 0.705 | 0.471 | 0.906 | 0.999 | 0.806 | 0.726 |
Download Data |
Period Mean (original grids) [W/m2] |
Model Period Mean (intersection) [W/m2] |
Model Period Mean (complement) [W/m2] |
Benchmark Period Mean (intersection) [W/m2] |
Benchmark Period Mean (complement) [W/m2] |
Bias [W/m2] |
RMSE [W/m2] |
Phase Shift [months] |
Bias Score [1] |
RMSE Score [1] |
Seasonal Cycle Score [1] |
Spatial Distribution Score [1] |
Interannual Variability Score [1] |
Overall Score [1] |
|||
|---|---|---|---|---|---|---|---|---|---|---|---|---|---|---|---|---|---|
| Benchmark | [-] | 216. | |||||||||||||||
| CLM5PHSOFF | [-] | 211. | 211. | 216. | 214. | -4.62 | 18.2 | 0.768 | 0.823 | 0.641 | 0.903 | 0.991 | 0.711 | 0.785 | |||
| CLM5PHSON | [-] | 211. | 211. | 216. | 214. | -4.62 | 18.2 | 0.768 | 0.823 | 0.641 | 0.903 | 0.991 | 0.711 | 0.785 |
Download Data |
Period Mean (original grids) [W/m2] |
Model Period Mean (intersection) [W/m2] |
Model Period Mean (complement) [W/m2] |
Benchmark Period Mean (intersection) [W/m2] |
Benchmark Period Mean (complement) [W/m2] |
Bias [W/m2] |
RMSE [W/m2] |
Phase Shift [months] |
Bias Score [1] |
RMSE Score [1] |
Seasonal Cycle Score [1] |
Spatial Distribution Score [1] |
Interannual Variability Score [1] |
Overall Score [1] |
|||
|---|---|---|---|---|---|---|---|---|---|---|---|---|---|---|---|---|---|
| Benchmark | [-] | 208. | |||||||||||||||
| CLM5PHSOFF | [-] | 206. | 204. | 211. | 183. | -7.33 | 23.1 | 0.365 | 0.791 | 0.729 | 0.961 | 0.997 | 0.704 | 0.818 | |||
| CLM5PHSON | [-] | 209. | 208. | 211. | 183. | -7.33 | 23.1 | 0.365 | 0.791 | 0.729 | 0.961 | 0.997 | 0.704 | 0.818 |
Temporally integrated period mean