Mean State
Download Data |
Period Mean (original grids) [Pg] |
Model Period Mean (intersection) [Pg] |
Model Period Mean (complement) [Pg] |
Benchmark Period Mean (intersection) [Pg] |
Benchmark Period Mean (complement) [Pg] |
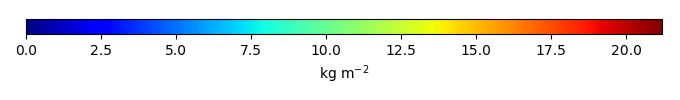
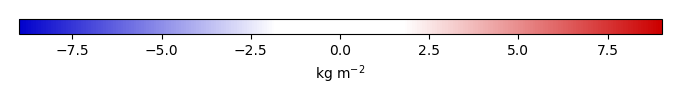
Bias [kg m-2] |
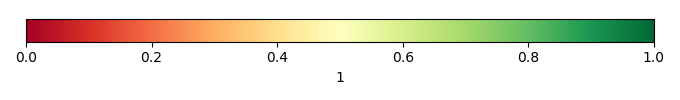
Bias Score [1] |
Spatial Distribution Score [1] |
Overall Score [1] |
|||
|---|---|---|---|---|---|---|---|---|---|---|---|---|
| Benchmark | [-] | 38.7 | ||||||||||
| CON | [-] | 39.2 | 36.9 | 0.623 | 38.7 | 0.000568 | 0.0835 | 0.760 | 0.942 | 0.851 | ||
| OP | [-] | 39.6 | 37.2 | 0.626 | 38.7 | 0.000568 | 0.160 | 0.758 | 0.940 | 0.849 |
Download Data |
Period Mean (original grids) [Pg] |
Model Period Mean (intersection) [Pg] |
Model Period Mean (complement) [Pg] |
Benchmark Period Mean (intersection) [Pg] |
Benchmark Period Mean (complement) [Pg] |
Bias [kg m-2] |
Bias Score [1] |
Spatial Distribution Score [1] |
Overall Score [1] |
|||
|---|---|---|---|---|---|---|---|---|---|---|---|---|
| Benchmark | [-] | 11.9 | ||||||||||
| CON | [-] | 2.11 | 3.20 | 0.0771 | 11.9 | 0.000887 | -1.28 | 0.453 | 0.714 | 0.583 | ||
| OP | [-] | 2.13 | 3.24 | 0.0773 | 11.9 | 0.000887 | -1.27 | 0.454 | 0.719 | 0.587 |
Download Data |
Period Mean (original grids) [Pg] |
Model Period Mean (intersection) [Pg] |
Model Period Mean (complement) [Pg] |
Benchmark Period Mean (intersection) [Pg] |
Benchmark Period Mean (complement) [Pg] |
Bias [kg m-2] |
Bias Score [1] |
Spatial Distribution Score [1] |
Overall Score [1] |
|||
|---|---|---|---|---|---|---|---|---|---|---|---|---|
| Benchmark | [-] | 24.6 | ||||||||||
| CON | [-] | 14.1 | 13.4 | 0.714 | 24.5 | 0.0133 | -0.926 | 0.521 | 0.787 | 0.654 | ||
| OP | [-] | 14.3 | 13.6 | 0.719 | 24.5 | 0.0133 | -0.906 | 0.522 | 0.785 | 0.653 |
Download Data |
Period Mean (original grids) [Pg] |
Model Period Mean (intersection) [Pg] |
Model Period Mean (complement) [Pg] |
Benchmark Period Mean (intersection) [Pg] |
Benchmark Period Mean (complement) [Pg] |
Bias [kg m-2] |
Bias Score [1] |
Spatial Distribution Score [1] |
Overall Score [1] |
|||
|---|---|---|---|---|---|---|---|---|---|---|---|---|
| Benchmark | [-] | 36.8 | ||||||||||
| CON | [-] | 39.1 | 34.2 | 3.58 | 36.4 | 0.356 | 5.77 | 0.707 | 0.888 | 0.798 | ||
| OP | [-] | 39.3 | 34.4 | 3.61 | 36.4 | 0.356 | 5.88 | 0.705 | 0.890 | 0.798 |
Download Data |
Period Mean (original grids) [Pg] |
Model Period Mean (intersection) [Pg] |
Model Period Mean (complement) [Pg] |
Benchmark Period Mean (intersection) [Pg] |
Benchmark Period Mean (complement) [Pg] |
Bias [kg m-2] |
Bias Score [1] |
Spatial Distribution Score [1] |
Overall Score [1] |
|||
|---|---|---|---|---|---|---|---|---|---|---|---|---|
| Benchmark | [-] | 38.4 | ||||||||||
| CON | [-] | 33.5 | 23.5 | 10.4 | 38.3 | 0.0457 | -1.30 | 0.596 | 0.815 | 0.706 | ||
| OP | [-] | 33.9 | 23.7 | 10.5 | 38.3 | 0.0457 | -1.27 | 0.597 | 0.812 | 0.704 |
Download Data |
Period Mean (original grids) [Pg] |
Model Period Mean (intersection) [Pg] |
Model Period Mean (complement) [Pg] |
Benchmark Period Mean (intersection) [Pg] |
Benchmark Period Mean (complement) [Pg] |
Bias [kg m-2] |
Bias Score [1] |
Spatial Distribution Score [1] |
Overall Score [1] |
|||
|---|---|---|---|---|---|---|---|---|---|---|---|---|
| Benchmark | [-] | 43.7 | ||||||||||
| CON | [-] | 26.2 | 23.1 | 1.33 | 43.7 | 0.0383 | -1.63 | 0.609 | 0.889 | 0.749 | ||
| OP | [-] | 26.4 | 23.3 | 1.34 | 43.7 | 0.0383 | -1.60 | 0.610 | 0.889 | 0.750 |
Download Data |
Period Mean (original grids) [Pg] |
Model Period Mean (intersection) [Pg] |
Model Period Mean (complement) [Pg] |
Benchmark Period Mean (intersection) [Pg] |
Benchmark Period Mean (complement) [Pg] |
Bias [kg m-2] |
Bias Score [1] |
Spatial Distribution Score [1] |
Overall Score [1] |
|||
|---|---|---|---|---|---|---|---|---|---|---|---|---|
| Benchmark | [-] | 13.7 | ||||||||||
| CON | [-] | 11.1 | 3.44 | 7.06 | 13.6 | 0.0402 | -1.40 | 0.444 | 0.672 | 0.558 | ||
| OP | [-] | 11.2 | 3.47 | 7.11 | 13.6 | 0.0402 | -1.39 | 0.444 | 0.668 | 0.556 |
Download Data |
Period Mean (original grids) [Pg] |
Model Period Mean (intersection) [Pg] |
Model Period Mean (complement) [Pg] |
Benchmark Period Mean (intersection) [Pg] |
Benchmark Period Mean (complement) [Pg] |
Bias [kg m-2] |
Bias Score [1] |
Spatial Distribution Score [1] |
Overall Score [1] |
|||
|---|---|---|---|---|---|---|---|---|---|---|---|---|
| Benchmark | [-] | 352. | ||||||||||
| CON | [-] | 502. | 305. | 196. | 349. | 2.09 | 0.308 | 0.637 | 0.851 | 0.744 | ||
| OP | [-] | 506. | 308. | 198. | 349. | 2.09 | 0.348 | 0.636 | 0.849 | 0.742 |
Download Data |
Period Mean (original grids) [Pg] |
Model Period Mean (intersection) [Pg] |
Model Period Mean (complement) [Pg] |
Benchmark Period Mean (intersection) [Pg] |
Benchmark Period Mean (complement) [Pg] |
Bias [kg m-2] |
Bias Score [1] |
Spatial Distribution Score [1] |
Overall Score [1] |
|||
|---|---|---|---|---|---|---|---|---|---|---|---|---|
| Benchmark | [-] | 2.53 | ||||||||||
| CON | [-] | 1.79 | 0.213 | 1.50 | 2.53 | 5.07e-05 | -0.992 | 0.395 | 0.0188 | 0.207 | ||
| OP | [-] | 1.81 | 0.214 | 1.52 | 2.53 | 5.07e-05 | -0.992 | 0.395 | 0.0193 | 0.207 |
Download Data |
Period Mean (original grids) [Pg] |
Model Period Mean (intersection) [Pg] |
Model Period Mean (complement) [Pg] |
Benchmark Period Mean (intersection) [Pg] |
Benchmark Period Mean (complement) [Pg] |
Bias [kg m-2] |
Bias Score [1] |
Spatial Distribution Score [1] |
Overall Score [1] |
|||
|---|---|---|---|---|---|---|---|---|---|---|---|---|
| Benchmark | [-] | 11.1 | ||||||||||
| CON | [-] | 10.3 | 8.42 | 1.17 | 11.0 | 0.0920 | 0.938 | 0.618 | 0.832 | 0.725 | ||
| OP | [-] | 10.4 | 8.51 | 1.18 | 11.0 | 0.0920 | 0.978 | 0.618 | 0.829 | 0.723 |
Download Data |
Period Mean (original grids) [Pg] |
Model Period Mean (intersection) [Pg] |
Model Period Mean (complement) [Pg] |
Benchmark Period Mean (intersection) [Pg] |
Benchmark Period Mean (complement) [Pg] |
Bias [kg m-2] |
Bias Score [1] |
Spatial Distribution Score [1] |
Overall Score [1] |
|||
|---|---|---|---|---|---|---|---|---|---|---|---|---|
| Benchmark | [-] | 1.55 | ||||||||||
| CON | [-] | 12.3 | 1.21 | 10.9 | 1.54 | 0.00901 | 0.501 | 0.582 | 0.713 | 0.648 | ||
| OP | [-] | 12.5 | 1.23 | 11.0 | 1.54 | 0.00901 | 0.531 | 0.583 | 0.709 | 0.646 |
Download Data |
Period Mean (original grids) [Pg] |
Model Period Mean (intersection) [Pg] |
Model Period Mean (complement) [Pg] |
Benchmark Period Mean (intersection) [Pg] |
Benchmark Period Mean (complement) [Pg] |
Bias [kg m-2] |
Bias Score [1] |
Spatial Distribution Score [1] |
Overall Score [1] |
|||
|---|---|---|---|---|---|---|---|---|---|---|---|---|
| Benchmark | [-] | 0.219 | ||||||||||
| CON | [-] | 3.31 | 0.0971 | 3.36 | 0.219 | -0.366 | 0.477 | 0.139 | 0.308 | |||
| OP | [-] | 3.35 | 0.0974 | 3.40 | 0.219 | -0.365 | 0.477 | 0.146 | 0.311 |
Download Data |
Period Mean (original grids) [Pg] |
Model Period Mean (intersection) [Pg] |
Model Period Mean (complement) [Pg] |
Benchmark Period Mean (intersection) [Pg] |
Benchmark Period Mean (complement) [Pg] |
Bias [kg m-2] |
Bias Score [1] |
Spatial Distribution Score [1] |
Overall Score [1] |
|||
|---|---|---|---|---|---|---|---|---|---|---|---|---|
| Benchmark | [-] | 100. | ||||||||||
| CON | [-] | 127. | 126. | 0.874 | 100. | 0.0486 | 3.64 | 0.710 | 0.929 | 0.819 | ||
| OP | [-] | 128. | 127. | 0.879 | 100. | 0.0486 | 3.75 | 0.707 | 0.927 | 0.817 |
Download Data |
Period Mean (original grids) [Pg] |
Model Period Mean (intersection) [Pg] |
Model Period Mean (complement) [Pg] |
Benchmark Period Mean (intersection) [Pg] |
Benchmark Period Mean (complement) [Pg] |
Bias [kg m-2] |
Bias Score [1] |
Spatial Distribution Score [1] |
Overall Score [1] |
|||
|---|---|---|---|---|---|---|---|---|---|---|---|---|
| Benchmark | [-] | 18.4 | ||||||||||
| CON | [-] | 23.4 | 22.4 | 0.407 | 18.4 | 0.0435 | 0.885 | 0.528 | 0.599 | 0.564 | ||
| OP | [-] | 23.5 | 22.6 | 0.409 | 18.4 | 0.0435 | 0.914 | 0.527 | 0.595 | 0.561 |
Download Data |
Period Mean (original grids) [Pg] |
Model Period Mean (intersection) [Pg] |
Model Period Mean (complement) [Pg] |
Benchmark Period Mean (intersection) [Pg] |
Benchmark Period Mean (complement) [Pg] |
Bias [kg m-2] |
Bias Score [1] |
Spatial Distribution Score [1] |
Overall Score [1] |
|||
|---|---|---|---|---|---|---|---|---|---|---|---|---|
| Benchmark | [-] | 7.28 | ||||||||||
| CON | [-] | 8.02 | 7.25 | 0.165 | 7.14 | 0.137 | 0.780 | 0.541 | 0.556 | 0.549 | ||
| OP | [-] | 8.09 | 7.31 | 0.166 | 7.14 | 0.137 | 0.803 | 0.540 | 0.553 | 0.546 |
Temporally integrated period mean