Mean State
Download Data |
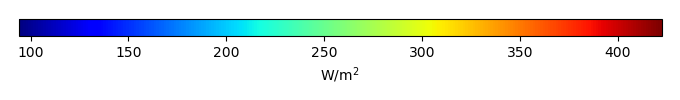
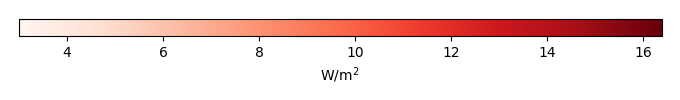
Period Mean (original grids) [W/m2] |
Model Period Mean (intersection) [W/m2] |
Model Period Mean (complement) [W/m2] |
Benchmark Period Mean (intersection) [W/m2] |
Benchmark Period Mean (complement) [W/m2] |
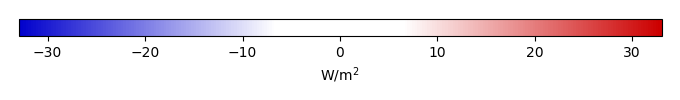
Bias [W/m2] |
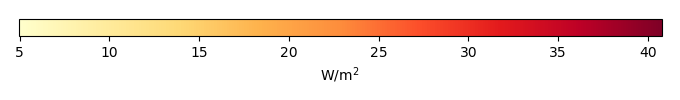
RMSE [W/m2] |
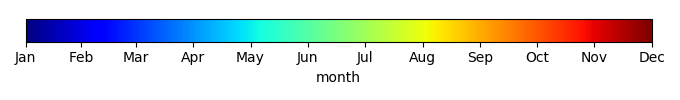
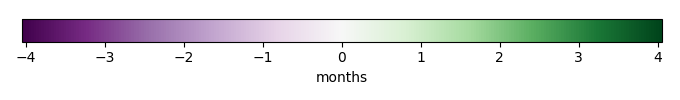
Phase Shift [months] |
Bias Score [1] |
RMSE Score [1] |
Seasonal Cycle Score [1] |
Spatial Distribution Score [1] |
Interannual Variability Score [1] |
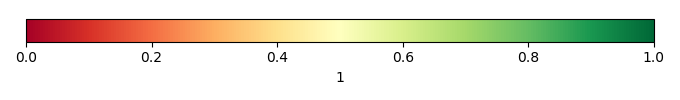
Overall Score [1] |
|||
|---|---|---|---|---|---|---|---|---|---|---|---|---|---|---|---|---|---|
| Benchmark | [-] | 401. | |||||||||||||||
| CON | [-] | 398. | 398. | 400. | 415. | -1.49 | 10.1 | 1.81 | 0.486 | 0.386 | 0.732 | 0.939 | 0.653 | 0.597 | |||
| OP | [-] | 398. | 398. | 400. | 415. | -1.49 | 10.1 | 1.81 | 0.486 | 0.386 | 0.732 | 0.939 | 0.653 | 0.597 |
Download Data |
Period Mean (original grids) [W/m2] |
Model Period Mean (intersection) [W/m2] |
Model Period Mean (complement) [W/m2] |
Benchmark Period Mean (intersection) [W/m2] |
Benchmark Period Mean (complement) [W/m2] |
Bias [W/m2] |
RMSE [W/m2] |
Phase Shift [months] |
Bias Score [1] |
RMSE Score [1] |
Seasonal Cycle Score [1] |
Spatial Distribution Score [1] |
Interannual Variability Score [1] |
Overall Score [1] |
|||
|---|---|---|---|---|---|---|---|---|---|---|---|---|---|---|---|---|---|
| Benchmark | [-] | 391. | |||||||||||||||
| CON | [-] | 385. | 386. | 391. | 413. | -4.90 | 13.3 | 0.514 | 0.710 | 0.654 | 0.947 | 0.914 | 0.719 | 0.766 | |||
| OP | [-] | 385. | 386. | 391. | 413. | -4.90 | 13.3 | 0.514 | 0.710 | 0.654 | 0.947 | 0.914 | 0.719 | 0.766 |
Download Data |
Period Mean (original grids) [W/m2] |
Model Period Mean (intersection) [W/m2] |
Model Period Mean (complement) [W/m2] |
Benchmark Period Mean (intersection) [W/m2] |
Benchmark Period Mean (complement) [W/m2] |
Bias [W/m2] |
RMSE [W/m2] |
Phase Shift [months] |
Bias Score [1] |
RMSE Score [1] |
Seasonal Cycle Score [1] |
Spatial Distribution Score [1] |
Interannual Variability Score [1] |
Overall Score [1] |
|||
|---|---|---|---|---|---|---|---|---|---|---|---|---|---|---|---|---|---|
| Benchmark | [-] | 367. | |||||||||||||||
| CON | [-] | 361. | 361. | 366. | 383. | -2.74 | 12.8 | 0.891 | 0.697 | 0.622 | 0.888 | 0.995 | 0.752 | 0.762 | |||
| OP | [-] | 361. | 361. | 366. | 383. | -2.74 | 12.8 | 0.891 | 0.697 | 0.622 | 0.888 | 0.995 | 0.752 | 0.762 |
Download Data |
Period Mean (original grids) [W/m2] |
Model Period Mean (intersection) [W/m2] |
Model Period Mean (complement) [W/m2] |
Benchmark Period Mean (intersection) [W/m2] |
Benchmark Period Mean (complement) [W/m2] |
Bias [W/m2] |
RMSE [W/m2] |
Phase Shift [months] |
Bias Score [1] |
RMSE Score [1] |
Seasonal Cycle Score [1] |
Spatial Distribution Score [1] |
Interannual Variability Score [1] |
Overall Score [1] |
|||
|---|---|---|---|---|---|---|---|---|---|---|---|---|---|---|---|---|---|
| Benchmark | [-] | 243. | |||||||||||||||
| CON | [-] | 237. | 237. | 242. | 256. | -2.41 | 14.2 | 0.155 | 0.915 | 0.798 | 0.990 | 0.997 | 0.890 | 0.898 | |||
| OP | [-] | 237. | 237. | 242. | 256. | -2.41 | 14.2 | 0.155 | 0.915 | 0.798 | 0.990 | 0.997 | 0.890 | 0.898 |
Download Data |
Period Mean (original grids) [W/m2] |
Model Period Mean (intersection) [W/m2] |
Model Period Mean (complement) [W/m2] |
Benchmark Period Mean (intersection) [W/m2] |
Benchmark Period Mean (complement) [W/m2] |
Bias [W/m2] |
RMSE [W/m2] |
Phase Shift [months] |
Bias Score [1] |
RMSE Score [1] |
Seasonal Cycle Score [1] |
Spatial Distribution Score [1] |
Interannual Variability Score [1] |
Overall Score [1] |
|||
|---|---|---|---|---|---|---|---|---|---|---|---|---|---|---|---|---|---|
| Benchmark | [-] | 411. | |||||||||||||||
| CON | [-] | 412. | 412. | 410. | 417. | 3.63 | 11.4 | 1.88 | 0.393 | 0.383 | 0.713 | 0.582 | 0.752 | 0.535 | |||
| OP | [-] | 412. | 412. | 410. | 417. | 3.63 | 11.4 | 1.88 | 0.393 | 0.383 | 0.713 | 0.582 | 0.752 | 0.535 |
Download Data |
Period Mean (original grids) [W/m2] |
Model Period Mean (intersection) [W/m2] |
Model Period Mean (complement) [W/m2] |
Benchmark Period Mean (intersection) [W/m2] |
Benchmark Period Mean (complement) [W/m2] |
Bias [W/m2] |
RMSE [W/m2] |
Phase Shift [months] |
Bias Score [1] |
RMSE Score [1] |
Seasonal Cycle Score [1] |
Spatial Distribution Score [1] |
Interannual Variability Score [1] |
Overall Score [1] |
|||
|---|---|---|---|---|---|---|---|---|---|---|---|---|---|---|---|---|---|
| Benchmark | [-] | 268. | |||||||||||||||
| CON | [-] | 264. | 264. | 267. | 278. | -2.68 | 11.1 | 0.0481 | 0.913 | 0.850 | 0.997 | 0.977 | 0.858 | 0.908 | |||
| OP | [-] | 264. | 264. | 267. | 278. | -2.68 | 11.1 | 0.0481 | 0.913 | 0.850 | 0.997 | 0.977 | 0.858 | 0.908 |
Download Data |
Period Mean (original grids) [W/m2] |
Model Period Mean (intersection) [W/m2] |
Model Period Mean (complement) [W/m2] |
Benchmark Period Mean (intersection) [W/m2] |
Benchmark Period Mean (complement) [W/m2] |
Bias [W/m2] |
RMSE [W/m2] |
Phase Shift [months] |
Bias Score [1] |
RMSE Score [1] |
Seasonal Cycle Score [1] |
Spatial Distribution Score [1] |
Interannual Variability Score [1] |
Overall Score [1] |
|||
|---|---|---|---|---|---|---|---|---|---|---|---|---|---|---|---|---|---|
| Benchmark | [-] | 297. | |||||||||||||||
| CON | [-] | 293. | 293. | 297. | 355. | -0.618 | 14.7 | 0.154 | 0.836 | 0.807 | 0.990 | 0.988 | 0.797 | 0.871 | |||
| OP | [-] | 293. | 293. | 297. | 355. | -0.618 | 14.7 | 0.154 | 0.836 | 0.807 | 0.990 | 0.988 | 0.797 | 0.871 |
Download Data |
Period Mean (original grids) [W/m2] |
Model Period Mean (intersection) [W/m2] |
Model Period Mean (complement) [W/m2] |
Benchmark Period Mean (intersection) [W/m2] |
Benchmark Period Mean (complement) [W/m2] |
Bias [W/m2] |
RMSE [W/m2] |
Phase Shift [months] |
Bias Score [1] |
RMSE Score [1] |
Seasonal Cycle Score [1] |
Spatial Distribution Score [1] |
Interannual Variability Score [1] |
Overall Score [1] |
|||
|---|---|---|---|---|---|---|---|---|---|---|---|---|---|---|---|---|---|
| Benchmark | [-] | 387. | |||||||||||||||
| CON | [-] | 375. | 374. | 387. | 411. | -5.29 | 16.0 | 0.448 | 0.709 | 0.705 | 0.959 | 0.999 | 0.805 | 0.814 | |||
| OP | [-] | 375. | 374. | 387. | 411. | -5.29 | 16.0 | 0.448 | 0.709 | 0.705 | 0.959 | 0.999 | 0.805 | 0.814 |
Download Data |
Period Mean (original grids) [W/m2] |
Model Period Mean (intersection) [W/m2] |
Model Period Mean (complement) [W/m2] |
Benchmark Period Mean (intersection) [W/m2] |
Benchmark Period Mean (complement) [W/m2] |
Bias [W/m2] |
RMSE [W/m2] |
Phase Shift [months] |
Bias Score [1] |
RMSE Score [1] |
Seasonal Cycle Score [1] |
Spatial Distribution Score [1] |
Interannual Variability Score [1] |
Overall Score [1] |
|||
|---|---|---|---|---|---|---|---|---|---|---|---|---|---|---|---|---|---|
| Benchmark | [-] | 249. | |||||||||||||||
| CON | [-] | 243. | 244. | 249. | 242. | -4.14 | 13.8 | 0.0568 | 0.913 | 0.793 | 0.996 | 0.975 | 0.911 | 0.897 | |||
| OP | [-] | 243. | 244. | 249. | 242. | -4.14 | 13.8 | 0.0568 | 0.913 | 0.793 | 0.996 | 0.975 | 0.911 | 0.897 |
Download Data |
Period Mean (original grids) [W/m2] |
Model Period Mean (intersection) [W/m2] |
Model Period Mean (complement) [W/m2] |
Benchmark Period Mean (intersection) [W/m2] |
Benchmark Period Mean (complement) [W/m2] |
Bias [W/m2] |
RMSE [W/m2] |
Phase Shift [months] |
Bias Score [1] |
RMSE Score [1] |
Seasonal Cycle Score [1] |
Spatial Distribution Score [1] |
Interannual Variability Score [1] |
Overall Score [1] |
|||
|---|---|---|---|---|---|---|---|---|---|---|---|---|---|---|---|---|---|
| Benchmark | [-] | 353. | |||||||||||||||
| CON | [-] | 351. | 351. | 353. | 359. | -0.808 | 10.2 | 0.310 | 0.848 | 0.751 | 0.980 | 0.992 | 0.867 | 0.865 | |||
| OP | [-] | 351. | 351. | 353. | 359. | -0.808 | 10.2 | 0.310 | 0.848 | 0.751 | 0.980 | 0.992 | 0.867 | 0.865 |
Download Data |
Period Mean (original grids) [W/m2] |
Model Period Mean (intersection) [W/m2] |
Model Period Mean (complement) [W/m2] |
Benchmark Period Mean (intersection) [W/m2] |
Benchmark Period Mean (complement) [W/m2] |
Bias [W/m2] |
RMSE [W/m2] |
Phase Shift [months] |
Bias Score [1] |
RMSE Score [1] |
Seasonal Cycle Score [1] |
Spatial Distribution Score [1] |
Interannual Variability Score [1] |
Overall Score [1] |
|||
|---|---|---|---|---|---|---|---|---|---|---|---|---|---|---|---|---|---|
| Benchmark | [-] | 314. | |||||||||||||||
| CON | [-] | 306. | 306. | 313. | 325. | -3.26 | 11.9 | 0.219 | 0.800 | 0.744 | 0.982 | 0.996 | 0.706 | 0.829 | |||
| OP | [-] | 306. | 306. | 313. | 325. | -3.26 | 11.9 | 0.219 | 0.800 | 0.744 | 0.982 | 0.996 | 0.706 | 0.829 |
Download Data |
Period Mean (original grids) [W/m2] |
Model Period Mean (intersection) [W/m2] |
Model Period Mean (complement) [W/m2] |
Benchmark Period Mean (intersection) [W/m2] |
Benchmark Period Mean (complement) [W/m2] |
Bias [W/m2] |
RMSE [W/m2] |
Phase Shift [months] |
Bias Score [1] |
RMSE Score [1] |
Seasonal Cycle Score [1] |
Spatial Distribution Score [1] |
Interannual Variability Score [1] |
Overall Score [1] |
|||
|---|---|---|---|---|---|---|---|---|---|---|---|---|---|---|---|---|---|
| Benchmark | [-] | 345. | |||||||||||||||
| CON | [-] | 309. | 309. | 319. | 360. | -2.70 | 13.4 | 0.519 | 0.747 | 0.678 | 0.940 | 0.999 | 0.797 | 0.806 | |||
| OP | [-] | 309. | 309. | 319. | 360. | -2.70 | 13.4 | 0.519 | 0.747 | 0.678 | 0.940 | 0.999 | 0.797 | 0.806 |
Download Data |
Period Mean (original grids) [W/m2] |
Model Period Mean (intersection) [W/m2] |
Model Period Mean (complement) [W/m2] |
Benchmark Period Mean (intersection) [W/m2] |
Benchmark Period Mean (complement) [W/m2] |
Bias [W/m2] |
RMSE [W/m2] |
Phase Shift [months] |
Bias Score [1] |
RMSE Score [1] |
Seasonal Cycle Score [1] |
Spatial Distribution Score [1] |
Interannual Variability Score [1] |
Overall Score [1] |
|||
|---|---|---|---|---|---|---|---|---|---|---|---|---|---|---|---|---|---|
| Benchmark | [-] | 350. | |||||||||||||||
| CON | [-] | 344. | 344. | 350. | 360. | -3.85 | 15.3 | 0.405 | 0.801 | 0.727 | 0.967 | 0.991 | 0.787 | 0.833 | |||
| OP | [-] | 344. | 344. | 350. | 360. | -3.85 | 15.3 | 0.405 | 0.801 | 0.727 | 0.967 | 0.991 | 0.787 | 0.833 |
Download Data |
Period Mean (original grids) [W/m2] |
Model Period Mean (intersection) [W/m2] |
Model Period Mean (complement) [W/m2] |
Benchmark Period Mean (intersection) [W/m2] |
Benchmark Period Mean (complement) [W/m2] |
Bias [W/m2] |
RMSE [W/m2] |
Phase Shift [months] |
Bias Score [1] |
RMSE Score [1] |
Seasonal Cycle Score [1] |
Spatial Distribution Score [1] |
Interannual Variability Score [1] |
Overall Score [1] |
|||
|---|---|---|---|---|---|---|---|---|---|---|---|---|---|---|---|---|---|
| Benchmark | [-] | 248. | |||||||||||||||
| CON | [-] | 243. | 243. | 248. | 260. | -3.93 | 13.7 | 0.137 | 0.898 | 0.790 | 0.991 | 1.00 | 0.895 | 0.894 | |||
| OP | [-] | 243. | 243. | 248. | 260. | -3.93 | 13.7 | 0.137 | 0.898 | 0.790 | 0.991 | 1.00 | 0.895 | 0.894 |
Download Data |
Period Mean (original grids) [W/m2] |
Model Period Mean (intersection) [W/m2] |
Model Period Mean (complement) [W/m2] |
Benchmark Period Mean (intersection) [W/m2] |
Benchmark Period Mean (complement) [W/m2] |
Bias [W/m2] |
RMSE [W/m2] |
Phase Shift [months] |
Bias Score [1] |
RMSE Score [1] |
Seasonal Cycle Score [1] |
Spatial Distribution Score [1] |
Interannual Variability Score [1] |
Overall Score [1] |
|||
|---|---|---|---|---|---|---|---|---|---|---|---|---|---|---|---|---|---|
| Benchmark | [-] | 376. | |||||||||||||||
| CON | [-] | 363. | 362. | 375. | 407. | -1.27 | 14.8 | 0.782 | 0.636 | 0.674 | 0.902 | 0.994 | 0.802 | 0.781 | |||
| OP | [-] | 363. | 362. | 375. | 407. | -1.27 | 14.8 | 0.782 | 0.636 | 0.674 | 0.902 | 0.994 | 0.802 | 0.781 |
Download Data |
Period Mean (original grids) [W/m2] |
Model Period Mean (intersection) [W/m2] |
Model Period Mean (complement) [W/m2] |
Benchmark Period Mean (intersection) [W/m2] |
Benchmark Period Mean (complement) [W/m2] |
Bias [W/m2] |
RMSE [W/m2] |
Phase Shift [months] |
Bias Score [1] |
RMSE Score [1] |
Seasonal Cycle Score [1] |
Spatial Distribution Score [1] |
Interannual Variability Score [1] |
Overall Score [1] |
|||
|---|---|---|---|---|---|---|---|---|---|---|---|---|---|---|---|---|---|
| Benchmark | [-] | 335. | |||||||||||||||
| CON | [-] | 329. | 328. | 334. | 364. | -2.25 | 10.1 | 0.108 | 0.906 | 0.827 | 0.993 | 1.00 | 0.818 | 0.895 | |||
| OP | [-] | 329. | 328. | 334. | 364. | -2.25 | 10.1 | 0.108 | 0.906 | 0.827 | 0.993 | 1.00 | 0.818 | 0.895 |
Download Data |
Period Mean (original grids) [W/m2] |
Model Period Mean (intersection) [W/m2] |
Model Period Mean (complement) [W/m2] |
Benchmark Period Mean (intersection) [W/m2] |
Benchmark Period Mean (complement) [W/m2] |
Bias [W/m2] |
RMSE [W/m2] |
Phase Shift [months] |
Bias Score [1] |
RMSE Score [1] |
Seasonal Cycle Score [1] |
Spatial Distribution Score [1] |
Interannual Variability Score [1] |
Overall Score [1] |
|||
|---|---|---|---|---|---|---|---|---|---|---|---|---|---|---|---|---|---|
| Benchmark | [-] | 278. | |||||||||||||||
| CON | [-] | 275. | 275. | 278. | 307. | -1.15 | 10.0 | 0.0825 | 0.899 | 0.819 | 0.994 | 0.996 | 0.862 | 0.898 | |||
| OP | [-] | 275. | 275. | 278. | 307. | -1.15 | 10.0 | 0.0825 | 0.899 | 0.819 | 0.994 | 0.996 | 0.862 | 0.898 |
Download Data |
Period Mean (original grids) [W/m2] |
Model Period Mean (intersection) [W/m2] |
Model Period Mean (complement) [W/m2] |
Benchmark Period Mean (intersection) [W/m2] |
Benchmark Period Mean (complement) [W/m2] |
Bias [W/m2] |
RMSE [W/m2] |
Phase Shift [months] |
Bias Score [1] |
RMSE Score [1] |
Seasonal Cycle Score [1] |
Spatial Distribution Score [1] |
Interannual Variability Score [1] |
Overall Score [1] |
|||
|---|---|---|---|---|---|---|---|---|---|---|---|---|---|---|---|---|---|
| Benchmark | [-] | 298. | |||||||||||||||
| CON | [-] | 294. | 294. | 298. | 330. | -2.63 | 13.2 | 0.123 | 0.812 | 0.758 | 0.992 | 0.998 | 0.741 | 0.843 | |||
| OP | [-] | 294. | 294. | 298. | 330. | -2.63 | 13.2 | 0.123 | 0.812 | 0.758 | 0.992 | 0.998 | 0.741 | 0.843 |
Download Data |
Period Mean (original grids) [W/m2] |
Model Period Mean (intersection) [W/m2] |
Model Period Mean (complement) [W/m2] |
Benchmark Period Mean (intersection) [W/m2] |
Benchmark Period Mean (complement) [W/m2] |
Bias [W/m2] |
RMSE [W/m2] |
Phase Shift [months] |
Bias Score [1] |
RMSE Score [1] |
Seasonal Cycle Score [1] |
Spatial Distribution Score [1] |
Interannual Variability Score [1] |
Overall Score [1] |
|||
|---|---|---|---|---|---|---|---|---|---|---|---|---|---|---|---|---|---|
| Benchmark | [-] | 410. | |||||||||||||||
| CON | [-] | 407. | 406. | 410. | 415. | -2.98 | 11.5 | 1.32 | 0.535 | 0.464 | 0.827 | 0.987 | 0.773 | 0.675 | |||
| OP | [-] | 407. | 406. | 410. | 415. | -2.98 | 11.5 | 1.32 | 0.535 | 0.464 | 0.827 | 0.987 | 0.773 | 0.675 |
Download Data |
Period Mean (original grids) [W/m2] |
Model Period Mean (intersection) [W/m2] |
Model Period Mean (complement) [W/m2] |
Benchmark Period Mean (intersection) [W/m2] |
Benchmark Period Mean (complement) [W/m2] |
Bias [W/m2] |
RMSE [W/m2] |
Phase Shift [months] |
Bias Score [1] |
RMSE Score [1] |
Seasonal Cycle Score [1] |
Spatial Distribution Score [1] |
Interannual Variability Score [1] |
Overall Score [1] |
|||
|---|---|---|---|---|---|---|---|---|---|---|---|---|---|---|---|---|---|
| Benchmark | [-] | 379. | |||||||||||||||
| CON | [-] | 377. | 376. | 379. | 384. | -3.05 | 11.8 | 0.675 | 0.748 | 0.647 | 0.935 | 0.996 | 0.845 | 0.803 | |||
| OP | [-] | 377. | 376. | 379. | 384. | -3.05 | 11.8 | 0.675 | 0.748 | 0.647 | 0.935 | 0.996 | 0.845 | 0.803 |
Download Data |
Period Mean (original grids) [W/m2] |
Model Period Mean (intersection) [W/m2] |
Model Period Mean (complement) [W/m2] |
Benchmark Period Mean (intersection) [W/m2] |
Benchmark Period Mean (complement) [W/m2] |
Bias [W/m2] |
RMSE [W/m2] |
Phase Shift [months] |
Bias Score [1] |
RMSE Score [1] |
Seasonal Cycle Score [1] |
Spatial Distribution Score [1] |
Interannual Variability Score [1] |
Overall Score [1] |
|||
|---|---|---|---|---|---|---|---|---|---|---|---|---|---|---|---|---|---|
| Benchmark | [-] | 303. | |||||||||||||||
| CON | [-] | 302. | 302. | 300. | 352. | 6.56 | 23.9 | 0.575 | 0.474 | 0.523 | 0.951 | 0.938 | 0.751 | 0.693 | |||
| OP | [-] | 302. | 302. | 300. | 352. | 6.56 | 23.9 | 0.575 | 0.474 | 0.523 | 0.951 | 0.938 | 0.751 | 0.693 |
Temporally integrated period mean