Mean State
Download Data |
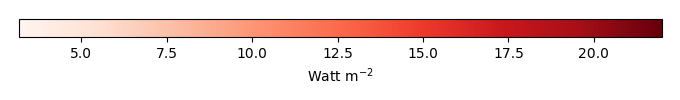
Period Mean (original grids) [Watt m-2] |
Model Period Mean (intersection) [Watt m-2] |
Model Period Mean (complement) [Watt m-2] |
Benchmark Period Mean (intersection) [Watt m-2] |
Benchmark Period Mean (complement) [Watt m-2] |
Bias [Watt m-2] |
RMSE [Watt m-2] |
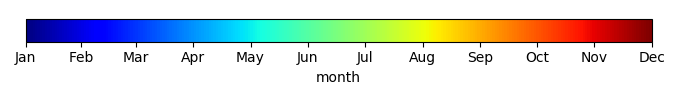
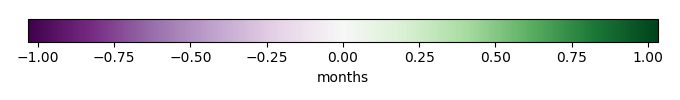
Phase Shift [months] |
Bias Score [1] |
RMSE Score [1] |
Seasonal Cycle Score [1] |
Spatial Distribution Score [1] |
Interannual Variability Score [1] |
Overall Score [1] |
|||
|---|---|---|---|---|---|---|---|---|---|---|---|---|---|---|---|---|---|
| Benchmark | [-] | 217. | |||||||||||||||
| CON | [-] | 215. | 216. | 216. | 241. | 0.739 | 15.1 | 0.447 | 0.815 | 0.543 | 0.937 | 0.996 | 0.747 | 0.763 | |||
| OP | [-] | 215. | 216. | 216. | 241. | 0.739 | 15.1 | 0.447 | 0.815 | 0.543 | 0.937 | 0.996 | 0.747 | 0.763 |
Download Data |
Period Mean (original grids) [Watt m-2] |
Model Period Mean (intersection) [Watt m-2] |
Model Period Mean (complement) [Watt m-2] |
Benchmark Period Mean (intersection) [Watt m-2] |
Benchmark Period Mean (complement) [Watt m-2] |
Bias [Watt m-2] |
RMSE [Watt m-2] |
Phase Shift [months] |
Bias Score [1] |
RMSE Score [1] |
Seasonal Cycle Score [1] |
Spatial Distribution Score [1] |
Interannual Variability Score [1] |
Overall Score [1] |
|||
|---|---|---|---|---|---|---|---|---|---|---|---|---|---|---|---|---|---|
| Benchmark | [-] | 241. | |||||||||||||||
| CON | [-] | 241. | 241. | 241. | 226. | 0.102 | 14.3 | 0.197 | 0.867 | 0.608 | 0.986 | 0.999 | 0.833 | 0.817 | |||
| OP | [-] | 241. | 241. | 241. | 226. | 0.102 | 14.3 | 0.197 | 0.867 | 0.608 | 0.986 | 0.999 | 0.833 | 0.817 |
Download Data |
Period Mean (original grids) [Watt m-2] |
Model Period Mean (intersection) [Watt m-2] |
Model Period Mean (complement) [Watt m-2] |
Benchmark Period Mean (intersection) [Watt m-2] |
Benchmark Period Mean (complement) [Watt m-2] |
Bias [Watt m-2] |
RMSE [Watt m-2] |
Phase Shift [months] |
Bias Score [1] |
RMSE Score [1] |
Seasonal Cycle Score [1] |
Spatial Distribution Score [1] |
Interannual Variability Score [1] |
Overall Score [1] |
|||
|---|---|---|---|---|---|---|---|---|---|---|---|---|---|---|---|---|---|
| Benchmark | [-] | 233. | |||||||||||||||
| CON | [-] | 234. | 233. | 233. | 241. | -0.524 | 17.1 | 0.382 | 0.848 | 0.601 | 0.952 | 0.989 | 0.684 | 0.779 | |||
| OP | [-] | 234. | 233. | 233. | 241. | -0.524 | 17.1 | 0.382 | 0.848 | 0.601 | 0.952 | 0.989 | 0.684 | 0.779 |
Download Data |
Period Mean (original grids) [Watt m-2] |
Model Period Mean (intersection) [Watt m-2] |
Model Period Mean (complement) [Watt m-2] |
Benchmark Period Mean (intersection) [Watt m-2] |
Benchmark Period Mean (complement) [Watt m-2] |
Bias [Watt m-2] |
RMSE [Watt m-2] |
Phase Shift [months] |
Bias Score [1] |
RMSE Score [1] |
Seasonal Cycle Score [1] |
Spatial Distribution Score [1] |
Interannual Variability Score [1] |
Overall Score [1] |
|||
|---|---|---|---|---|---|---|---|---|---|---|---|---|---|---|---|---|---|
| Benchmark | [-] | 111. | |||||||||||||||
| CON | [-] | 107. | 107. | 110. | 116. | -3.38 | 13.2 | 0.0283 | 0.944 | 0.844 | 0.998 | 0.915 | 0.681 | 0.871 | |||
| OP | [-] | 107. | 107. | 110. | 116. | -3.38 | 13.2 | 0.0283 | 0.944 | 0.844 | 0.998 | 0.915 | 0.681 | 0.871 |
Download Data |
Period Mean (original grids) [Watt m-2] |
Model Period Mean (intersection) [Watt m-2] |
Model Period Mean (complement) [Watt m-2] |
Benchmark Period Mean (intersection) [Watt m-2] |
Benchmark Period Mean (complement) [Watt m-2] |
Bias [Watt m-2] |
RMSE [Watt m-2] |
Phase Shift [months] |
Bias Score [1] |
RMSE Score [1] |
Seasonal Cycle Score [1] |
Spatial Distribution Score [1] |
Interannual Variability Score [1] |
Overall Score [1] |
|||
|---|---|---|---|---|---|---|---|---|---|---|---|---|---|---|---|---|---|
| Benchmark | [-] | 212. | |||||||||||||||
| CON | [-] | 205. | 205. | 210. | 226. | 1.22 | 19.4 | 0.673 | 0.743 | 0.462 | 0.906 | 0.994 | 0.736 | 0.717 | |||
| OP | [-] | 205. | 205. | 210. | 226. | 1.22 | 19.4 | 0.673 | 0.743 | 0.462 | 0.906 | 0.994 | 0.736 | 0.717 |
Download Data |
Period Mean (original grids) [Watt m-2] |
Model Period Mean (intersection) [Watt m-2] |
Model Period Mean (complement) [Watt m-2] |
Benchmark Period Mean (intersection) [Watt m-2] |
Benchmark Period Mean (complement) [Watt m-2] |
Bias [Watt m-2] |
RMSE [Watt m-2] |
Phase Shift [months] |
Bias Score [1] |
RMSE Score [1] |
Seasonal Cycle Score [1] |
Spatial Distribution Score [1] |
Interannual Variability Score [1] |
Overall Score [1] |
|||
|---|---|---|---|---|---|---|---|---|---|---|---|---|---|---|---|---|---|
| Benchmark | [-] | 126. | |||||||||||||||
| CON | [-] | 126. | 125. | 125. | 134. | 0.562 | 12.1 | 0.112 | 0.973 | 0.858 | 0.993 | 0.998 | 0.635 | 0.886 | |||
| OP | [-] | 126. | 125. | 125. | 134. | 0.562 | 12.1 | 0.112 | 0.973 | 0.858 | 0.993 | 0.998 | 0.635 | 0.886 |
Download Data |
Period Mean (original grids) [Watt m-2] |
Model Period Mean (intersection) [Watt m-2] |
Model Period Mean (complement) [Watt m-2] |
Benchmark Period Mean (intersection) [Watt m-2] |
Benchmark Period Mean (complement) [Watt m-2] |
Bias [Watt m-2] |
RMSE [Watt m-2] |
Phase Shift [months] |
Bias Score [1] |
RMSE Score [1] |
Seasonal Cycle Score [1] |
Spatial Distribution Score [1] |
Interannual Variability Score [1] |
Overall Score [1] |
|||
|---|---|---|---|---|---|---|---|---|---|---|---|---|---|---|---|---|---|
| Benchmark | [-] | 169. | |||||||||||||||
| CON | [-] | 170. | 170. | 169. | 172. | 0.900 | 14.9 | 0.184 | 0.930 | 0.782 | 0.983 | 0.999 | 0.617 | 0.849 | |||
| OP | [-] | 170. | 170. | 169. | 172. | 0.900 | 14.9 | 0.184 | 0.930 | 0.782 | 0.983 | 0.999 | 0.617 | 0.849 |
Download Data |
Period Mean (original grids) [Watt m-2] |
Model Period Mean (intersection) [Watt m-2] |
Model Period Mean (complement) [Watt m-2] |
Benchmark Period Mean (intersection) [Watt m-2] |
Benchmark Period Mean (complement) [Watt m-2] |
Bias [Watt m-2] |
RMSE [Watt m-2] |
Phase Shift [months] |
Bias Score [1] |
RMSE Score [1] |
Seasonal Cycle Score [1] |
Spatial Distribution Score [1] |
Interannual Variability Score [1] |
Overall Score [1] |
|||
|---|---|---|---|---|---|---|---|---|---|---|---|---|---|---|---|---|---|
| Benchmark | [-] | 209. | |||||||||||||||
| CON | [-] | 208. | 208. | 209. | 228. | 1.48 | 18.1 | 0.192 | 0.862 | 0.644 | 0.986 | 0.988 | 0.654 | 0.796 | |||
| OP | [-] | 208. | 208. | 209. | 228. | 1.48 | 18.1 | 0.192 | 0.862 | 0.644 | 0.986 | 0.988 | 0.654 | 0.796 |
Download Data |
Period Mean (original grids) [Watt m-2] |
Model Period Mean (intersection) [Watt m-2] |
Model Period Mean (complement) [Watt m-2] |
Benchmark Period Mean (intersection) [Watt m-2] |
Benchmark Period Mean (complement) [Watt m-2] |
Bias [Watt m-2] |
RMSE [Watt m-2] |
Phase Shift [months] |
Bias Score [1] |
RMSE Score [1] |
Seasonal Cycle Score [1] |
Spatial Distribution Score [1] |
Interannual Variability Score [1] |
Overall Score [1] |
|||
|---|---|---|---|---|---|---|---|---|---|---|---|---|---|---|---|---|---|
| Benchmark | [-] | 104. | |||||||||||||||
| CON | [-] | 95.7 | 96.4 | 104. | 109. | -8.29 | 13.0 | 0.118 | 0.901 | 0.821 | 0.992 | 0.805 | 0.653 | 0.832 | |||
| OP | [-] | 95.7 | 96.4 | 104. | 109. | -8.29 | 13.0 | 0.118 | 0.901 | 0.821 | 0.992 | 0.805 | 0.653 | 0.832 |
Download Data |
Period Mean (original grids) [Watt m-2] |
Model Period Mean (intersection) [Watt m-2] |
Model Period Mean (complement) [Watt m-2] |
Benchmark Period Mean (intersection) [Watt m-2] |
Benchmark Period Mean (complement) [Watt m-2] |
Bias [Watt m-2] |
RMSE [Watt m-2] |
Phase Shift [months] |
Bias Score [1] |
RMSE Score [1] |
Seasonal Cycle Score [1] |
Spatial Distribution Score [1] |
Interannual Variability Score [1] |
Overall Score [1] |
|||
|---|---|---|---|---|---|---|---|---|---|---|---|---|---|---|---|---|---|
| Benchmark | [-] | 227. | |||||||||||||||
| CON | [-] | 232. | 232. | 228. | 215. | 1.34 | 15.9 | 0.155 | 0.923 | 0.756 | 0.989 | 0.999 | 0.675 | 0.849 | |||
| OP | [-] | 232. | 232. | 228. | 215. | 1.34 | 15.9 | 0.155 | 0.923 | 0.756 | 0.989 | 0.999 | 0.675 | 0.849 |
Download Data |
Period Mean (original grids) [Watt m-2] |
Model Period Mean (intersection) [Watt m-2] |
Model Period Mean (complement) [Watt m-2] |
Benchmark Period Mean (intersection) [Watt m-2] |
Benchmark Period Mean (complement) [Watt m-2] |
Bias [Watt m-2] |
RMSE [Watt m-2] |
Phase Shift [months] |
Bias Score [1] |
RMSE Score [1] |
Seasonal Cycle Score [1] |
Spatial Distribution Score [1] |
Interannual Variability Score [1] |
Overall Score [1] |
|||
|---|---|---|---|---|---|---|---|---|---|---|---|---|---|---|---|---|---|
| Benchmark | [-] | 140. | |||||||||||||||
| CON | [-] | 135. | 135. | 141. | 129. | -0.690 | 14.3 | 0.142 | 0.938 | 0.844 | 0.990 | 0.999 | 0.649 | 0.877 | |||
| OP | [-] | 135. | 135. | 141. | 129. | -0.690 | 14.3 | 0.142 | 0.938 | 0.844 | 0.990 | 0.999 | 0.649 | 0.877 |
Download Data |
Period Mean (original grids) [Watt m-2] |
Model Period Mean (intersection) [Watt m-2] |
Model Period Mean (complement) [Watt m-2] |
Benchmark Period Mean (intersection) [Watt m-2] |
Benchmark Period Mean (complement) [Watt m-2] |
Bias [Watt m-2] |
RMSE [Watt m-2] |
Phase Shift [months] |
Bias Score [1] |
RMSE Score [1] |
Seasonal Cycle Score [1] |
Spatial Distribution Score [1] |
Interannual Variability Score [1] |
Overall Score [1] |
|||
|---|---|---|---|---|---|---|---|---|---|---|---|---|---|---|---|---|---|
| Benchmark | [-] | 191. | |||||||||||||||
| CON | [-] | 182. | 182. | 186. | 193. | -4.22 | 15.5 | 0.202 | 0.884 | 0.725 | 0.979 | 0.986 | 0.664 | 0.827 | |||
| OP | [-] | 182. | 182. | 186. | 193. | -4.22 | 15.5 | 0.202 | 0.884 | 0.725 | 0.979 | 0.986 | 0.664 | 0.827 |
Download Data |
Period Mean (original grids) [Watt m-2] |
Model Period Mean (intersection) [Watt m-2] |
Model Period Mean (complement) [Watt m-2] |
Benchmark Period Mean (intersection) [Watt m-2] |
Benchmark Period Mean (complement) [Watt m-2] |
Bias [Watt m-2] |
RMSE [Watt m-2] |
Phase Shift [months] |
Bias Score [1] |
RMSE Score [1] |
Seasonal Cycle Score [1] |
Spatial Distribution Score [1] |
Interannual Variability Score [1] |
Overall Score [1] |
|||
|---|---|---|---|---|---|---|---|---|---|---|---|---|---|---|---|---|---|
| Benchmark | [-] | 240. | |||||||||||||||
| CON | [-] | 240. | 240. | 240. | 235. | -0.399 | 14.0 | 0.172 | 0.921 | 0.789 | 0.987 | 1.00 | 0.628 | 0.852 | |||
| OP | [-] | 240. | 240. | 240. | 235. | -0.399 | 14.0 | 0.172 | 0.921 | 0.789 | 0.987 | 1.00 | 0.628 | 0.852 |
Download Data |
Period Mean (original grids) [Watt m-2] |
Model Period Mean (intersection) [Watt m-2] |
Model Period Mean (complement) [Watt m-2] |
Benchmark Period Mean (intersection) [Watt m-2] |
Benchmark Period Mean (complement) [Watt m-2] |
Bias [Watt m-2] |
RMSE [Watt m-2] |
Phase Shift [months] |
Bias Score [1] |
RMSE Score [1] |
Seasonal Cycle Score [1] |
Spatial Distribution Score [1] |
Interannual Variability Score [1] |
Overall Score [1] |
|||
|---|---|---|---|---|---|---|---|---|---|---|---|---|---|---|---|---|---|
| Benchmark | [-] | 112. | |||||||||||||||
| CON | [-] | 108. | 108. | 112. | 115. | -4.93 | 13.0 | 0.0674 | 0.933 | 0.841 | 0.995 | 0.865 | 0.720 | 0.866 | |||
| OP | [-] | 108. | 108. | 112. | 115. | -4.93 | 13.0 | 0.0674 | 0.933 | 0.841 | 0.995 | 0.865 | 0.720 | 0.866 |
Download Data |
Period Mean (original grids) [Watt m-2] |
Model Period Mean (intersection) [Watt m-2] |
Model Period Mean (complement) [Watt m-2] |
Benchmark Period Mean (intersection) [Watt m-2] |
Benchmark Period Mean (complement) [Watt m-2] |
Bias [Watt m-2] |
RMSE [Watt m-2] |
Phase Shift [months] |
Bias Score [1] |
RMSE Score [1] |
Seasonal Cycle Score [1] |
Spatial Distribution Score [1] |
Interannual Variability Score [1] |
Overall Score [1] |
|||
|---|---|---|---|---|---|---|---|---|---|---|---|---|---|---|---|---|---|
| Benchmark | [-] | 231. | |||||||||||||||
| CON | [-] | 226. | 227. | 231. | 233. | -0.546 | 18.7 | 0.281 | 0.801 | 0.679 | 0.972 | 0.978 | 0.689 | 0.800 | |||
| OP | [-] | 226. | 227. | 231. | 233. | -0.546 | 18.7 | 0.281 | 0.801 | 0.679 | 0.972 | 0.978 | 0.689 | 0.800 |
Download Data |
Period Mean (original grids) [Watt m-2] |
Model Period Mean (intersection) [Watt m-2] |
Model Period Mean (complement) [Watt m-2] |
Benchmark Period Mean (intersection) [Watt m-2] |
Benchmark Period Mean (complement) [Watt m-2] |
Bias [Watt m-2] |
RMSE [Watt m-2] |
Phase Shift [months] |
Bias Score [1] |
RMSE Score [1] |
Seasonal Cycle Score [1] |
Spatial Distribution Score [1] |
Interannual Variability Score [1] |
Overall Score [1] |
|||
|---|---|---|---|---|---|---|---|---|---|---|---|---|---|---|---|---|---|
| Benchmark | [-] | 174. | |||||||||||||||
| CON | [-] | 171. | 171. | 173. | 200. | 0.449 | 14.3 | 0.188 | 0.952 | 0.799 | 0.987 | 1.00 | 0.636 | 0.862 | |||
| OP | [-] | 171. | 171. | 173. | 200. | 0.449 | 14.3 | 0.188 | 0.952 | 0.799 | 0.987 | 1.00 | 0.636 | 0.862 |
Download Data |
Period Mean (original grids) [Watt m-2] |
Model Period Mean (intersection) [Watt m-2] |
Model Period Mean (complement) [Watt m-2] |
Benchmark Period Mean (intersection) [Watt m-2] |
Benchmark Period Mean (complement) [Watt m-2] |
Bias [Watt m-2] |
RMSE [Watt m-2] |
Phase Shift [months] |
Bias Score [1] |
RMSE Score [1] |
Seasonal Cycle Score [1] |
Spatial Distribution Score [1] |
Interannual Variability Score [1] |
Overall Score [1] |
|||
|---|---|---|---|---|---|---|---|---|---|---|---|---|---|---|---|---|---|
| Benchmark | [-] | 135. | |||||||||||||||
| CON | [-] | 135. | 135. | 135. | 133. | -0.0299 | 11.5 | 0.0798 | 0.972 | 0.862 | 0.995 | 1.00 | 0.663 | 0.892 | |||
| OP | [-] | 135. | 135. | 135. | 133. | -0.0299 | 11.5 | 0.0798 | 0.972 | 0.862 | 0.995 | 1.00 | 0.663 | 0.892 |
Download Data |
Period Mean (original grids) [Watt m-2] |
Model Period Mean (intersection) [Watt m-2] |
Model Period Mean (complement) [Watt m-2] |
Benchmark Period Mean (intersection) [Watt m-2] |
Benchmark Period Mean (complement) [Watt m-2] |
Bias [Watt m-2] |
RMSE [Watt m-2] |
Phase Shift [months] |
Bias Score [1] |
RMSE Score [1] |
Seasonal Cycle Score [1] |
Spatial Distribution Score [1] |
Interannual Variability Score [1] |
Overall Score [1] |
|||
|---|---|---|---|---|---|---|---|---|---|---|---|---|---|---|---|---|---|
| Benchmark | [-] | 193. | |||||||||||||||
| CON | [-] | 193. | 193. | 193. | 210. | -0.881 | 14.2 | 0.105 | 0.957 | 0.834 | 0.993 | 0.999 | 0.657 | 0.879 | |||
| OP | [-] | 193. | 193. | 193. | 210. | -0.881 | 14.2 | 0.105 | 0.957 | 0.834 | 0.993 | 0.999 | 0.657 | 0.879 |
Download Data |
Period Mean (original grids) [Watt m-2] |
Model Period Mean (intersection) [Watt m-2] |
Model Period Mean (complement) [Watt m-2] |
Benchmark Period Mean (intersection) [Watt m-2] |
Benchmark Period Mean (complement) [Watt m-2] |
Bias [Watt m-2] |
RMSE [Watt m-2] |
Phase Shift [months] |
Bias Score [1] |
RMSE Score [1] |
Seasonal Cycle Score [1] |
Spatial Distribution Score [1] |
Interannual Variability Score [1] |
Overall Score [1] |
|||
|---|---|---|---|---|---|---|---|---|---|---|---|---|---|---|---|---|---|
| Benchmark | [-] | 203. | |||||||||||||||
| CON | [-] | 201. | 201. | 203. | 242. | -0.214 | 15.6 | 0.518 | 0.820 | 0.507 | 0.930 | 0.998 | 0.755 | 0.753 | |||
| OP | [-] | 201. | 201. | 203. | 242. | -0.214 | 15.6 | 0.518 | 0.820 | 0.507 | 0.930 | 0.998 | 0.755 | 0.753 |
Download Data |
Period Mean (original grids) [Watt m-2] |
Model Period Mean (intersection) [Watt m-2] |
Model Period Mean (complement) [Watt m-2] |
Benchmark Period Mean (intersection) [Watt m-2] |
Benchmark Period Mean (complement) [Watt m-2] |
Bias [Watt m-2] |
RMSE [Watt m-2] |
Phase Shift [months] |
Bias Score [1] |
RMSE Score [1] |
Seasonal Cycle Score [1] |
Spatial Distribution Score [1] |
Interannual Variability Score [1] |
Overall Score [1] |
|||
|---|---|---|---|---|---|---|---|---|---|---|---|---|---|---|---|---|---|
| Benchmark | [-] | 212. | |||||||||||||||
| CON | [-] | 212. | 213. | 212. | 209. | 0.511 | 18.1 | 0.350 | 0.891 | 0.629 | 0.963 | 0.995 | 0.664 | 0.795 | |||
| OP | [-] | 212. | 213. | 212. | 209. | 0.511 | 18.1 | 0.350 | 0.891 | 0.629 | 0.963 | 0.995 | 0.664 | 0.795 |
Download Data |
Period Mean (original grids) [Watt m-2] |
Model Period Mean (intersection) [Watt m-2] |
Model Period Mean (complement) [Watt m-2] |
Benchmark Period Mean (intersection) [Watt m-2] |
Benchmark Period Mean (complement) [Watt m-2] |
Bias [Watt m-2] |
RMSE [Watt m-2] |
Phase Shift [months] |
Bias Score [1] |
RMSE Score [1] |
Seasonal Cycle Score [1] |
Spatial Distribution Score [1] |
Interannual Variability Score [1] |
Overall Score [1] |
|||
|---|---|---|---|---|---|---|---|---|---|---|---|---|---|---|---|---|---|
| Benchmark | [-] | 204. | |||||||||||||||
| CON | [-] | 209. | 207. | 204. | 194. | -1.36 | 22.3 | 0.343 | 0.840 | 0.716 | 0.965 | 0.995 | 0.643 | 0.813 | |||
| OP | [-] | 209. | 207. | 204. | 194. | -1.36 | 22.3 | 0.343 | 0.840 | 0.716 | 0.965 | 0.995 | 0.643 | 0.813 |
Temporally integrated period mean