Mean State
Download Data |
Period Mean (original grids) [%] |
Model Period Mean (intersection) [%] |
Model Period Mean (complement) [%] |
Benchmark Period Mean (intersection) [%] |
Benchmark Period Mean (complement) [%] |
Bias [%] |
RMSE [%] |
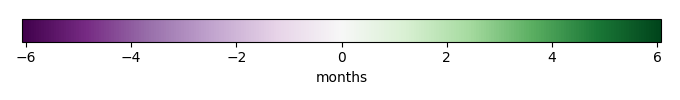
Phase Shift [months] |
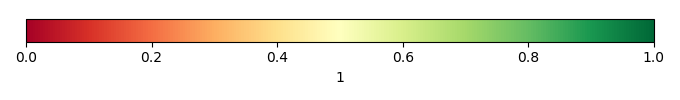
Bias Score [1] |
RMSE Score [1] |
Seasonal Cycle Score [1] |
Spatial Distribution Score [1] |
Interannual Variability Score [1] |
Overall Score [1] |
|||
|---|---|---|---|---|---|---|---|---|---|---|---|---|---|---|---|---|---|
| Benchmark | [-] | 77.7 | |||||||||||||||
| CON | [-] | 69.8 | 69.5 | 77.7 | 77.8 | -7.22 | 13.5 | 1.72 | 0.351 | 0.234 | 0.765 | 0.997 | 0.476 | 0.509 | |||
| OP | [-] | 70.0 | 69.6 | 77.7 | 77.8 | -7.06 | 13.4 | 1.72 | 0.354 | 0.234 | 0.765 | 0.997 | 0.477 | 0.510 |
Download Data |
Period Mean (original grids) [%] |
Model Period Mean (intersection) [%] |
Model Period Mean (complement) [%] |
Benchmark Period Mean (intersection) [%] |
Benchmark Period Mean (complement) [%] |
Bias [%] |
RMSE [%] |
Phase Shift [months] |
Bias Score [1] |
RMSE Score [1] |
Seasonal Cycle Score [1] |
Spatial Distribution Score [1] |
Interannual Variability Score [1] |
Overall Score [1] |
|||
|---|---|---|---|---|---|---|---|---|---|---|---|---|---|---|---|---|---|
| Benchmark | [-] | 53.0 | |||||||||||||||
| CON | [-] | 50.1 | 50.5 | 52.9 | 80.7 | -2.06 | 11.7 | 0.547 | 0.734 | 0.586 | 0.928 | 0.981 | 0.831 | 0.774 | |||
| OP | [-] | 50.1 | 50.5 | 52.9 | 80.7 | -2.03 | 11.7 | 0.547 | 0.735 | 0.586 | 0.928 | 0.981 | 0.831 | 0.774 |
Download Data |
Period Mean (original grids) [%] |
Model Period Mean (intersection) [%] |
Model Period Mean (complement) [%] |
Benchmark Period Mean (intersection) [%] |
Benchmark Period Mean (complement) [%] |
Bias [%] |
RMSE [%] |
Phase Shift [months] |
Bias Score [1] |
RMSE Score [1] |
Seasonal Cycle Score [1] |
Spatial Distribution Score [1] |
Interannual Variability Score [1] |
Overall Score [1] |
|||
|---|---|---|---|---|---|---|---|---|---|---|---|---|---|---|---|---|---|
| Benchmark | [-] | 64.2 | |||||||||||||||
| CON | [-] | 61.9 | 61.9 | 63.8 | 77.8 | -0.481 | 12.1 | 1.33 | 0.584 | 0.420 | 0.812 | 0.963 | 0.732 | 0.655 | |||
| OP | [-] | 62.0 | 62.0 | 63.8 | 77.8 | -0.417 | 12.1 | 1.32 | 0.584 | 0.420 | 0.813 | 0.963 | 0.732 | 0.655 |
Download Data |
Period Mean (original grids) [%] |
Model Period Mean (intersection) [%] |
Model Period Mean (complement) [%] |
Benchmark Period Mean (intersection) [%] |
Benchmark Period Mean (complement) [%] |
Bias [%] |
RMSE [%] |
Phase Shift [months] |
Bias Score [1] |
RMSE Score [1] |
Seasonal Cycle Score [1] |
Spatial Distribution Score [1] |
Interannual Variability Score [1] |
Overall Score [1] |
|||
|---|---|---|---|---|---|---|---|---|---|---|---|---|---|---|---|---|---|
| Benchmark | [-] | 77.7 | |||||||||||||||
| CON | [-] | 88.6 | 88.5 | 77.4 | 83.2 | 11.3 | 17.5 | 2.60 | 0.126 | 0.0788 | 0.583 | 0.745 | 0.474 | 0.348 | |||
| OP | [-] | 88.7 | 88.6 | 77.4 | 83.2 | 11.4 | 17.5 | 2.76 | 0.124 | 0.0799 | 0.552 | 0.735 | 0.477 | 0.341 |
Download Data |
Period Mean (original grids) [%] |
Model Period Mean (intersection) [%] |
Model Period Mean (complement) [%] |
Benchmark Period Mean (intersection) [%] |
Benchmark Period Mean (complement) [%] |
Bias [%] |
RMSE [%] |
Phase Shift [months] |
Bias Score [1] |
RMSE Score [1] |
Seasonal Cycle Score [1] |
Spatial Distribution Score [1] |
Interannual Variability Score [1] |
Overall Score [1] |
|||
|---|---|---|---|---|---|---|---|---|---|---|---|---|---|---|---|---|---|
| Benchmark | [-] | 84.0 | |||||||||||||||
| CON | [-] | 85.4 | 85.5 | 84.3 | 81.2 | -0.280 | 5.65 | 1.32 | 0.567 | 0.198 | 0.802 | 0.997 | 0.415 | 0.530 | |||
| OP | [-] | 85.5 | 85.7 | 84.3 | 81.2 | -0.107 | 5.63 | 1.29 | 0.568 | 0.199 | 0.810 | 0.998 | 0.417 | 0.532 |
Download Data |
Period Mean (original grids) [%] |
Model Period Mean (intersection) [%] |
Model Period Mean (complement) [%] |
Benchmark Period Mean (intersection) [%] |
Benchmark Period Mean (complement) [%] |
Bias [%] |
RMSE [%] |
Phase Shift [months] |
Bias Score [1] |
RMSE Score [1] |
Seasonal Cycle Score [1] |
Spatial Distribution Score [1] |
Interannual Variability Score [1] |
Overall Score [1] |
|||
|---|---|---|---|---|---|---|---|---|---|---|---|---|---|---|---|---|---|
| Benchmark | [-] | 72.2 | |||||||||||||||
| CON | [-] | 82.5 | 82.5 | 72.2 | 82.1 | 10.4 | 17.9 | 2.12 | 0.325 | 0.200 | 0.691 | 0.981 | 0.506 | 0.484 | |||
| OP | [-] | 82.6 | 82.6 | 72.2 | 82.1 | 10.5 | 17.9 | 2.14 | 0.321 | 0.201 | 0.689 | 0.982 | 0.508 | 0.484 |
Download Data |
Period Mean (original grids) [%] |
Model Period Mean (intersection) [%] |
Model Period Mean (complement) [%] |
Benchmark Period Mean (intersection) [%] |
Benchmark Period Mean (complement) [%] |
Bias [%] |
RMSE [%] |
Phase Shift [months] |
Bias Score [1] |
RMSE Score [1] |
Seasonal Cycle Score [1] |
Spatial Distribution Score [1] |
Interannual Variability Score [1] |
Overall Score [1] |
|||
|---|---|---|---|---|---|---|---|---|---|---|---|---|---|---|---|---|---|
| Benchmark | [-] | 61.1 | |||||||||||||||
| CON | [-] | 65.0 | 65.2 | 61.0 | 75.3 | 4.94 | 16.3 | 1.90 | 0.535 | 0.319 | 0.715 | 0.994 | 0.715 | 0.599 | |||
| OP | [-] | 65.1 | 65.2 | 61.0 | 75.3 | 4.99 | 16.3 | 1.90 | 0.533 | 0.319 | 0.715 | 0.994 | 0.716 | 0.599 |
Download Data |
Period Mean (original grids) [%] |
Model Period Mean (intersection) [%] |
Model Period Mean (complement) [%] |
Benchmark Period Mean (intersection) [%] |
Benchmark Period Mean (complement) [%] |
Bias [%] |
RMSE [%] |
Phase Shift [months] |
Bias Score [1] |
RMSE Score [1] |
Seasonal Cycle Score [1] |
Spatial Distribution Score [1] |
Interannual Variability Score [1] |
Overall Score [1] |
|||
|---|---|---|---|---|---|---|---|---|---|---|---|---|---|---|---|---|---|
| Benchmark | [-] | 69.3 | |||||||||||||||
| CON | [-] | 62.2 | 61.5 | 69.1 | 79.0 | -4.39 | 11.9 | 0.951 | 0.580 | 0.368 | 0.870 | 0.935 | 0.585 | 0.618 | |||
| OP | [-] | 62.3 | 61.5 | 69.1 | 79.0 | -4.29 | 11.9 | 0.959 | 0.582 | 0.369 | 0.867 | 0.934 | 0.586 | 0.618 |
Download Data |
Period Mean (original grids) [%] |
Model Period Mean (intersection) [%] |
Model Period Mean (complement) [%] |
Benchmark Period Mean (intersection) [%] |
Benchmark Period Mean (complement) [%] |
Bias [%] |
RMSE [%] |
Phase Shift [months] |
Bias Score [1] |
RMSE Score [1] |
Seasonal Cycle Score [1] |
Spatial Distribution Score [1] |
Interannual Variability Score [1] |
Overall Score [1] |
|||
|---|---|---|---|---|---|---|---|---|---|---|---|---|---|---|---|---|---|
| Benchmark | [-] | 78.8 | |||||||||||||||
| CON | [-] | 89.0 | 88.8 | 78.7 | 84.9 | 10.2 | 16.1 | 2.65 | 0.163 | 0.100 | 0.584 | 0.831 | 0.427 | 0.368 | |||
| OP | [-] | 89.1 | 88.9 | 78.7 | 84.9 | 10.3 | 16.1 | 2.79 | 0.160 | 0.102 | 0.559 | 0.825 | 0.431 | 0.363 |
Download Data |
Period Mean (original grids) [%] |
Model Period Mean (intersection) [%] |
Model Period Mean (complement) [%] |
Benchmark Period Mean (intersection) [%] |
Benchmark Period Mean (complement) [%] |
Bias [%] |
RMSE [%] |
Phase Shift [months] |
Bias Score [1] |
RMSE Score [1] |
Seasonal Cycle Score [1] |
Spatial Distribution Score [1] |
Interannual Variability Score [1] |
Overall Score [1] |
|||
|---|---|---|---|---|---|---|---|---|---|---|---|---|---|---|---|---|---|
| Benchmark | [-] | 53.2 | |||||||||||||||
| CON | [-] | 50.1 | 49.9 | 52.3 | 74.2 | 1.18 | 7.59 | 0.547 | 0.698 | 0.479 | 0.901 | 0.995 | 0.757 | 0.718 | |||
| OP | [-] | 50.2 | 50.0 | 52.3 | 74.2 | 1.23 | 7.60 | 0.547 | 0.697 | 0.480 | 0.901 | 0.995 | 0.757 | 0.718 |
Download Data |
Period Mean (original grids) [%] |
Model Period Mean (intersection) [%] |
Model Period Mean (complement) [%] |
Benchmark Period Mean (intersection) [%] |
Benchmark Period Mean (complement) [%] |
Bias [%] |
RMSE [%] |
Phase Shift [months] |
Bias Score [1] |
RMSE Score [1] |
Seasonal Cycle Score [1] |
Spatial Distribution Score [1] |
Interannual Variability Score [1] |
Overall Score [1] |
|||
|---|---|---|---|---|---|---|---|---|---|---|---|---|---|---|---|---|---|
| Benchmark | [-] | 76.4 | |||||||||||||||
| CON | [-] | 77.4 | 77.3 | 76.4 | 81.1 | 0.682 | 9.45 | 1.09 | 0.610 | 0.291 | 0.847 | 0.808 | 0.553 | 0.567 | |||
| OP | [-] | 77.5 | 77.3 | 76.4 | 81.1 | 0.743 | 9.44 | 1.09 | 0.610 | 0.292 | 0.846 | 0.808 | 0.554 | 0.567 |
Download Data |
Period Mean (original grids) [%] |
Model Period Mean (intersection) [%] |
Model Period Mean (complement) [%] |
Benchmark Period Mean (intersection) [%] |
Benchmark Period Mean (complement) [%] |
Bias [%] |
RMSE [%] |
Phase Shift [months] |
Bias Score [1] |
RMSE Score [1] |
Seasonal Cycle Score [1] |
Spatial Distribution Score [1] |
Interannual Variability Score [1] |
Overall Score [1] |
|||
|---|---|---|---|---|---|---|---|---|---|---|---|---|---|---|---|---|---|
| Benchmark | [-] | 74.8 | |||||||||||||||
| CON | [-] | 69.7 | 69.7 | 66.3 | 79.5 | 5.15 | 13.8 | 1.56 | 0.413 | 0.280 | 0.754 | 0.955 | 0.573 | 0.543 | |||
| OP | [-] | 69.8 | 69.8 | 66.3 | 79.5 | 5.22 | 13.8 | 1.57 | 0.413 | 0.281 | 0.752 | 0.955 | 0.574 | 0.543 |
Download Data |
Period Mean (original grids) [%] |
Model Period Mean (intersection) [%] |
Model Period Mean (complement) [%] |
Benchmark Period Mean (intersection) [%] |
Benchmark Period Mean (complement) [%] |
Bias [%] |
RMSE [%] |
Phase Shift [months] |
Bias Score [1] |
RMSE Score [1] |
Seasonal Cycle Score [1] |
Spatial Distribution Score [1] |
Interannual Variability Score [1] |
Overall Score [1] |
|||
|---|---|---|---|---|---|---|---|---|---|---|---|---|---|---|---|---|---|
| Benchmark | [-] | 37.7 | |||||||||||||||
| CON | [-] | 41.7 | 41.5 | 37.4 | 72.3 | 6.62 | 12.8 | 0.752 | 0.473 | 0.406 | 0.866 | 0.938 | 0.707 | 0.633 | |||
| OP | [-] | 41.7 | 41.6 | 37.4 | 72.3 | 6.64 | 12.8 | 0.763 | 0.473 | 0.407 | 0.863 | 0.939 | 0.707 | 0.633 |
Download Data |
Period Mean (original grids) [%] |
Model Period Mean (intersection) [%] |
Model Period Mean (complement) [%] |
Benchmark Period Mean (intersection) [%] |
Benchmark Period Mean (complement) [%] |
Bias [%] |
RMSE [%] |
Phase Shift [months] |
Bias Score [1] |
RMSE Score [1] |
Seasonal Cycle Score [1] |
Spatial Distribution Score [1] |
Interannual Variability Score [1] |
Overall Score [1] |
|||
|---|---|---|---|---|---|---|---|---|---|---|---|---|---|---|---|---|---|
| Benchmark | [-] | 77.9 | |||||||||||||||
| CON | [-] | 88.5 | 88.4 | 77.8 | 83.1 | 11.1 | 17.0 | 2.47 | 0.164 | 0.122 | 0.622 | 1.00 | 0.526 | 0.426 | |||
| OP | [-] | 88.5 | 88.5 | 77.8 | 83.1 | 11.2 | 17.0 | 2.47 | 0.163 | 0.122 | 0.622 | 0.999 | 0.527 | 0.426 |
Download Data |
Period Mean (original grids) [%] |
Model Period Mean (intersection) [%] |
Model Period Mean (complement) [%] |
Benchmark Period Mean (intersection) [%] |
Benchmark Period Mean (complement) [%] |
Bias [%] |
RMSE [%] |
Phase Shift [months] |
Bias Score [1] |
RMSE Score [1] |
Seasonal Cycle Score [1] |
Spatial Distribution Score [1] |
Interannual Variability Score [1] |
Overall Score [1] |
|||
|---|---|---|---|---|---|---|---|---|---|---|---|---|---|---|---|---|---|
| Benchmark | [-] | 69.3 | |||||||||||||||
| CON | [-] | 67.1 | 66.7 | 68.8 | 79.3 | 0.809 | 10.0 | 1.79 | 0.476 | 0.285 | 0.715 | 0.980 | 0.551 | 0.549 | |||
| OP | [-] | 67.2 | 66.8 | 68.8 | 79.3 | 0.896 | 10.0 | 1.79 | 0.477 | 0.285 | 0.715 | 0.981 | 0.551 | 0.549 |
Download Data |
Period Mean (original grids) [%] |
Model Period Mean (intersection) [%] |
Model Period Mean (complement) [%] |
Benchmark Period Mean (intersection) [%] |
Benchmark Period Mean (complement) [%] |
Bias [%] |
RMSE [%] |
Phase Shift [months] |
Bias Score [1] |
RMSE Score [1] |
Seasonal Cycle Score [1] |
Spatial Distribution Score [1] |
Interannual Variability Score [1] |
Overall Score [1] |
|||
|---|---|---|---|---|---|---|---|---|---|---|---|---|---|---|---|---|---|
| Benchmark | [-] | 69.8 | |||||||||||||||
| CON | [-] | 76.2 | 76.2 | 69.7 | 76.3 | 6.38 | 11.6 | 2.55 | 0.385 | 0.237 | 0.600 | 0.990 | 0.620 | 0.512 | |||
| OP | [-] | 76.3 | 76.3 | 69.7 | 76.3 | 6.45 | 11.7 | 2.55 | 0.382 | 0.238 | 0.602 | 0.991 | 0.622 | 0.512 |
Download Data |
Period Mean (original grids) [%] |
Model Period Mean (intersection) [%] |
Model Period Mean (complement) [%] |
Benchmark Period Mean (intersection) [%] |
Benchmark Period Mean (complement) [%] |
Bias [%] |
RMSE [%] |
Phase Shift [months] |
Bias Score [1] |
RMSE Score [1] |
Seasonal Cycle Score [1] |
Spatial Distribution Score [1] |
Interannual Variability Score [1] |
Overall Score [1] |
|||
|---|---|---|---|---|---|---|---|---|---|---|---|---|---|---|---|---|---|
| Benchmark | [-] | 72.5 | |||||||||||||||
| CON | [-] | 81.9 | 81.8 | 72.4 | 82.1 | 9.61 | 15.1 | 1.46 | 0.313 | 0.229 | 0.811 | 0.965 | 0.605 | 0.525 | |||
| OP | [-] | 82.0 | 81.9 | 72.4 | 82.1 | 9.72 | 15.2 | 1.47 | 0.309 | 0.230 | 0.809 | 0.965 | 0.606 | 0.525 |
Download Data |
Period Mean (original grids) [%] |
Model Period Mean (intersection) [%] |
Model Period Mean (complement) [%] |
Benchmark Period Mean (intersection) [%] |
Benchmark Period Mean (complement) [%] |
Bias [%] |
RMSE [%] |
Phase Shift [months] |
Bias Score [1] |
RMSE Score [1] |
Seasonal Cycle Score [1] |
Spatial Distribution Score [1] |
Interannual Variability Score [1] |
Overall Score [1] |
|||
|---|---|---|---|---|---|---|---|---|---|---|---|---|---|---|---|---|---|
| Benchmark | [-] | 53.0 | |||||||||||||||
| CON | [-] | 63.6 | 63.5 | 52.9 | 76.9 | 11.0 | 16.1 | 1.29 | 0.411 | 0.404 | 0.838 | 0.966 | 0.737 | 0.627 | |||
| OP | [-] | 63.6 | 63.5 | 52.9 | 76.9 | 11.1 | 16.1 | 1.29 | 0.410 | 0.404 | 0.838 | 0.967 | 0.737 | 0.627 |
Download Data |
Period Mean (original grids) [%] |
Model Period Mean (intersection) [%] |
Model Period Mean (complement) [%] |
Benchmark Period Mean (intersection) [%] |
Benchmark Period Mean (complement) [%] |
Bias [%] |
RMSE [%] |
Phase Shift [months] |
Bias Score [1] |
RMSE Score [1] |
Seasonal Cycle Score [1] |
Spatial Distribution Score [1] |
Interannual Variability Score [1] |
Overall Score [1] |
|||
|---|---|---|---|---|---|---|---|---|---|---|---|---|---|---|---|---|---|
| Benchmark | [-] | 84.8 | |||||||||||||||
| CON | [-] | 80.0 | 80.2 | 84.8 | 81.3 | -4.52 | 10.9 | 1.27 | 0.439 | 0.241 | 0.835 | 0.918 | 0.469 | 0.524 | |||
| OP | [-] | 80.2 | 80.4 | 84.8 | 81.3 | -4.32 | 10.8 | 1.27 | 0.446 | 0.242 | 0.835 | 0.920 | 0.471 | 0.526 |
Download Data |
Period Mean (original grids) [%] |
Model Period Mean (intersection) [%] |
Model Period Mean (complement) [%] |
Benchmark Period Mean (intersection) [%] |
Benchmark Period Mean (complement) [%] |
Bias [%] |
RMSE [%] |
Phase Shift [months] |
Bias Score [1] |
RMSE Score [1] |
Seasonal Cycle Score [1] |
Spatial Distribution Score [1] |
Interannual Variability Score [1] |
Overall Score [1] |
|||
|---|---|---|---|---|---|---|---|---|---|---|---|---|---|---|---|---|---|
| Benchmark | [-] | 70.2 | |||||||||||||||
| CON | [-] | 72.0 | 71.9 | 70.0 | 79.0 | 2.33 | 13.1 | 1.35 | 0.447 | 0.326 | 0.819 | 0.760 | 0.713 | 0.565 | |||
| OP | [-] | 72.1 | 71.9 | 70.0 | 79.0 | 2.40 | 13.1 | 1.35 | 0.446 | 0.327 | 0.819 | 0.760 | 0.714 | 0.565 |
Download Data |
Period Mean (original grids) [%] |
Model Period Mean (intersection) [%] |
Model Period Mean (complement) [%] |
Benchmark Period Mean (intersection) [%] |
Benchmark Period Mean (complement) [%] |
Bias [%] |
RMSE [%] |
Phase Shift [months] |
Bias Score [1] |
RMSE Score [1] |
Seasonal Cycle Score [1] |
Spatial Distribution Score [1] |
Interannual Variability Score [1] |
Overall Score [1] |
|||
|---|---|---|---|---|---|---|---|---|---|---|---|---|---|---|---|---|---|
| Benchmark | [-] | 65.1 | |||||||||||||||
| CON | [-] | 63.7 | 63.0 | 64.3 | 83.6 | 0.691 | 13.3 | 0.976 | 0.434 | 0.335 | 0.853 | 0.966 | 0.575 | 0.583 | |||
| OP | [-] | 63.8 | 63.1 | 64.3 | 83.6 | 0.751 | 13.3 | 0.985 | 0.434 | 0.335 | 0.852 | 0.966 | 0.575 | 0.583 |
Temporally integrated period mean