Mean State
Download Data |
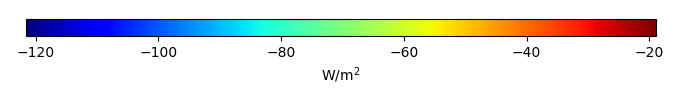
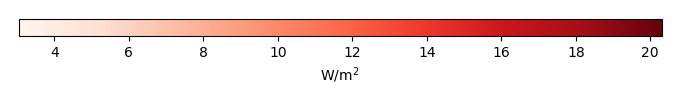
Period Mean (original grids) [W/m2] |
Model Period Mean (intersection) [W/m2] |
Model Period Mean (complement) [W/m2] |
Benchmark Period Mean (intersection) [W/m2] |
Benchmark Period Mean (complement) [W/m2] |
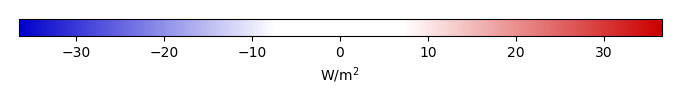
Bias [W/m2] |
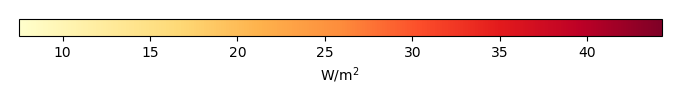
RMSE [W/m2] |
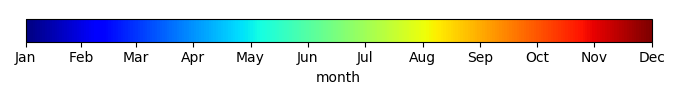
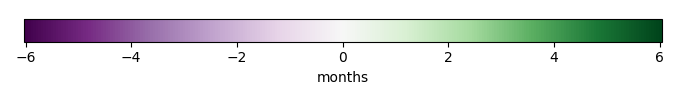
Phase Shift [months] |
Bias Score [1] |
RMSE Score [1] |
Seasonal Cycle Score [1] |
Spatial Distribution Score [1] |
Interannual Variability Score [1] |
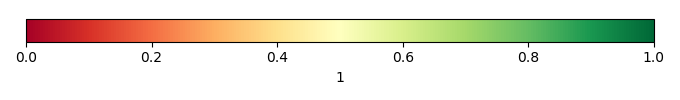
Overall Score [1] |
|||
|---|---|---|---|---|---|---|---|---|---|---|---|---|---|---|---|---|---|
| Benchmark | [-] | -56.1 | |||||||||||||||
| CON | [-] | -66.2 | -66.5 | -56.2 | -50.9 | -9.73 | 16.7 | 1.76 | 0.484 | 0.410 | 0.745 | 0.984 | 0.731 | 0.627 | |||
| OP | [-] | -65.8 | -66.1 | -56.2 | -50.9 | -9.28 | 16.5 | 1.76 | 0.490 | 0.410 | 0.745 | 0.984 | 0.730 | 0.628 |
Download Data |
Period Mean (original grids) [W/m2] |
Model Period Mean (intersection) [W/m2] |
Model Period Mean (complement) [W/m2] |
Benchmark Period Mean (intersection) [W/m2] |
Benchmark Period Mean (complement) [W/m2] |
Bias [W/m2] |
RMSE [W/m2] |
Phase Shift [months] |
Bias Score [1] |
RMSE Score [1] |
Seasonal Cycle Score [1] |
Spatial Distribution Score [1] |
Interannual Variability Score [1] |
Overall Score [1] |
|||
|---|---|---|---|---|---|---|---|---|---|---|---|---|---|---|---|---|---|
| Benchmark | [-] | -75.5 | |||||||||||||||
| CON | [-] | -99.2 | -98.6 | -75.5 | -50.1 | -22.6 | 27.6 | 0.395 | 0.447 | 0.563 | 0.959 | 0.962 | 0.700 | 0.699 | |||
| OP | [-] | -99.2 | -98.5 | -75.5 | -50.1 | -22.6 | 27.5 | 0.395 | 0.448 | 0.563 | 0.959 | 0.965 | 0.699 | 0.699 |
Download Data |
Period Mean (original grids) [W/m2] |
Model Period Mean (intersection) [W/m2] |
Model Period Mean (complement) [W/m2] |
Benchmark Period Mean (intersection) [W/m2] |
Benchmark Period Mean (complement) [W/m2] |
Bias [W/m2] |
RMSE [W/m2] |
Phase Shift [months] |
Bias Score [1] |
RMSE Score [1] |
Seasonal Cycle Score [1] |
Spatial Distribution Score [1] |
Interannual Variability Score [1] |
Overall Score [1] |
|||
|---|---|---|---|---|---|---|---|---|---|---|---|---|---|---|---|---|---|
| Benchmark | [-] | -76.3 | |||||||||||||||
| CON | [-] | -91.1 | -91.0 | -76.7 | -60.6 | -11.9 | 20.8 | 1.15 | 0.531 | 0.495 | 0.852 | 0.995 | 0.752 | 0.687 | |||
| OP | [-] | -90.8 | -90.7 | -76.7 | -60.6 | -11.6 | 20.7 | 1.16 | 0.536 | 0.495 | 0.851 | 0.994 | 0.750 | 0.687 |
Download Data |
Period Mean (original grids) [W/m2] |
Model Period Mean (intersection) [W/m2] |
Model Period Mean (complement) [W/m2] |
Benchmark Period Mean (intersection) [W/m2] |
Benchmark Period Mean (complement) [W/m2] |
Bias [W/m2] |
RMSE [W/m2] |
Phase Shift [months] |
Bias Score [1] |
RMSE Score [1] |
Seasonal Cycle Score [1] |
Spatial Distribution Score [1] |
Interannual Variability Score [1] |
Overall Score [1] |
|||
|---|---|---|---|---|---|---|---|---|---|---|---|---|---|---|---|---|---|
| Benchmark | [-] | -36.2 | |||||||||||||||
| CON | [-] | -40.0 | -40.1 | -36.0 | -39.5 | -5.12 | 18.5 | 1.64 | 0.652 | 0.367 | 0.784 | 0.922 | 0.877 | 0.662 | |||
| OP | [-] | -39.6 | -39.7 | -36.0 | -39.5 | -4.77 | 18.5 | 1.66 | 0.657 | 0.367 | 0.781 | 0.927 | 0.876 | 0.663 |
Download Data |
Period Mean (original grids) [W/m2] |
Model Period Mean (intersection) [W/m2] |
Model Period Mean (complement) [W/m2] |
Benchmark Period Mean (intersection) [W/m2] |
Benchmark Period Mean (complement) [W/m2] |
Bias [W/m2] |
RMSE [W/m2] |
Phase Shift [months] |
Bias Score [1] |
RMSE Score [1] |
Seasonal Cycle Score [1] |
Spatial Distribution Score [1] |
Interannual Variability Score [1] |
Overall Score [1] |
|||
|---|---|---|---|---|---|---|---|---|---|---|---|---|---|---|---|---|---|
| Benchmark | [-] | -46.4 | |||||||||||||||
| CON | [-] | -47.3 | -47.2 | -45.9 | -51.2 | -0.551 | 12.0 | 1.95 | 0.395 | 0.358 | 0.713 | 0.952 | 0.727 | 0.584 | |||
| OP | [-] | -46.9 | -46.8 | -45.9 | -51.2 | -0.207 | 12.0 | 1.92 | 0.396 | 0.358 | 0.718 | 0.955 | 0.727 | 0.585 |
Download Data |
Period Mean (original grids) [W/m2] |
Model Period Mean (intersection) [W/m2] |
Model Period Mean (complement) [W/m2] |
Benchmark Period Mean (intersection) [W/m2] |
Benchmark Period Mean (complement) [W/m2] |
Bias [W/m2] |
RMSE [W/m2] |
Phase Shift [months] |
Bias Score [1] |
RMSE Score [1] |
Seasonal Cycle Score [1] |
Spatial Distribution Score [1] |
Interannual Variability Score [1] |
Overall Score [1] |
|||
|---|---|---|---|---|---|---|---|---|---|---|---|---|---|---|---|---|---|
| Benchmark | [-] | -44.2 | |||||||||||||||
| CON | [-] | -52.4 | -52.2 | -44.2 | -46.9 | -8.02 | 15.2 | 1.03 | 0.580 | 0.463 | 0.881 | 0.847 | 0.886 | 0.687 | |||
| OP | [-] | -52.1 | -51.9 | -44.2 | -46.9 | -7.76 | 15.1 | 1.03 | 0.587 | 0.461 | 0.882 | 0.850 | 0.886 | 0.688 |
Download Data |
Period Mean (original grids) [W/m2] |
Model Period Mean (intersection) [W/m2] |
Model Period Mean (complement) [W/m2] |
Benchmark Period Mean (intersection) [W/m2] |
Benchmark Period Mean (complement) [W/m2] |
Bias [W/m2] |
RMSE [W/m2] |
Phase Shift [months] |
Bias Score [1] |
RMSE Score [1] |
Seasonal Cycle Score [1] |
Spatial Distribution Score [1] |
Interannual Variability Score [1] |
Overall Score [1] |
|||
|---|---|---|---|---|---|---|---|---|---|---|---|---|---|---|---|---|---|
| Benchmark | [-] | -66.8 | |||||||||||||||
| CON | [-] | -72.5 | -72.5 | -66.9 | -56.1 | -4.61 | 16.6 | 1.11 | 0.663 | 0.504 | 0.854 | 0.986 | 0.824 | 0.723 | |||
| OP | [-] | -72.3 | -72.4 | -66.9 | -56.1 | -4.48 | 16.6 | 1.09 | 0.664 | 0.504 | 0.856 | 0.987 | 0.824 | 0.723 |
Download Data |
Period Mean (original grids) [W/m2] |
Model Period Mean (intersection) [W/m2] |
Model Period Mean (complement) [W/m2] |
Benchmark Period Mean (intersection) [W/m2] |
Benchmark Period Mean (complement) [W/m2] |
Bias [W/m2] |
RMSE [W/m2] |
Phase Shift [months] |
Bias Score [1] |
RMSE Score [1] |
Seasonal Cycle Score [1] |
Spatial Distribution Score [1] |
Interannual Variability Score [1] |
Overall Score [1] |
|||
|---|---|---|---|---|---|---|---|---|---|---|---|---|---|---|---|---|---|
| Benchmark | [-] | -60.6 | |||||||||||||||
| CON | [-] | -78.6 | -79.4 | -60.8 | -53.3 | -14.4 | 21.7 | 1.09 | 0.525 | 0.524 | 0.856 | 0.990 | 0.732 | 0.692 | |||
| OP | [-] | -78.4 | -79.1 | -60.8 | -53.3 | -14.1 | 21.6 | 1.10 | 0.529 | 0.523 | 0.854 | 0.990 | 0.731 | 0.692 |
Download Data |
Period Mean (original grids) [W/m2] |
Model Period Mean (intersection) [W/m2] |
Model Period Mean (complement) [W/m2] |
Benchmark Period Mean (intersection) [W/m2] |
Benchmark Period Mean (complement) [W/m2] |
Bias [W/m2] |
RMSE [W/m2] |
Phase Shift [months] |
Bias Score [1] |
RMSE Score [1] |
Seasonal Cycle Score [1] |
Spatial Distribution Score [1] |
Interannual Variability Score [1] |
Overall Score [1] |
|||
|---|---|---|---|---|---|---|---|---|---|---|---|---|---|---|---|---|---|
| Benchmark | [-] | -32.3 | |||||||||||||||
| CON | [-] | -40.8 | -40.9 | -32.2 | -35.2 | -8.67 | 18.9 | 2.10 | 0.553 | 0.363 | 0.710 | 0.894 | 0.901 | 0.631 | |||
| OP | [-] | -40.5 | -40.6 | -32.2 | -35.2 | -8.37 | 18.7 | 2.12 | 0.563 | 0.363 | 0.707 | 0.896 | 0.900 | 0.632 |
Download Data |
Period Mean (original grids) [W/m2] |
Model Period Mean (intersection) [W/m2] |
Model Period Mean (complement) [W/m2] |
Benchmark Period Mean (intersection) [W/m2] |
Benchmark Period Mean (complement) [W/m2] |
Bias [W/m2] |
RMSE [W/m2] |
Phase Shift [months] |
Bias Score [1] |
RMSE Score [1] |
Seasonal Cycle Score [1] |
Spatial Distribution Score [1] |
Interannual Variability Score [1] |
Overall Score [1] |
|||
|---|---|---|---|---|---|---|---|---|---|---|---|---|---|---|---|---|---|
| Benchmark | [-] | -88.6 | |||||||||||||||
| CON | [-] | -98.4 | -98.7 | -89.5 | -66.2 | -4.58 | 15.3 | 0.929 | 0.653 | 0.520 | 0.875 | 0.987 | 0.831 | 0.731 | |||
| OP | [-] | -97.9 | -98.2 | -89.5 | -66.2 | -4.09 | 15.2 | 0.946 | 0.659 | 0.519 | 0.872 | 0.989 | 0.828 | 0.731 |
Download Data |
Period Mean (original grids) [W/m2] |
Model Period Mean (intersection) [W/m2] |
Model Period Mean (complement) [W/m2] |
Benchmark Period Mean (intersection) [W/m2] |
Benchmark Period Mean (complement) [W/m2] |
Bias [W/m2] |
RMSE [W/m2] |
Phase Shift [months] |
Bias Score [1] |
RMSE Score [1] |
Seasonal Cycle Score [1] |
Spatial Distribution Score [1] |
Interannual Variability Score [1] |
Overall Score [1] |
|||
|---|---|---|---|---|---|---|---|---|---|---|---|---|---|---|---|---|---|
| Benchmark | [-] | -54.5 | |||||||||||||||
| CON | [-] | -57.8 | -57.9 | -54.6 | -51.0 | -4.50 | 14.3 | 1.72 | 0.645 | 0.428 | 0.746 | 0.980 | 0.878 | 0.684 | |||
| OP | [-] | -57.6 | -57.7 | -54.6 | -51.0 | -4.30 | 14.2 | 1.72 | 0.649 | 0.427 | 0.746 | 0.979 | 0.878 | 0.684 |
Download Data |
Period Mean (original grids) [W/m2] |
Model Period Mean (intersection) [W/m2] |
Model Period Mean (complement) [W/m2] |
Benchmark Period Mean (intersection) [W/m2] |
Benchmark Period Mean (complement) [W/m2] |
Bias [W/m2] |
RMSE [W/m2] |
Phase Shift [months] |
Bias Score [1] |
RMSE Score [1] |
Seasonal Cycle Score [1] |
Spatial Distribution Score [1] |
Interannual Variability Score [1] |
Overall Score [1] |
|||
|---|---|---|---|---|---|---|---|---|---|---|---|---|---|---|---|---|---|
| Benchmark | [-] | -53.4 | |||||||||||||||
| CON | [-] | -71.4 | -71.4 | -60.5 | -49.4 | -8.74 | 18.4 | 1.41 | 0.554 | 0.456 | 0.799 | 0.976 | 0.773 | 0.669 | |||
| OP | [-] | -71.2 | -71.2 | -60.5 | -49.4 | -8.54 | 18.3 | 1.41 | 0.557 | 0.456 | 0.799 | 0.975 | 0.773 | 0.669 |
Download Data |
Period Mean (original grids) [W/m2] |
Model Period Mean (intersection) [W/m2] |
Model Period Mean (complement) [W/m2] |
Benchmark Period Mean (intersection) [W/m2] |
Benchmark Period Mean (complement) [W/m2] |
Bias [W/m2] |
RMSE [W/m2] |
Phase Shift [months] |
Bias Score [1] |
RMSE Score [1] |
Seasonal Cycle Score [1] |
Spatial Distribution Score [1] |
Interannual Variability Score [1] |
Overall Score [1] |
|||
|---|---|---|---|---|---|---|---|---|---|---|---|---|---|---|---|---|---|
| Benchmark | [-] | -100. | |||||||||||||||
| CON | [-] | -108. | -108. | -100. | -74.6 | -6.03 | 17.2 | 0.973 | 0.628 | 0.501 | 0.858 | 0.973 | 0.799 | 0.710 | |||
| OP | [-] | -108. | -108. | -100. | -74.6 | -5.98 | 17.2 | 0.973 | 0.628 | 0.501 | 0.858 | 0.975 | 0.799 | 0.710 |
Download Data |
Period Mean (original grids) [W/m2] |
Model Period Mean (intersection) [W/m2] |
Model Period Mean (complement) [W/m2] |
Benchmark Period Mean (intersection) [W/m2] |
Benchmark Period Mean (complement) [W/m2] |
Bias [W/m2] |
RMSE [W/m2] |
Phase Shift [months] |
Bias Score [1] |
RMSE Score [1] |
Seasonal Cycle Score [1] |
Spatial Distribution Score [1] |
Interannual Variability Score [1] |
Overall Score [1] |
|||
|---|---|---|---|---|---|---|---|---|---|---|---|---|---|---|---|---|---|
| Benchmark | [-] | -33.5 | |||||||||||||||
| CON | [-] | -43.4 | -43.5 | -33.5 | -35.5 | -10.5 | 19.1 | 2.15 | 0.550 | 0.392 | 0.675 | 0.987 | 0.836 | 0.639 | |||
| OP | [-] | -43.2 | -43.3 | -33.5 | -35.5 | -10.3 | 19.1 | 2.16 | 0.555 | 0.391 | 0.672 | 0.987 | 0.836 | 0.639 |
Download Data |
Period Mean (original grids) [W/m2] |
Model Period Mean (intersection) [W/m2] |
Model Period Mean (complement) [W/m2] |
Benchmark Period Mean (intersection) [W/m2] |
Benchmark Period Mean (complement) [W/m2] |
Bias [W/m2] |
RMSE [W/m2] |
Phase Shift [months] |
Bias Score [1] |
RMSE Score [1] |
Seasonal Cycle Score [1] |
Spatial Distribution Score [1] |
Interannual Variability Score [1] |
Overall Score [1] |
|||
|---|---|---|---|---|---|---|---|---|---|---|---|---|---|---|---|---|---|
| Benchmark | [-] | -66.0 | |||||||||||||||
| CON | [-] | -84.8 | -85.4 | -66.8 | -53.3 | -12.9 | 19.9 | 2.16 | 0.449 | 0.431 | 0.640 | 0.971 | 0.788 | 0.618 | |||
| OP | [-] | -84.4 | -85.0 | -66.8 | -53.3 | -12.5 | 19.7 | 2.16 | 0.457 | 0.432 | 0.640 | 0.974 | 0.786 | 0.620 |
Download Data |
Period Mean (original grids) [W/m2] |
Model Period Mean (intersection) [W/m2] |
Model Period Mean (complement) [W/m2] |
Benchmark Period Mean (intersection) [W/m2] |
Benchmark Period Mean (complement) [W/m2] |
Bias [W/m2] |
RMSE [W/m2] |
Phase Shift [months] |
Bias Score [1] |
RMSE Score [1] |
Seasonal Cycle Score [1] |
Spatial Distribution Score [1] |
Interannual Variability Score [1] |
Overall Score [1] |
|||
|---|---|---|---|---|---|---|---|---|---|---|---|---|---|---|---|---|---|
| Benchmark | [-] | -51.6 | |||||||||||||||
| CON | [-] | -62.5 | -62.8 | -51.5 | -58.7 | -11.3 | 15.7 | 1.84 | 0.415 | 0.422 | 0.706 | 0.804 | 0.889 | 0.610 | |||
| OP | [-] | -62.3 | -62.5 | -51.5 | -58.7 | -11.1 | 15.6 | 1.84 | 0.424 | 0.422 | 0.706 | 0.789 | 0.889 | 0.609 |
Download Data |
Period Mean (original grids) [W/m2] |
Model Period Mean (intersection) [W/m2] |
Model Period Mean (complement) [W/m2] |
Benchmark Period Mean (intersection) [W/m2] |
Benchmark Period Mean (complement) [W/m2] |
Bias [W/m2] |
RMSE [W/m2] |
Phase Shift [months] |
Bias Score [1] |
RMSE Score [1] |
Seasonal Cycle Score [1] |
Spatial Distribution Score [1] |
Interannual Variability Score [1] |
Overall Score [1] |
|||
|---|---|---|---|---|---|---|---|---|---|---|---|---|---|---|---|---|---|
| Benchmark | [-] | -46.1 | |||||||||||||||
| CON | [-] | -53.0 | -53.0 | -46.1 | -44.4 | -6.72 | 13.5 | 0.839 | 0.652 | 0.501 | 0.904 | 0.894 | 0.861 | 0.719 | |||
| OP | [-] | -52.7 | -52.7 | -46.1 | -44.4 | -6.43 | 13.4 | 0.834 | 0.662 | 0.498 | 0.905 | 0.892 | 0.861 | 0.719 |
Download Data |
Period Mean (original grids) [W/m2] |
Model Period Mean (intersection) [W/m2] |
Model Period Mean (complement) [W/m2] |
Benchmark Period Mean (intersection) [W/m2] |
Benchmark Period Mean (complement) [W/m2] |
Bias [W/m2] |
RMSE [W/m2] |
Phase Shift [months] |
Bias Score [1] |
RMSE Score [1] |
Seasonal Cycle Score [1] |
Spatial Distribution Score [1] |
Interannual Variability Score [1] |
Overall Score [1] |
|||
|---|---|---|---|---|---|---|---|---|---|---|---|---|---|---|---|---|---|
| Benchmark | [-] | -78.8 | |||||||||||||||
| CON | [-] | -87.6 | -88.0 | -78.9 | -64.6 | -8.10 | 17.3 | 1.19 | 0.648 | 0.540 | 0.832 | 0.995 | 0.867 | 0.737 | |||
| OP | [-] | -87.5 | -87.8 | -78.9 | -64.6 | -7.94 | 17.3 | 1.19 | 0.651 | 0.539 | 0.832 | 0.995 | 0.866 | 0.737 |
Download Data |
Period Mean (original grids) [W/m2] |
Model Period Mean (intersection) [W/m2] |
Model Period Mean (complement) [W/m2] |
Benchmark Period Mean (intersection) [W/m2] |
Benchmark Period Mean (complement) [W/m2] |
Bias [W/m2] |
RMSE [W/m2] |
Phase Shift [months] |
Bias Score [1] |
RMSE Score [1] |
Seasonal Cycle Score [1] |
Spatial Distribution Score [1] |
Interannual Variability Score [1] |
Overall Score [1] |
|||
|---|---|---|---|---|---|---|---|---|---|---|---|---|---|---|---|---|---|
| Benchmark | [-] | -39.8 | |||||||||||||||
| CON | [-] | -51.5 | -51.5 | -39.7 | -48.7 | -12.0 | 16.6 | 1.78 | 0.340 | 0.428 | 0.745 | 0.978 | 0.677 | 0.599 | |||
| OP | [-] | -51.1 | -51.1 | -39.7 | -48.7 | -11.6 | 16.3 | 1.76 | 0.350 | 0.428 | 0.750 | 0.976 | 0.676 | 0.601 |
Download Data |
Period Mean (original grids) [W/m2] |
Model Period Mean (intersection) [W/m2] |
Model Period Mean (complement) [W/m2] |
Benchmark Period Mean (intersection) [W/m2] |
Benchmark Period Mean (complement) [W/m2] |
Bias [W/m2] |
RMSE [W/m2] |
Phase Shift [months] |
Bias Score [1] |
RMSE Score [1] |
Seasonal Cycle Score [1] |
Spatial Distribution Score [1] |
Interannual Variability Score [1] |
Overall Score [1] |
|||
|---|---|---|---|---|---|---|---|---|---|---|---|---|---|---|---|---|---|
| Benchmark | [-] | -63.6 | |||||||||||||||
| CON | [-] | -72.2 | -72.6 | -63.7 | -58.0 | -8.11 | 16.1 | 1.27 | 0.623 | 0.480 | 0.829 | 0.986 | 0.764 | 0.694 | |||
| OP | [-] | -72.1 | -72.5 | -63.7 | -58.0 | -7.96 | 16.0 | 1.25 | 0.626 | 0.480 | 0.833 | 0.986 | 0.762 | 0.694 |
Download Data |
Period Mean (original grids) [W/m2] |
Model Period Mean (intersection) [W/m2] |
Model Period Mean (complement) [W/m2] |
Benchmark Period Mean (intersection) [W/m2] |
Benchmark Period Mean (complement) [W/m2] |
Bias [W/m2] |
RMSE [W/m2] |
Phase Shift [months] |
Bias Score [1] |
RMSE Score [1] |
Seasonal Cycle Score [1] |
Spatial Distribution Score [1] |
Interannual Variability Score [1] |
Overall Score [1] |
|||
|---|---|---|---|---|---|---|---|---|---|---|---|---|---|---|---|---|---|
| Benchmark | [-] | -80.2 | |||||||||||||||
| CON | [-] | -84.3 | -83.9 | -81.8 | -47.1 | 1.20 | 22.7 | 1.40 | 0.522 | 0.443 | 0.806 | 0.891 | 0.773 | 0.646 | |||
| OP | [-] | -83.9 | -83.5 | -81.8 | -47.1 | 1.52 | 22.7 | 1.41 | 0.522 | 0.443 | 0.805 | 0.888 | 0.772 | 0.646 |
Temporally integrated period mean