Mean State
Download Data |
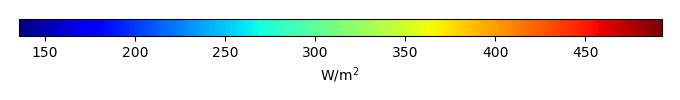
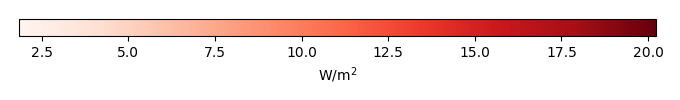
Period Mean (original grids) [W/m2] |
Model Period Mean (intersection) [W/m2] |
Model Period Mean (complement) [W/m2] |
Benchmark Period Mean (intersection) [W/m2] |
Benchmark Period Mean (complement) [W/m2] |
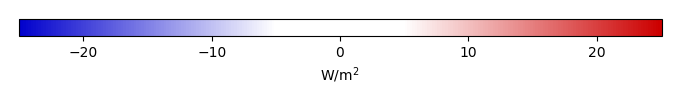
Bias [W/m2] |
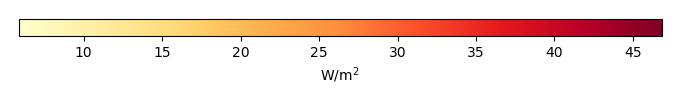
RMSE [W/m2] |
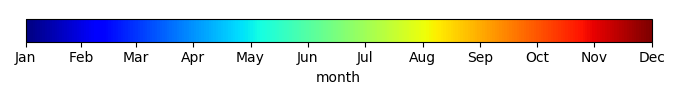
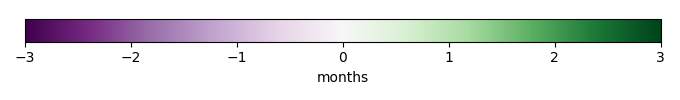
Phase Shift [months] |
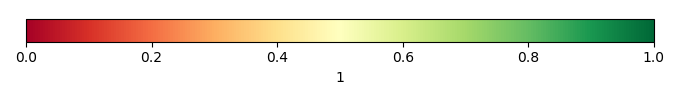
Bias Score [1] |
RMSE Score [1] |
Seasonal Cycle Score [1] |
Spatial Distribution Score [1] |
Interannual Variability Score [1] |
Overall Score [1] |
|||
|---|---|---|---|---|---|---|---|---|---|---|---|---|---|---|---|---|---|
| Benchmark | [-] | 457. | |||||||||||||||
| CON | [-] | 464. | 464. | 456. | 466. | 8.24 | 16.8 | 1.50 | 0.434 | 0.385 | 0.795 | 0.983 | 0.611 | 0.599 | |||
| OP | [-] | 464. | 464. | 456. | 466. | 7.79 | 16.6 | 1.50 | 0.436 | 0.385 | 0.795 | 0.983 | 0.610 | 0.599 |
Download Data |
Period Mean (original grids) [W/m2] |
Model Period Mean (intersection) [W/m2] |
Model Period Mean (complement) [W/m2] |
Benchmark Period Mean (intersection) [W/m2] |
Benchmark Period Mean (complement) [W/m2] |
Bias [W/m2] |
RMSE [W/m2] |
Phase Shift [months] |
Bias Score [1] |
RMSE Score [1] |
Seasonal Cycle Score [1] |
Spatial Distribution Score [1] |
Interannual Variability Score [1] |
Overall Score [1] |
|||
|---|---|---|---|---|---|---|---|---|---|---|---|---|---|---|---|---|---|
| Benchmark | [-] | 466. | |||||||||||||||
| CON | [-] | 485. | 484. | 466. | 463. | 17.7 | 24.1 | 0.682 | 0.449 | 0.499 | 0.937 | 0.937 | 0.622 | 0.657 | |||
| OP | [-] | 485. | 484. | 466. | 463. | 17.7 | 24.1 | 0.682 | 0.450 | 0.500 | 0.937 | 0.941 | 0.621 | 0.658 |
Download Data |
Period Mean (original grids) [W/m2] |
Model Period Mean (intersection) [W/m2] |
Model Period Mean (complement) [W/m2] |
Benchmark Period Mean (intersection) [W/m2] |
Benchmark Period Mean (complement) [W/m2] |
Bias [W/m2] |
RMSE [W/m2] |
Phase Shift [months] |
Bias Score [1] |
RMSE Score [1] |
Seasonal Cycle Score [1] |
Spatial Distribution Score [1] |
Interannual Variability Score [1] |
Overall Score [1] |
|||
|---|---|---|---|---|---|---|---|---|---|---|---|---|---|---|---|---|---|
| Benchmark | [-] | 443. | |||||||||||||||
| CON | [-] | 452. | 452. | 443. | 443. | 9.16 | 19.0 | 1.38 | 0.569 | 0.459 | 0.812 | 0.999 | 0.602 | 0.650 | |||
| OP | [-] | 452. | 451. | 443. | 443. | 8.85 | 18.9 | 1.40 | 0.574 | 0.459 | 0.808 | 0.999 | 0.600 | 0.650 |
Download Data |
Period Mean (original grids) [W/m2] |
Model Period Mean (intersection) [W/m2] |
Model Period Mean (complement) [W/m2] |
Benchmark Period Mean (intersection) [W/m2] |
Benchmark Period Mean (complement) [W/m2] |
Bias [W/m2] |
RMSE [W/m2] |
Phase Shift [months] |
Bias Score [1] |
RMSE Score [1] |
Seasonal Cycle Score [1] |
Spatial Distribution Score [1] |
Interannual Variability Score [1] |
Overall Score [1] |
|||
|---|---|---|---|---|---|---|---|---|---|---|---|---|---|---|---|---|---|
| Benchmark | [-] | 279. | |||||||||||||||
| CON | [-] | 277. | 278. | 278. | 296. | 2.71 | 16.3 | 0.140 | 0.892 | 0.802 | 0.989 | 1.00 | 0.741 | 0.871 | |||
| OP | [-] | 277. | 277. | 278. | 296. | 2.36 | 16.2 | 0.140 | 0.893 | 0.802 | 0.989 | 1.00 | 0.740 | 0.871 |
Download Data |
Period Mean (original grids) [W/m2] |
Model Period Mean (intersection) [W/m2] |
Model Period Mean (complement) [W/m2] |
Benchmark Period Mean (intersection) [W/m2] |
Benchmark Period Mean (complement) [W/m2] |
Bias [W/m2] |
RMSE [W/m2] |
Phase Shift [months] |
Bias Score [1] |
RMSE Score [1] |
Seasonal Cycle Score [1] |
Spatial Distribution Score [1] |
Interannual Variability Score [1] |
Overall Score [1] |
|||
|---|---|---|---|---|---|---|---|---|---|---|---|---|---|---|---|---|---|
| Benchmark | [-] | 457. | |||||||||||||||
| CON | [-] | 459. | 459. | 456. | 468. | 4.18 | 14.5 | 1.58 | 0.296 | 0.374 | 0.762 | 0.572 | 0.593 | 0.495 | |||
| OP | [-] | 459. | 459. | 456. | 468. | 3.83 | 14.5 | 1.61 | 0.298 | 0.373 | 0.757 | 0.579 | 0.592 | 0.495 |
Download Data |
Period Mean (original grids) [W/m2] |
Model Period Mean (intersection) [W/m2] |
Model Period Mean (complement) [W/m2] |
Benchmark Period Mean (intersection) [W/m2] |
Benchmark Period Mean (complement) [W/m2] |
Bias [W/m2] |
RMSE [W/m2] |
Phase Shift [months] |
Bias Score [1] |
RMSE Score [1] |
Seasonal Cycle Score [1] |
Spatial Distribution Score [1] |
Interannual Variability Score [1] |
Overall Score [1] |
|||
|---|---|---|---|---|---|---|---|---|---|---|---|---|---|---|---|---|---|
| Benchmark | [-] | 312. | |||||||||||||||
| CON | [-] | 316. | 317. | 312. | 325. | 5.34 | 11.9 | 0.0546 | 0.905 | 0.881 | 0.996 | 1.00 | 0.854 | 0.920 | |||
| OP | [-] | 316. | 316. | 312. | 325. | 5.08 | 11.8 | 0.0549 | 0.908 | 0.880 | 0.996 | 1.00 | 0.853 | 0.920 |
Download Data |
Period Mean (original grids) [W/m2] |
Model Period Mean (intersection) [W/m2] |
Model Period Mean (complement) [W/m2] |
Benchmark Period Mean (intersection) [W/m2] |
Benchmark Period Mean (complement) [W/m2] |
Bias [W/m2] |
RMSE [W/m2] |
Phase Shift [months] |
Bias Score [1] |
RMSE Score [1] |
Seasonal Cycle Score [1] |
Spatial Distribution Score [1] |
Interannual Variability Score [1] |
Overall Score [1] |
|||
|---|---|---|---|---|---|---|---|---|---|---|---|---|---|---|---|---|---|
| Benchmark | [-] | 364. | |||||||||||||||
| CON | [-] | 366. | 365. | 364. | 411. | 3.99 | 15.2 | 0.162 | 0.846 | 0.818 | 0.988 | 0.997 | 0.761 | 0.871 | |||
| OP | [-] | 366. | 365. | 364. | 411. | 3.87 | 15.2 | 0.167 | 0.847 | 0.817 | 0.988 | 0.997 | 0.760 | 0.871 |
Download Data |
Period Mean (original grids) [W/m2] |
Model Period Mean (intersection) [W/m2] |
Model Period Mean (complement) [W/m2] |
Benchmark Period Mean (intersection) [W/m2] |
Benchmark Period Mean (complement) [W/m2] |
Bias [W/m2] |
RMSE [W/m2] |
Phase Shift [months] |
Bias Score [1] |
RMSE Score [1] |
Seasonal Cycle Score [1] |
Spatial Distribution Score [1] |
Interannual Variability Score [1] |
Overall Score [1] |
|||
|---|---|---|---|---|---|---|---|---|---|---|---|---|---|---|---|---|---|
| Benchmark | [-] | 448. | |||||||||||||||
| CON | [-] | 453. | 453. | 447. | 464. | 9.07 | 19.5 | 0.871 | 0.576 | 0.547 | 0.904 | 0.988 | 0.628 | 0.698 | |||
| OP | [-] | 453. | 453. | 447. | 464. | 8.79 | 19.5 | 0.898 | 0.580 | 0.546 | 0.900 | 0.987 | 0.627 | 0.698 |
Download Data |
Period Mean (original grids) [W/m2] |
Model Period Mean (intersection) [W/m2] |
Model Period Mean (complement) [W/m2] |
Benchmark Period Mean (intersection) [W/m2] |
Benchmark Period Mean (complement) [W/m2] |
Bias [W/m2] |
RMSE [W/m2] |
Phase Shift [months] |
Bias Score [1] |
RMSE Score [1] |
Seasonal Cycle Score [1] |
Spatial Distribution Score [1] |
Interannual Variability Score [1] |
Overall Score [1] |
|||
|---|---|---|---|---|---|---|---|---|---|---|---|---|---|---|---|---|---|
| Benchmark | [-] | 281. | |||||||||||||||
| CON | [-] | 284. | 285. | 281. | 278. | 4.53 | 13.8 | 0.108 | 0.904 | 0.820 | 0.992 | 0.999 | 0.761 | 0.883 | |||
| OP | [-] | 284. | 284. | 281. | 278. | 4.24 | 13.7 | 0.108 | 0.907 | 0.820 | 0.992 | 0.999 | 0.760 | 0.883 |
Download Data |
Period Mean (original grids) [W/m2] |
Model Period Mean (intersection) [W/m2] |
Model Period Mean (complement) [W/m2] |
Benchmark Period Mean (intersection) [W/m2] |
Benchmark Period Mean (complement) [W/m2] |
Bias [W/m2] |
RMSE [W/m2] |
Phase Shift [months] |
Bias Score [1] |
RMSE Score [1] |
Seasonal Cycle Score [1] |
Spatial Distribution Score [1] |
Interannual Variability Score [1] |
Overall Score [1] |
|||
|---|---|---|---|---|---|---|---|---|---|---|---|---|---|---|---|---|---|
| Benchmark | [-] | 441. | |||||||||||||||
| CON | [-] | 449. | 450. | 442. | 425. | 3.77 | 13.8 | 0.410 | 0.774 | 0.680 | 0.966 | 0.991 | 0.736 | 0.805 | |||
| OP | [-] | 449. | 449. | 442. | 425. | 3.28 | 13.8 | 0.412 | 0.778 | 0.679 | 0.966 | 0.992 | 0.735 | 0.805 |
Download Data |
Period Mean (original grids) [W/m2] |
Model Period Mean (intersection) [W/m2] |
Model Period Mean (complement) [W/m2] |
Benchmark Period Mean (intersection) [W/m2] |
Benchmark Period Mean (complement) [W/m2] |
Bias [W/m2] |
RMSE [W/m2] |
Phase Shift [months] |
Bias Score [1] |
RMSE Score [1] |
Seasonal Cycle Score [1] |
Spatial Distribution Score [1] |
Interannual Variability Score [1] |
Overall Score [1] |
|||
|---|---|---|---|---|---|---|---|---|---|---|---|---|---|---|---|---|---|
| Benchmark | [-] | 368. | |||||||||||||||
| CON | [-] | 364. | 364. | 368. | 376. | 1.24 | 13.0 | 0.424 | 0.836 | 0.752 | 0.971 | 1.00 | 0.769 | 0.847 | |||
| OP | [-] | 364. | 364. | 368. | 376. | 1.04 | 13.0 | 0.474 | 0.836 | 0.752 | 0.968 | 1.00 | 0.768 | 0.846 |
Download Data |
Period Mean (original grids) [W/m2] |
Model Period Mean (intersection) [W/m2] |
Model Period Mean (complement) [W/m2] |
Benchmark Period Mean (intersection) [W/m2] |
Benchmark Period Mean (complement) [W/m2] |
Bias [W/m2] |
RMSE [W/m2] |
Phase Shift [months] |
Bias Score [1] |
RMSE Score [1] |
Seasonal Cycle Score [1] |
Spatial Distribution Score [1] |
Interannual Variability Score [1] |
Overall Score [1] |
|||
|---|---|---|---|---|---|---|---|---|---|---|---|---|---|---|---|---|---|
| Benchmark | [-] | 399. | |||||||||||||||
| CON | [-] | 381. | 381. | 379. | 410. | 6.04 | 16.7 | 0.570 | 0.700 | 0.648 | 0.936 | 0.999 | 0.694 | 0.771 | |||
| OP | [-] | 381. | 381. | 379. | 410. | 5.84 | 16.6 | 0.578 | 0.701 | 0.648 | 0.935 | 0.999 | 0.693 | 0.771 |
Download Data |
Period Mean (original grids) [W/m2] |
Model Period Mean (intersection) [W/m2] |
Model Period Mean (complement) [W/m2] |
Benchmark Period Mean (intersection) [W/m2] |
Benchmark Period Mean (complement) [W/m2] |
Bias [W/m2] |
RMSE [W/m2] |
Phase Shift [months] |
Bias Score [1] |
RMSE Score [1] |
Seasonal Cycle Score [1] |
Spatial Distribution Score [1] |
Interannual Variability Score [1] |
Overall Score [1] |
|||
|---|---|---|---|---|---|---|---|---|---|---|---|---|---|---|---|---|---|
| Benchmark | [-] | 450. | |||||||||||||||
| CON | [-] | 452. | 452. | 450. | 435. | 2.18 | 16.0 | 0.375 | 0.826 | 0.748 | 0.972 | 1.00 | 0.715 | 0.835 | |||
| OP | [-] | 452. | 452. | 450. | 435. | 2.13 | 16.0 | 0.376 | 0.826 | 0.748 | 0.972 | 1.00 | 0.715 | 0.835 |
Download Data |
Period Mean (original grids) [W/m2] |
Model Period Mean (intersection) [W/m2] |
Model Period Mean (complement) [W/m2] |
Benchmark Period Mean (intersection) [W/m2] |
Benchmark Period Mean (complement) [W/m2] |
Bias [W/m2] |
RMSE [W/m2] |
Phase Shift [months] |
Bias Score [1] |
RMSE Score [1] |
Seasonal Cycle Score [1] |
Spatial Distribution Score [1] |
Interannual Variability Score [1] |
Overall Score [1] |
|||
|---|---|---|---|---|---|---|---|---|---|---|---|---|---|---|---|---|---|
| Benchmark | [-] | 281. | |||||||||||||||
| CON | [-] | 287. | 287. | 281. | 295. | 6.54 | 17.4 | 0.185 | 0.875 | 0.785 | 0.986 | 0.999 | 0.761 | 0.865 | |||
| OP | [-] | 287. | 287. | 281. | 295. | 6.38 | 17.4 | 0.185 | 0.877 | 0.784 | 0.986 | 0.999 | 0.761 | 0.865 |
Download Data |
Period Mean (original grids) [W/m2] |
Model Period Mean (intersection) [W/m2] |
Model Period Mean (complement) [W/m2] |
Benchmark Period Mean (intersection) [W/m2] |
Benchmark Period Mean (complement) [W/m2] |
Bias [W/m2] |
RMSE [W/m2] |
Phase Shift [months] |
Bias Score [1] |
RMSE Score [1] |
Seasonal Cycle Score [1] |
Spatial Distribution Score [1] |
Interannual Variability Score [1] |
Overall Score [1] |
|||
|---|---|---|---|---|---|---|---|---|---|---|---|---|---|---|---|---|---|
| Benchmark | [-] | 442. | |||||||||||||||
| CON | [-] | 448. | 447. | 441. | 461. | 11.6 | 18.9 | 0.962 | 0.511 | 0.541 | 0.886 | 0.948 | 0.677 | 0.684 | |||
| OP | [-] | 448. | 447. | 441. | 461. | 11.2 | 18.7 | 0.950 | 0.516 | 0.541 | 0.887 | 0.951 | 0.676 | 0.685 |
Download Data |
Period Mean (original grids) [W/m2] |
Model Period Mean (intersection) [W/m2] |
Model Period Mean (complement) [W/m2] |
Benchmark Period Mean (intersection) [W/m2] |
Benchmark Period Mean (complement) [W/m2] |
Bias [W/m2] |
RMSE [W/m2] |
Phase Shift [months] |
Bias Score [1] |
RMSE Score [1] |
Seasonal Cycle Score [1] |
Spatial Distribution Score [1] |
Interannual Variability Score [1] |
Overall Score [1] |
|||
|---|---|---|---|---|---|---|---|---|---|---|---|---|---|---|---|---|---|
| Benchmark | [-] | 386. | |||||||||||||||
| CON | [-] | 391. | 391. | 386. | 422. | 9.05 | 13.5 | 0.148 | 0.813 | 0.847 | 0.990 | 0.989 | 0.841 | 0.888 | |||
| OP | [-] | 391. | 391. | 386. | 422. | 8.84 | 13.4 | 0.148 | 0.816 | 0.846 | 0.990 | 0.988 | 0.840 | 0.888 |
Download Data |
Period Mean (original grids) [W/m2] |
Model Period Mean (intersection) [W/m2] |
Model Period Mean (complement) [W/m2] |
Benchmark Period Mean (intersection) [W/m2] |
Benchmark Period Mean (complement) [W/m2] |
Bias [W/m2] |
RMSE [W/m2] |
Phase Shift [months] |
Bias Score [1] |
RMSE Score [1] |
Seasonal Cycle Score [1] |
Spatial Distribution Score [1] |
Interannual Variability Score [1] |
Overall Score [1] |
|||
|---|---|---|---|---|---|---|---|---|---|---|---|---|---|---|---|---|---|
| Benchmark | [-] | 324. | |||||||||||||||
| CON | [-] | 328. | 328. | 324. | 352. | 5.57 | 13.5 | 0.107 | 0.874 | 0.825 | 0.993 | 0.977 | 0.780 | 0.879 | |||
| OP | [-] | 328. | 328. | 324. | 352. | 5.28 | 13.5 | 0.110 | 0.877 | 0.824 | 0.992 | 0.977 | 0.780 | 0.879 |
Download Data |
Period Mean (original grids) [W/m2] |
Model Period Mean (intersection) [W/m2] |
Model Period Mean (complement) [W/m2] |
Benchmark Period Mean (intersection) [W/m2] |
Benchmark Period Mean (complement) [W/m2] |
Bias [W/m2] |
RMSE [W/m2] |
Phase Shift [months] |
Bias Score [1] |
RMSE Score [1] |
Seasonal Cycle Score [1] |
Spatial Distribution Score [1] |
Interannual Variability Score [1] |
Overall Score [1] |
|||
|---|---|---|---|---|---|---|---|---|---|---|---|---|---|---|---|---|---|
| Benchmark | [-] | 377. | |||||||||||||||
| CON | [-] | 382. | 382. | 377. | 395. | 5.47 | 15.4 | 0.123 | 0.819 | 0.802 | 0.992 | 0.996 | 0.750 | 0.860 | |||
| OP | [-] | 382. | 382. | 377. | 395. | 5.31 | 15.3 | 0.123 | 0.820 | 0.801 | 0.992 | 0.997 | 0.749 | 0.860 |
Download Data |
Period Mean (original grids) [W/m2] |
Model Period Mean (intersection) [W/m2] |
Model Period Mean (complement) [W/m2] |
Benchmark Period Mean (intersection) [W/m2] |
Benchmark Period Mean (complement) [W/m2] |
Bias [W/m2] |
RMSE [W/m2] |
Phase Shift [months] |
Bias Score [1] |
RMSE Score [1] |
Seasonal Cycle Score [1] |
Spatial Distribution Score [1] |
Interannual Variability Score [1] |
Overall Score [1] |
|||
|---|---|---|---|---|---|---|---|---|---|---|---|---|---|---|---|---|---|
| Benchmark | [-] | 449. | |||||||||||||||
| CON | [-] | 459. | 458. | 449. | 464. | 9.05 | 15.3 | 1.17 | 0.323 | 0.397 | 0.842 | 0.990 | 0.620 | 0.595 | |||
| OP | [-] | 458. | 458. | 449. | 464. | 8.65 | 15.0 | 1.19 | 0.334 | 0.395 | 0.838 | 0.990 | 0.619 | 0.595 |
Download Data |
Period Mean (original grids) [W/m2] |
Model Period Mean (intersection) [W/m2] |
Model Period Mean (complement) [W/m2] |
Benchmark Period Mean (intersection) [W/m2] |
Benchmark Period Mean (complement) [W/m2] |
Bias [W/m2] |
RMSE [W/m2] |
Phase Shift [months] |
Bias Score [1] |
RMSE Score [1] |
Seasonal Cycle Score [1] |
Spatial Distribution Score [1] |
Interannual Variability Score [1] |
Overall Score [1] |
|||
|---|---|---|---|---|---|---|---|---|---|---|---|---|---|---|---|---|---|
| Benchmark | [-] | 443. | |||||||||||||||
| CON | [-] | 449. | 449. | 443. | 442. | 5.06 | 14.6 | 0.996 | 0.686 | 0.558 | 0.850 | 0.990 | 0.658 | 0.717 | |||
| OP | [-] | 449. | 449. | 443. | 442. | 4.91 | 14.6 | 1.01 | 0.687 | 0.558 | 0.847 | 0.990 | 0.656 | 0.716 |
Download Data |
Period Mean (original grids) [W/m2] |
Model Period Mean (intersection) [W/m2] |
Model Period Mean (complement) [W/m2] |
Benchmark Period Mean (intersection) [W/m2] |
Benchmark Period Mean (complement) [W/m2] |
Bias [W/m2] |
RMSE [W/m2] |
Phase Shift [months] |
Bias Score [1] |
RMSE Score [1] |
Seasonal Cycle Score [1] |
Spatial Distribution Score [1] |
Interannual Variability Score [1] |
Overall Score [1] |
|||
|---|---|---|---|---|---|---|---|---|---|---|---|---|---|---|---|---|---|
| Benchmark | [-] | 383. | |||||||||||||||
| CON | [-] | 387. | 386. | 382. | 399. | 5.35 | 21.7 | 0.930 | 0.596 | 0.558 | 0.884 | 0.999 | 0.637 | 0.705 | |||
| OP | [-] | 386. | 386. | 382. | 399. | 5.03 | 21.6 | 0.920 | 0.600 | 0.558 | 0.885 | 0.999 | 0.637 | 0.706 |
Temporally integrated period mean