Mean State
Download Data |
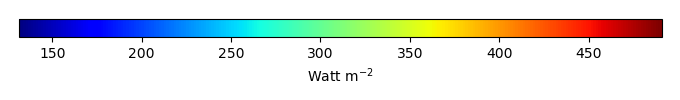
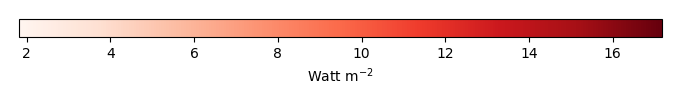
Period Mean (original grids) [Watt m-2] |
Model Period Mean (intersection) [Watt m-2] |
Model Period Mean (complement) [Watt m-2] |
Benchmark Period Mean (intersection) [Watt m-2] |
Benchmark Period Mean (complement) [Watt m-2] |
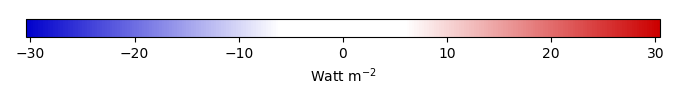
Bias [Watt m-2] |
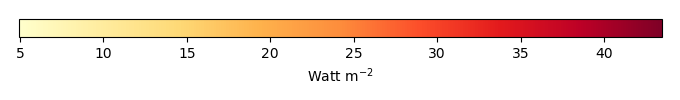
RMSE [Watt m-2] |
Phase Shift [months] |
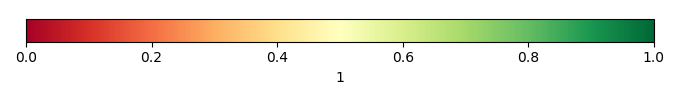
Bias Score [1] |
RMSE Score [1] |
Seasonal Cycle Score [1] |
Spatial Distribution Score [1] |
Interannual Variability Score [1] |
Overall Score [1] |
|||
|---|---|---|---|---|---|---|---|---|---|---|---|---|---|---|---|---|---|
| Benchmark | [-] | 453. | |||||||||||||||
| CON | [-] | 463. | 463. | 453. | 462. | 10.5 | 16.6 | 1.57 | 0.287 | 0.383 | 0.788 | 0.984 | 0.740 | 0.594 | |||
| OP | [-] | 462. | 462. | 453. | 462. | 10.1 | 16.3 | 1.62 | 0.298 | 0.382 | 0.780 | 0.984 | 0.738 | 0.594 |
Download Data |
Period Mean (original grids) [Watt m-2] |
Model Period Mean (intersection) [Watt m-2] |
Model Period Mean (complement) [Watt m-2] |
Benchmark Period Mean (intersection) [Watt m-2] |
Benchmark Period Mean (complement) [Watt m-2] |
Bias [Watt m-2] |
RMSE [Watt m-2] |
Phase Shift [months] |
Bias Score [1] |
RMSE Score [1] |
Seasonal Cycle Score [1] |
Spatial Distribution Score [1] |
Interannual Variability Score [1] |
Overall Score [1] |
|||
|---|---|---|---|---|---|---|---|---|---|---|---|---|---|---|---|---|---|
| Benchmark | [-] | 471. | |||||||||||||||
| CON | [-] | 483. | 482. | 471. | 460. | 11.5 | 21.5 | 0.723 | 0.534 | 0.498 | 0.941 | 0.934 | 0.704 | 0.685 | |||
| OP | [-] | 483. | 482. | 471. | 460. | 11.4 | 21.5 | 0.714 | 0.535 | 0.498 | 0.942 | 0.938 | 0.704 | 0.686 |
Download Data |
Period Mean (original grids) [Watt m-2] |
Model Period Mean (intersection) [Watt m-2] |
Model Period Mean (complement) [Watt m-2] |
Benchmark Period Mean (intersection) [Watt m-2] |
Benchmark Period Mean (complement) [Watt m-2] |
Bias [Watt m-2] |
RMSE [Watt m-2] |
Phase Shift [months] |
Bias Score [1] |
RMSE Score [1] |
Seasonal Cycle Score [1] |
Spatial Distribution Score [1] |
Interannual Variability Score [1] |
Overall Score [1] |
|||
|---|---|---|---|---|---|---|---|---|---|---|---|---|---|---|---|---|---|
| Benchmark | [-] | 443. | |||||||||||||||
| CON | [-] | 451. | 451. | 443. | 442. | 7.98 | 18.8 | 1.23 | 0.544 | 0.480 | 0.845 | 0.983 | 0.601 | 0.655 | |||
| OP | [-] | 451. | 451. | 443. | 442. | 7.65 | 18.7 | 1.23 | 0.548 | 0.479 | 0.845 | 0.983 | 0.599 | 0.656 |
Download Data |
Period Mean (original grids) [Watt m-2] |
Model Period Mean (intersection) [Watt m-2] |
Model Period Mean (complement) [Watt m-2] |
Benchmark Period Mean (intersection) [Watt m-2] |
Benchmark Period Mean (complement) [Watt m-2] |
Bias [Watt m-2] |
RMSE [Watt m-2] |
Phase Shift [months] |
Bias Score [1] |
RMSE Score [1] |
Seasonal Cycle Score [1] |
Spatial Distribution Score [1] |
Interannual Variability Score [1] |
Overall Score [1] |
|||
|---|---|---|---|---|---|---|---|---|---|---|---|---|---|---|---|---|---|
| Benchmark | [-] | 276. | |||||||||||||||
| CON | [-] | 276. | 276. | 276. | 291. | 4.24 | 16.7 | 0.0800 | 0.890 | 0.795 | 0.995 | 0.989 | 0.785 | 0.875 | |||
| OP | [-] | 276. | 276. | 276. | 291. | 3.89 | 16.5 | 0.0800 | 0.892 | 0.796 | 0.995 | 0.988 | 0.785 | 0.875 |
Download Data |
Period Mean (original grids) [Watt m-2] |
Model Period Mean (intersection) [Watt m-2] |
Model Period Mean (complement) [Watt m-2] |
Benchmark Period Mean (intersection) [Watt m-2] |
Benchmark Period Mean (complement) [Watt m-2] |
Bias [Watt m-2] |
RMSE [Watt m-2] |
Phase Shift [months] |
Bias Score [1] |
RMSE Score [1] |
Seasonal Cycle Score [1] |
Spatial Distribution Score [1] |
Interannual Variability Score [1] |
Overall Score [1] |
|||
|---|---|---|---|---|---|---|---|---|---|---|---|---|---|---|---|---|---|
| Benchmark | [-] | 456. | |||||||||||||||
| CON | [-] | 459. | 458. | 455. | 466. | 4.92 | 9.84 | 1.68 | 0.319 | 0.410 | 0.750 | 0.878 | 0.707 | 0.579 | |||
| OP | [-] | 458. | 458. | 455. | 466. | 4.56 | 9.74 | 1.68 | 0.321 | 0.409 | 0.750 | 0.884 | 0.707 | 0.580 |
Download Data |
Period Mean (original grids) [Watt m-2] |
Model Period Mean (intersection) [Watt m-2] |
Model Period Mean (complement) [Watt m-2] |
Benchmark Period Mean (intersection) [Watt m-2] |
Benchmark Period Mean (complement) [Watt m-2] |
Bias [Watt m-2] |
RMSE [Watt m-2] |
Phase Shift [months] |
Bias Score [1] |
RMSE Score [1] |
Seasonal Cycle Score [1] |
Spatial Distribution Score [1] |
Interannual Variability Score [1] |
Overall Score [1] |
|||
|---|---|---|---|---|---|---|---|---|---|---|---|---|---|---|---|---|---|
| Benchmark | [-] | 306. | |||||||||||||||
| CON | [-] | 316. | 316. | 306. | 318. | 10.2 | 15.2 | 0.0241 | 0.855 | 0.859 | 0.998 | 0.995 | 0.893 | 0.910 | |||
| OP | [-] | 316. | 316. | 306. | 318. | 9.94 | 15.2 | 0.0241 | 0.858 | 0.858 | 0.998 | 0.995 | 0.893 | 0.910 |
Download Data |
Period Mean (original grids) [Watt m-2] |
Model Period Mean (intersection) [Watt m-2] |
Model Period Mean (complement) [Watt m-2] |
Benchmark Period Mean (intersection) [Watt m-2] |
Benchmark Period Mean (complement) [Watt m-2] |
Bias [Watt m-2] |
RMSE [Watt m-2] |
Phase Shift [months] |
Bias Score [1] |
RMSE Score [1] |
Seasonal Cycle Score [1] |
Spatial Distribution Score [1] |
Interannual Variability Score [1] |
Overall Score [1] |
|||
|---|---|---|---|---|---|---|---|---|---|---|---|---|---|---|---|---|---|
| Benchmark | [-] | 362. | |||||||||||||||
| CON | [-] | 365. | 364. | 362. | 409. | 4.99 | 15.8 | 0.153 | 0.851 | 0.816 | 0.989 | 0.994 | 0.728 | 0.866 | |||
| OP | [-] | 365. | 364. | 362. | 409. | 4.87 | 15.8 | 0.154 | 0.852 | 0.815 | 0.989 | 0.994 | 0.728 | 0.865 |
Download Data |
Period Mean (original grids) [Watt m-2] |
Model Period Mean (intersection) [Watt m-2] |
Model Period Mean (complement) [Watt m-2] |
Benchmark Period Mean (intersection) [Watt m-2] |
Benchmark Period Mean (complement) [Watt m-2] |
Bias [Watt m-2] |
RMSE [Watt m-2] |
Phase Shift [months] |
Bias Score [1] |
RMSE Score [1] |
Seasonal Cycle Score [1] |
Spatial Distribution Score [1] |
Interannual Variability Score [1] |
Overall Score [1] |
|||
|---|---|---|---|---|---|---|---|---|---|---|---|---|---|---|---|---|---|
| Benchmark | [-] | 449. | |||||||||||||||
| CON | [-] | 452. | 452. | 449. | 461. | 6.04 | 17.5 | 0.770 | 0.594 | 0.561 | 0.918 | 0.998 | 0.642 | 0.712 | |||
| OP | [-] | 451. | 451. | 449. | 461. | 5.75 | 17.5 | 0.792 | 0.599 | 0.560 | 0.915 | 0.998 | 0.641 | 0.712 |
Download Data |
Period Mean (original grids) [Watt m-2] |
Model Period Mean (intersection) [Watt m-2] |
Model Period Mean (complement) [Watt m-2] |
Benchmark Period Mean (intersection) [Watt m-2] |
Benchmark Period Mean (complement) [Watt m-2] |
Bias [Watt m-2] |
RMSE [Watt m-2] |
Phase Shift [months] |
Bias Score [1] |
RMSE Score [1] |
Seasonal Cycle Score [1] |
Spatial Distribution Score [1] |
Interannual Variability Score [1] |
Overall Score [1] |
|||
|---|---|---|---|---|---|---|---|---|---|---|---|---|---|---|---|---|---|
| Benchmark | [-] | 275. | |||||||||||||||
| CON | [-] | 282. | 283. | 275. | 270. | 8.98 | 16.3 | 0.0515 | 0.856 | 0.810 | 0.996 | 0.995 | 0.848 | 0.886 | |||
| OP | [-] | 282. | 282. | 275. | 270. | 8.70 | 16.1 | 0.0515 | 0.859 | 0.812 | 0.996 | 0.994 | 0.847 | 0.887 |
Download Data |
Period Mean (original grids) [Watt m-2] |
Model Period Mean (intersection) [Watt m-2] |
Model Period Mean (complement) [Watt m-2] |
Benchmark Period Mean (intersection) [Watt m-2] |
Benchmark Period Mean (complement) [Watt m-2] |
Bias [Watt m-2] |
RMSE [Watt m-2] |
Phase Shift [months] |
Bias Score [1] |
RMSE Score [1] |
Seasonal Cycle Score [1] |
Spatial Distribution Score [1] |
Interannual Variability Score [1] |
Overall Score [1] |
|||
|---|---|---|---|---|---|---|---|---|---|---|---|---|---|---|---|---|---|
| Benchmark | [-] | 447. | |||||||||||||||
| CON | [-] | 450. | 450. | 448. | 424. | -1.88 | 14.8 | 0.362 | 0.766 | 0.697 | 0.971 | 0.995 | 0.700 | 0.804 | |||
| OP | [-] | 449. | 450. | 448. | 424. | -2.37 | 15.0 | 0.377 | 0.763 | 0.696 | 0.969 | 0.995 | 0.700 | 0.803 |
Download Data |
Period Mean (original grids) [Watt m-2] |
Model Period Mean (intersection) [Watt m-2] |
Model Period Mean (complement) [Watt m-2] |
Benchmark Period Mean (intersection) [Watt m-2] |
Benchmark Period Mean (complement) [Watt m-2] |
Bias [Watt m-2] |
RMSE [Watt m-2] |
Phase Shift [months] |
Bias Score [1] |
RMSE Score [1] |
Seasonal Cycle Score [1] |
Spatial Distribution Score [1] |
Interannual Variability Score [1] |
Overall Score [1] |
|||
|---|---|---|---|---|---|---|---|---|---|---|---|---|---|---|---|---|---|
| Benchmark | [-] | 365. | |||||||||||||||
| CON | [-] | 363. | 363. | 365. | 372. | 3.64 | 11.7 | 0.472 | 0.837 | 0.796 | 0.968 | 0.995 | 0.814 | 0.868 | |||
| OP | [-] | 363. | 363. | 365. | 372. | 3.44 | 11.7 | 0.486 | 0.839 | 0.795 | 0.967 | 0.995 | 0.814 | 0.867 |
Download Data |
Period Mean (original grids) [Watt m-2] |
Model Period Mean (intersection) [Watt m-2] |
Model Period Mean (complement) [Watt m-2] |
Benchmark Period Mean (intersection) [Watt m-2] |
Benchmark Period Mean (complement) [Watt m-2] |
Bias [Watt m-2] |
RMSE [Watt m-2] |
Phase Shift [months] |
Bias Score [1] |
RMSE Score [1] |
Seasonal Cycle Score [1] |
Spatial Distribution Score [1] |
Interannual Variability Score [1] |
Overall Score [1] |
|||
|---|---|---|---|---|---|---|---|---|---|---|---|---|---|---|---|---|---|
| Benchmark | [-] | 397. | |||||||||||||||
| CON | [-] | 380. | 380. | 379. | 407. | 5.16 | 16.6 | 0.545 | 0.672 | 0.669 | 0.941 | 0.998 | 0.737 | 0.781 | |||
| OP | [-] | 379. | 379. | 379. | 407. | 4.95 | 16.5 | 0.552 | 0.675 | 0.669 | 0.940 | 0.998 | 0.736 | 0.781 |
Download Data |
Period Mean (original grids) [Watt m-2] |
Model Period Mean (intersection) [Watt m-2] |
Model Period Mean (complement) [Watt m-2] |
Benchmark Period Mean (intersection) [Watt m-2] |
Benchmark Period Mean (complement) [Watt m-2] |
Bias [Watt m-2] |
RMSE [Watt m-2] |
Phase Shift [months] |
Bias Score [1] |
RMSE Score [1] |
Seasonal Cycle Score [1] |
Spatial Distribution Score [1] |
Interannual Variability Score [1] |
Overall Score [1] |
|||
|---|---|---|---|---|---|---|---|---|---|---|---|---|---|---|---|---|---|
| Benchmark | [-] | 463. | |||||||||||||||
| CON | [-] | 450. | 450. | 464. | 430. | -13.8 | 23.3 | 0.459 | 0.707 | 0.731 | 0.964 | 0.977 | 0.644 | 0.792 | |||
| OP | [-] | 450. | 450. | 464. | 430. | -13.8 | 23.3 | 0.459 | 0.707 | 0.731 | 0.964 | 0.977 | 0.644 | 0.792 |
Download Data |
Period Mean (original grids) [Watt m-2] |
Model Period Mean (intersection) [Watt m-2] |
Model Period Mean (complement) [Watt m-2] |
Benchmark Period Mean (intersection) [Watt m-2] |
Benchmark Period Mean (complement) [Watt m-2] |
Bias [Watt m-2] |
RMSE [Watt m-2] |
Phase Shift [months] |
Bias Score [1] |
RMSE Score [1] |
Seasonal Cycle Score [1] |
Spatial Distribution Score [1] |
Interannual Variability Score [1] |
Overall Score [1] |
|||
|---|---|---|---|---|---|---|---|---|---|---|---|---|---|---|---|---|---|
| Benchmark | [-] | 278. | |||||||||||||||
| CON | [-] | 286. | 286. | 278. | 294. | 9.18 | 15.3 | 0.0693 | 0.845 | 0.827 | 0.995 | 0.995 | 0.805 | 0.882 | |||
| OP | [-] | 286. | 286. | 278. | 294. | 9.03 | 15.2 | 0.0693 | 0.846 | 0.827 | 0.995 | 0.995 | 0.805 | 0.883 |
Download Data |
Period Mean (original grids) [Watt m-2] |
Model Period Mean (intersection) [Watt m-2] |
Model Period Mean (complement) [Watt m-2] |
Benchmark Period Mean (intersection) [Watt m-2] |
Benchmark Period Mean (complement) [Watt m-2] |
Bias [Watt m-2] |
RMSE [Watt m-2] |
Phase Shift [months] |
Bias Score [1] |
RMSE Score [1] |
Seasonal Cycle Score [1] |
Spatial Distribution Score [1] |
Interannual Variability Score [1] |
Overall Score [1] |
|||
|---|---|---|---|---|---|---|---|---|---|---|---|---|---|---|---|---|---|
| Benchmark | [-] | 445. | |||||||||||||||
| CON | [-] | 448. | 447. | 444. | 457. | 8.57 | 15.1 | 0.780 | 0.519 | 0.570 | 0.922 | 0.981 | 0.707 | 0.711 | |||
| OP | [-] | 447. | 447. | 444. | 457. | 8.19 | 14.9 | 0.776 | 0.527 | 0.570 | 0.923 | 0.979 | 0.707 | 0.713 |
Download Data |
Period Mean (original grids) [Watt m-2] |
Model Period Mean (intersection) [Watt m-2] |
Model Period Mean (complement) [Watt m-2] |
Benchmark Period Mean (intersection) [Watt m-2] |
Benchmark Period Mean (complement) [Watt m-2] |
Bias [Watt m-2] |
RMSE [Watt m-2] |
Phase Shift [months] |
Bias Score [1] |
RMSE Score [1] |
Seasonal Cycle Score [1] |
Spatial Distribution Score [1] |
Interannual Variability Score [1] |
Overall Score [1] |
|||
|---|---|---|---|---|---|---|---|---|---|---|---|---|---|---|---|---|---|
| Benchmark | [-] | 386. | |||||||||||||||
| CON | [-] | 390. | 390. | 385. | 422. | 8.91 | 12.3 | 0.232 | 0.814 | 0.853 | 0.984 | 0.999 | 0.850 | 0.892 | |||
| OP | [-] | 390. | 390. | 385. | 422. | 8.69 | 12.3 | 0.230 | 0.817 | 0.852 | 0.985 | 0.999 | 0.850 | 0.892 |
Download Data |
Period Mean (original grids) [Watt m-2] |
Model Period Mean (intersection) [Watt m-2] |
Model Period Mean (complement) [Watt m-2] |
Benchmark Period Mean (intersection) [Watt m-2] |
Benchmark Period Mean (complement) [Watt m-2] |
Bias [Watt m-2] |
RMSE [Watt m-2] |
Phase Shift [months] |
Bias Score [1] |
RMSE Score [1] |
Seasonal Cycle Score [1] |
Spatial Distribution Score [1] |
Interannual Variability Score [1] |
Overall Score [1] |
|||
|---|---|---|---|---|---|---|---|---|---|---|---|---|---|---|---|---|---|
| Benchmark | [-] | 319. | |||||||||||||||
| CON | [-] | 328. | 327. | 319. | 348. | 9.87 | 14.8 | 0.163 | 0.831 | 0.836 | 0.989 | 0.993 | 0.829 | 0.886 | |||
| OP | [-] | 327. | 327. | 319. | 348. | 9.58 | 14.7 | 0.150 | 0.835 | 0.835 | 0.990 | 0.993 | 0.828 | 0.886 |
Download Data |
Period Mean (original grids) [Watt m-2] |
Model Period Mean (intersection) [Watt m-2] |
Model Period Mean (complement) [Watt m-2] |
Benchmark Period Mean (intersection) [Watt m-2] |
Benchmark Period Mean (complement) [Watt m-2] |
Bias [Watt m-2] |
RMSE [Watt m-2] |
Phase Shift [months] |
Bias Score [1] |
RMSE Score [1] |
Seasonal Cycle Score [1] |
Spatial Distribution Score [1] |
Interannual Variability Score [1] |
Overall Score [1] |
|||
|---|---|---|---|---|---|---|---|---|---|---|---|---|---|---|---|---|---|
| Benchmark | [-] | 377. | |||||||||||||||
| CON | [-] | 381. | 382. | 377. | 401. | 5.32 | 17.1 | 0.145 | 0.840 | 0.791 | 0.990 | 0.989 | 0.713 | 0.852 | |||
| OP | [-] | 381. | 381. | 377. | 401. | 5.15 | 17.1 | 0.145 | 0.841 | 0.790 | 0.990 | 0.988 | 0.712 | 0.852 |
Download Data |
Period Mean (original grids) [Watt m-2] |
Model Period Mean (intersection) [Watt m-2] |
Model Period Mean (complement) [Watt m-2] |
Benchmark Period Mean (intersection) [Watt m-2] |
Benchmark Period Mean (complement) [Watt m-2] |
Bias [Watt m-2] |
RMSE [Watt m-2] |
Phase Shift [months] |
Bias Score [1] |
RMSE Score [1] |
Seasonal Cycle Score [1] |
Spatial Distribution Score [1] |
Interannual Variability Score [1] |
Overall Score [1] |
|||
|---|---|---|---|---|---|---|---|---|---|---|---|---|---|---|---|---|---|
| Benchmark | [-] | 448. | |||||||||||||||
| CON | [-] | 457. | 457. | 448. | 458. | 8.97 | 14.1 | 1.13 | 0.362 | 0.398 | 0.840 | 0.923 | 0.636 | 0.593 | |||
| OP | [-] | 457. | 456. | 448. | 458. | 8.55 | 13.8 | 1.22 | 0.376 | 0.397 | 0.826 | 0.924 | 0.635 | 0.592 |
Download Data |
Period Mean (original grids) [Watt m-2] |
Model Period Mean (intersection) [Watt m-2] |
Model Period Mean (complement) [Watt m-2] |
Benchmark Period Mean (intersection) [Watt m-2] |
Benchmark Period Mean (complement) [Watt m-2] |
Bias [Watt m-2] |
RMSE [Watt m-2] |
Phase Shift [months] |
Bias Score [1] |
RMSE Score [1] |
Seasonal Cycle Score [1] |
Spatial Distribution Score [1] |
Interannual Variability Score [1] |
Overall Score [1] |
|||
|---|---|---|---|---|---|---|---|---|---|---|---|---|---|---|---|---|---|
| Benchmark | [-] | 440. | |||||||||||||||
| CON | [-] | 448. | 448. | 441. | 437. | 6.55 | 13.2 | 0.886 | 0.658 | 0.594 | 0.874 | 0.982 | 0.728 | 0.738 | |||
| OP | [-] | 448. | 448. | 441. | 437. | 6.40 | 13.1 | 0.895 | 0.660 | 0.594 | 0.872 | 0.982 | 0.727 | 0.738 |
Download Data |
Period Mean (original grids) [Watt m-2] |
Model Period Mean (intersection) [Watt m-2] |
Model Period Mean (complement) [Watt m-2] |
Benchmark Period Mean (intersection) [Watt m-2] |
Benchmark Period Mean (complement) [Watt m-2] |
Bias [Watt m-2] |
RMSE [Watt m-2] |
Phase Shift [months] |
Bias Score [1] |
RMSE Score [1] |
Seasonal Cycle Score [1] |
Spatial Distribution Score [1] |
Interannual Variability Score [1] |
Overall Score [1] |
|||
|---|---|---|---|---|---|---|---|---|---|---|---|---|---|---|---|---|---|
| Benchmark | [-] | 387. | |||||||||||||||
| CON | [-] | 387. | 386. | 387. | 396. | 0.935 | 17.8 | 0.613 | 0.599 | 0.619 | 0.930 | 0.999 | 0.715 | 0.747 | |||
| OP | [-] | 386. | 386. | 387. | 396. | 0.630 | 17.7 | 0.611 | 0.602 | 0.619 | 0.930 | 0.999 | 0.714 | 0.747 |
Temporally integrated period mean