Mean State
Download Data |
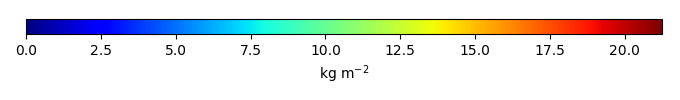
Period Mean (original grids) [Pg] |
Model Period Mean (intersection) [Pg] |
Model Period Mean (complement) [Pg] |
Benchmark Period Mean (intersection) [Pg] |
Benchmark Period Mean (complement) [Pg] |
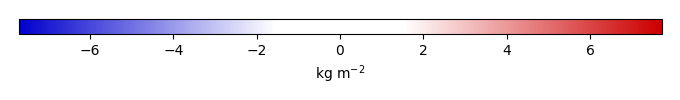
Bias [kg m-2] |
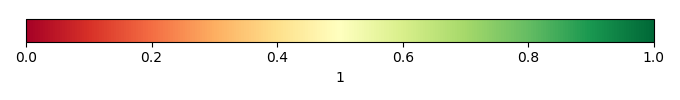
Bias Score [1] |
Spatial Distribution Score [1] |
Overall Score [1] |
|||
|---|---|---|---|---|---|---|---|---|---|---|---|---|
| Benchmark | [-] | 32.8 | ||||||||||
| CON | [-] | 39.3 | 36.9 | 0.662 | 32.8 | 9.13e-05 | 1.50 | 0.699 | 0.914 | 0.807 | ||
| OP | [-] | 39.6 | 37.2 | 0.666 | 32.8 | 9.13e-05 | 1.59 | 0.695 | 0.911 | 0.803 |
Download Data |
Period Mean (original grids) [Pg] |
Model Period Mean (intersection) [Pg] |
Model Period Mean (complement) [Pg] |
Benchmark Period Mean (intersection) [Pg] |
Benchmark Period Mean (complement) [Pg] |
Bias [kg m-2] |
Bias Score [1] |
Spatial Distribution Score [1] |
Overall Score [1] |
|||
|---|---|---|---|---|---|---|---|---|---|---|---|---|
| Benchmark | [-] | 8.35 | ||||||||||
| CON | [-] | 2.10 | 3.02 | 0.249 | 8.35 | 0.000513 | -0.897 | 0.476 | 0.735 | 0.605 | ||
| OP | [-] | 2.12 | 3.06 | 0.249 | 8.35 | 0.000513 | -0.890 | 0.477 | 0.740 | 0.608 |
Download Data |
Period Mean (original grids) [Pg] |
Model Period Mean (intersection) [Pg] |
Model Period Mean (complement) [Pg] |
Benchmark Period Mean (intersection) [Pg] |
Benchmark Period Mean (complement) [Pg] |
Bias [kg m-2] |
Bias Score [1] |
Spatial Distribution Score [1] |
Overall Score [1] |
|||
|---|---|---|---|---|---|---|---|---|---|---|---|---|
| Benchmark | [-] | 10.6 | ||||||||||
| CON | [-] | 14.1 | 13.5 | 0.677 | 10.6 | 0.00708 | 0.586 | 0.474 | 0.518 | 0.496 | ||
| OP | [-] | 14.3 | 13.6 | 0.682 | 10.6 | 0.00708 | 0.607 | 0.474 | 0.513 | 0.494 |
Download Data |
Period Mean (original grids) [Pg] |
Model Period Mean (intersection) [Pg] |
Model Period Mean (complement) [Pg] |
Benchmark Period Mean (intersection) [Pg] |
Benchmark Period Mean (complement) [Pg] |
Bias [kg m-2] |
Bias Score [1] |
Spatial Distribution Score [1] |
Overall Score [1] |
|||
|---|---|---|---|---|---|---|---|---|---|---|---|---|
| Benchmark | [-] | 4.69 | ||||||||||
| CON | [-] | 4.67 | 4.46 | 0.163 | 4.68 | 0.00995 | 0.144 | 0.582 | 0.829 | 0.706 | ||
| OP | [-] | 4.76 | 4.54 | 0.163 | 4.68 | 0.00995 | 0.170 | 0.584 | 0.831 | 0.707 |
Download Data |
Period Mean (original grids) [Pg] |
Model Period Mean (intersection) [Pg] |
Model Period Mean (complement) [Pg] |
Benchmark Period Mean (intersection) [Pg] |
Benchmark Period Mean (complement) [Pg] |
Bias [kg m-2] |
Bias Score [1] |
Spatial Distribution Score [1] |
Overall Score [1] |
|||
|---|---|---|---|---|---|---|---|---|---|---|---|---|
| Benchmark | [-] | 27.8 | ||||||||||
| CON | [-] | 39.1 | 34.7 | 3.13 | 27.4 | 0.386 | 8.41 | 0.598 | 0.895 | 0.747 | ||
| OP | [-] | 39.4 | 34.9 | 3.15 | 27.4 | 0.386 | 8.53 | 0.594 | 0.896 | 0.745 |
Download Data |
Period Mean (original grids) [Pg] |
Model Period Mean (intersection) [Pg] |
Model Period Mean (complement) [Pg] |
Benchmark Period Mean (intersection) [Pg] |
Benchmark Period Mean (complement) [Pg] |
Bias [kg m-2] |
Bias Score [1] |
Spatial Distribution Score [1] |
Overall Score [1] |
|||
|---|---|---|---|---|---|---|---|---|---|---|---|---|
| Benchmark | [-] | 43.5 | ||||||||||
| CON | [-] | 53.5 | 52.2 | 0.638 | 43.5 | 0.0248 | 1.17 | 0.493 | 0.644 | 0.568 | ||
| OP | [-] | 54.0 | 52.6 | 0.640 | 43.5 | 0.0248 | 1.22 | 0.492 | 0.642 | 0.567 |
Download Data |
Period Mean (original grids) [Pg] |
Model Period Mean (intersection) [Pg] |
Model Period Mean (complement) [Pg] |
Benchmark Period Mean (intersection) [Pg] |
Benchmark Period Mean (complement) [Pg] |
Bias [kg m-2] |
Bias Score [1] |
Spatial Distribution Score [1] |
Overall Score [1] |
|||
|---|---|---|---|---|---|---|---|---|---|---|---|---|
| Benchmark | [-] | 32.0 | ||||||||||
| CON | [-] | 33.6 | 32.7 | 1.14 | 31.9 | 0.0412 | 0.434 | 0.607 | 0.853 | 0.730 | ||
| OP | [-] | 33.9 | 33.1 | 1.15 | 31.9 | 0.0412 | 0.458 | 0.606 | 0.851 | 0.729 |
Download Data |
Period Mean (original grids) [Pg] |
Model Period Mean (intersection) [Pg] |
Model Period Mean (complement) [Pg] |
Benchmark Period Mean (intersection) [Pg] |
Benchmark Period Mean (complement) [Pg] |
Bias [kg m-2] |
Bias Score [1] |
Spatial Distribution Score [1] |
Overall Score [1] |
|||
|---|---|---|---|---|---|---|---|---|---|---|---|---|
| Benchmark | [-] | 21.1 | ||||||||||
| CON | [-] | 26.2 | 23.2 | 1.22 | 21.0 | 0.0221 | 1.61 | 0.602 | 0.824 | 0.713 | ||
| OP | [-] | 26.5 | 23.4 | 1.23 | 21.0 | 0.0221 | 1.65 | 0.600 | 0.822 | 0.711 |
Download Data |
Period Mean (original grids) [Pg] |
Model Period Mean (intersection) [Pg] |
Model Period Mean (complement) [Pg] |
Benchmark Period Mean (intersection) [Pg] |
Benchmark Period Mean (complement) [Pg] |
Bias [kg m-2] |
Bias Score [1] |
Spatial Distribution Score [1] |
Overall Score [1] |
|||
|---|---|---|---|---|---|---|---|---|---|---|---|---|
| Benchmark | [-] | 3.81 | ||||||||||
| CON | [-] | 7.17 | 7.89 | 0.131 | 3.81 | 2.17e-05 | 1.22 | 0.499 | 0.703 | 0.601 | ||
| OP | [-] | 7.22 | 7.96 | 0.132 | 3.81 | 2.17e-05 | 1.23 | 0.500 | 0.701 | 0.600 |
Download Data |
Period Mean (original grids) [Pg] |
Model Period Mean (intersection) [Pg] |
Model Period Mean (complement) [Pg] |
Benchmark Period Mean (intersection) [Pg] |
Benchmark Period Mean (complement) [Pg] |
Bias [kg m-2] |
Bias Score [1] |
Spatial Distribution Score [1] |
Overall Score [1] |
|||
|---|---|---|---|---|---|---|---|---|---|---|---|---|
| Benchmark | [-] | 9.16 | ||||||||||
| CON | [-] | 11.1 | 9.24 | 1.28 | 9.06 | 0.103 | 0.815 | 0.583 | 0.796 | 0.690 | ||
| OP | [-] | 11.2 | 9.31 | 1.29 | 9.06 | 0.103 | 0.827 | 0.583 | 0.795 | 0.689 |
Download Data |
Period Mean (original grids) [Pg] |
Model Period Mean (intersection) [Pg] |
Model Period Mean (complement) [Pg] |
Benchmark Period Mean (intersection) [Pg] |
Benchmark Period Mean (complement) [Pg] |
Bias [kg m-2] |
Bias Score [1] |
Spatial Distribution Score [1] |
Overall Score [1] |
|||
|---|---|---|---|---|---|---|---|---|---|---|---|---|
| Benchmark | [-] | 12.0 | ||||||||||
| CON | [-] | 18.2 | 16.9 | 0.771 | 12.0 | 0.00375 | 1.78 | 0.475 | 0.376 | 0.425 | ||
| OP | [-] | 18.3 | 17.0 | 0.775 | 12.0 | 0.00375 | 1.81 | 0.474 | 0.375 | 0.424 |
Download Data |
Period Mean (original grids) [Pg] |
Model Period Mean (intersection) [Pg] |
Model Period Mean (complement) [Pg] |
Benchmark Period Mean (intersection) [Pg] |
Benchmark Period Mean (complement) [Pg] |
Bias [kg m-2] |
Bias Score [1] |
Spatial Distribution Score [1] |
Overall Score [1] |
|||
|---|---|---|---|---|---|---|---|---|---|---|---|---|
| Benchmark | [-] | 368. | ||||||||||
| CON | [-] | 502. | 478. | 23.9 | 365. | 2.89 | 1.68 | 0.573 | 0.778 | 0.676 | ||
| OP | [-] | 506. | 482. | 24.0 | 365. | 2.89 | 1.72 | 0.571 | 0.775 | 0.673 |
Download Data |
Period Mean (original grids) [Pg] |
Model Period Mean (intersection) [Pg] |
Model Period Mean (complement) [Pg] |
Benchmark Period Mean (intersection) [Pg] |
Benchmark Period Mean (complement) [Pg] |
Bias [kg m-2] |
Bias Score [1] |
Spatial Distribution Score [1] |
Overall Score [1] |
|||
|---|---|---|---|---|---|---|---|---|---|---|---|---|
| Benchmark | [-] | 1.24 | ||||||||||
| CON | [-] | 1.79 | 1.25 | 0.463 | 1.24 | 0.000229 | 0.0835 | 0.511 | 0.715 | 0.613 | ||
| OP | [-] | 1.81 | 1.27 | 0.459 | 1.24 | 0.000229 | 0.0892 | 0.513 | 0.724 | 0.619 |
Download Data |
Period Mean (original grids) [Pg] |
Model Period Mean (intersection) [Pg] |
Model Period Mean (complement) [Pg] |
Benchmark Period Mean (intersection) [Pg] |
Benchmark Period Mean (complement) [Pg] |
Bias [kg m-2] |
Bias Score [1] |
Spatial Distribution Score [1] |
Overall Score [1] |
|||
|---|---|---|---|---|---|---|---|---|---|---|---|---|
| Benchmark | [-] | 5.62 | ||||||||||
| CON | [-] | 15.7 | 15.1 | 0.332 | 5.62 | 0.00290 | 1.85 | 0.326 | 0.397 | 0.361 | ||
| OP | [-] | 15.8 | 15.2 | 0.332 | 5.62 | 0.00290 | 1.88 | 0.323 | 0.392 | 0.357 |
Download Data |
Period Mean (original grids) [Pg] |
Model Period Mean (intersection) [Pg] |
Model Period Mean (complement) [Pg] |
Benchmark Period Mean (intersection) [Pg] |
Benchmark Period Mean (complement) [Pg] |
Bias [kg m-2] |
Bias Score [1] |
Spatial Distribution Score [1] |
Overall Score [1] |
|||
|---|---|---|---|---|---|---|---|---|---|---|---|---|
| Benchmark | [-] | 8.21 | ||||||||||
| CON | [-] | 10.3 | 8.54 | 1.06 | 8.14 | 0.0760 | 1.88 | 0.577 | 0.675 | 0.626 | ||
| OP | [-] | 10.4 | 8.63 | 1.07 | 8.14 | 0.0760 | 1.92 | 0.575 | 0.671 | 0.623 |
Download Data |
Period Mean (original grids) [Pg] |
Model Period Mean (intersection) [Pg] |
Model Period Mean (complement) [Pg] |
Benchmark Period Mean (intersection) [Pg] |
Benchmark Period Mean (complement) [Pg] |
Bias [kg m-2] |
Bias Score [1] |
Spatial Distribution Score [1] |
Overall Score [1] |
|||
|---|---|---|---|---|---|---|---|---|---|---|---|---|
| Benchmark | [-] | 14.8 | ||||||||||
| CON | [-] | 12.3 | 11.7 | 0.379 | 14.8 | 0.0107 | -0.280 | 0.663 | 0.875 | 0.769 | ||
| OP | [-] | 12.5 | 11.9 | 0.382 | 14.8 | 0.0107 | -0.230 | 0.665 | 0.873 | 0.769 |
Download Data |
Period Mean (original grids) [Pg] |
Model Period Mean (intersection) [Pg] |
Model Period Mean (complement) [Pg] |
Benchmark Period Mean (intersection) [Pg] |
Benchmark Period Mean (complement) [Pg] |
Bias [kg m-2] |
Bias Score [1] |
Spatial Distribution Score [1] |
Overall Score [1] |
|||
|---|---|---|---|---|---|---|---|---|---|---|---|---|
| Benchmark | [-] | 20.1 | ||||||||||
| CON | [-] | 45.1 | 44.4 | 0.540 | 20.0 | 0.0806 | 5.29 | 0.397 | 0.745 | 0.571 | ||
| OP | [-] | 45.4 | 44.7 | 0.541 | 20.0 | 0.0806 | 5.34 | 0.394 | 0.742 | 0.568 |
Download Data |
Period Mean (original grids) [Pg] |
Model Period Mean (intersection) [Pg] |
Model Period Mean (complement) [Pg] |
Benchmark Period Mean (intersection) [Pg] |
Benchmark Period Mean (complement) [Pg] |
Bias [kg m-2] |
Bias Score [1] |
Spatial Distribution Score [1] |
Overall Score [1] |
|||
|---|---|---|---|---|---|---|---|---|---|---|---|---|
| Benchmark | [-] | 8.04 | ||||||||||
| CON | [-] | 3.31 | 3.37 | 0.101 | 8.04 | 0.00192 | -0.972 | 0.516 | 0.568 | 0.542 | ||
| OP | [-] | 3.35 | 3.41 | 0.101 | 8.04 | 0.00192 | -0.960 | 0.517 | 0.573 | 0.545 |
Download Data |
Period Mean (original grids) [Pg] |
Model Period Mean (intersection) [Pg] |
Model Period Mean (complement) [Pg] |
Benchmark Period Mean (intersection) [Pg] |
Benchmark Period Mean (complement) [Pg] |
Bias [kg m-2] |
Bias Score [1] |
Spatial Distribution Score [1] |
Overall Score [1] |
|||
|---|---|---|---|---|---|---|---|---|---|---|---|---|
| Benchmark | [-] | 88.9 | ||||||||||
| CON | [-] | 127. | 127. | 0.821 | 88.8 | 0.0416 | 5.00 | 0.655 | 0.949 | 0.802 | ||
| OP | [-] | 128. | 128. | 0.826 | 88.8 | 0.0416 | 5.10 | 0.652 | 0.948 | 0.800 |
Download Data |
Period Mean (original grids) [Pg] |
Model Period Mean (intersection) [Pg] |
Model Period Mean (complement) [Pg] |
Benchmark Period Mean (intersection) [Pg] |
Benchmark Period Mean (complement) [Pg] |
Bias [kg m-2] |
Bias Score [1] |
Spatial Distribution Score [1] |
Overall Score [1] |
|||
|---|---|---|---|---|---|---|---|---|---|---|---|---|
| Benchmark | [-] | 9.09 | ||||||||||
| CON | [-] | 23.3 | 22.4 | 0.369 | 9.07 | 0.0211 | 2.28 | 0.327 | 0.310 | 0.319 | ||
| OP | [-] | 23.5 | 22.6 | 0.371 | 9.07 | 0.0211 | 2.31 | 0.325 | 0.307 | 0.316 |
Download Data |
Period Mean (original grids) [Pg] |
Model Period Mean (intersection) [Pg] |
Model Period Mean (complement) [Pg] |
Benchmark Period Mean (intersection) [Pg] |
Benchmark Period Mean (complement) [Pg] |
Bias [kg m-2] |
Bias Score [1] |
Spatial Distribution Score [1] |
Overall Score [1] |
|||
|---|---|---|---|---|---|---|---|---|---|---|---|---|
| Benchmark | [-] | 2.45 | ||||||||||
| CON | [-] | 8.03 | 7.27 | 0.155 | 2.39 | 0.0570 | 2.26 | 0.345 | 0.316 | 0.331 | ||
| OP | [-] | 8.10 | 7.34 | 0.156 | 2.39 | 0.0570 | 2.29 | 0.343 | 0.313 | 0.328 |
Temporally integrated period mean