Mean State
Download Data |
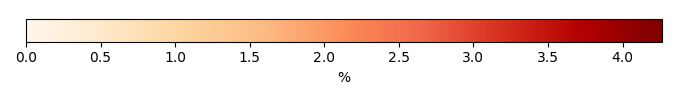
Period Mean (original grids) [%] |
Model Period Mean (intersection) [%] |
Model Period Mean (complement) [%] |
Benchmark Period Mean (intersection) [%] |
Benchmark Period Mean (complement) [%] |
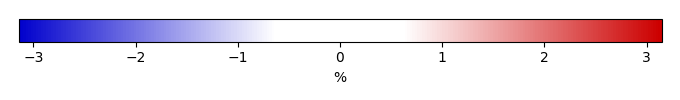
Bias [%] |
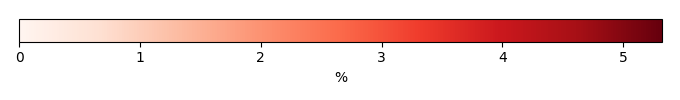
RMSE [%] |
Phase Shift [months] |
Bias Score [1] |
RMSE Score [1] |
Seasonal Cycle Score [1] |
Spatial Distribution Score [1] |
Interannual Variability Score [1] |
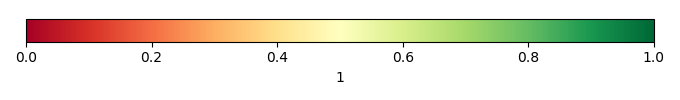
Overall Score [1] |
|||
|---|---|---|---|---|---|---|---|---|---|---|---|---|---|---|---|---|---|
| Benchmark | [-] | 0.419 | |||||||||||||||
| CON | [-] | 0.285 | 0.299 | 0.0324 | 0.419 | -0.132 | 1.27 | 1.86 | 0.695 | 0.340 | 0.803 | 0.490 | 0.521 | 0.531 | |||
| OP | [-] | 0.280 | 0.295 | 0.0318 | 0.419 | -0.135 | 1.27 | 1.86 | 0.693 | 0.340 | 0.803 | 0.483 | 0.517 | 0.530 |
Download Data |
Period Mean (original grids) [%] |
Model Period Mean (intersection) [%] |
Model Period Mean (complement) [%] |
Benchmark Period Mean (intersection) [%] |
Benchmark Period Mean (complement) [%] |
Bias [%] |
RMSE [%] |
Phase Shift [months] |
Bias Score [1] |
RMSE Score [1] |
Seasonal Cycle Score [1] |
Spatial Distribution Score [1] |
Interannual Variability Score [1] |
Overall Score [1] |
|||
|---|---|---|---|---|---|---|---|---|---|---|---|---|---|---|---|---|---|
| Benchmark | [-] | 1.70 | |||||||||||||||
| CON | [-] | 0.962 | 0.936 | 0.0668 | 1.70 | 0.0870 | -0.787 | 3.94 | 2.20 | 0.745 | 0.367 | 0.738 | 0.458 | 0.483 | 0.526 | ||
| OP | [-] | 0.954 | 0.926 | 0.0659 | 1.70 | 0.0870 | -0.797 | 3.94 | 2.21 | 0.743 | 0.367 | 0.734 | 0.455 | 0.480 | 0.524 |
Download Data |
Period Mean (original grids) [%] |
Model Period Mean (intersection) [%] |
Model Period Mean (complement) [%] |
Benchmark Period Mean (intersection) [%] |
Benchmark Period Mean (complement) [%] |
Bias [%] |
RMSE [%] |
Phase Shift [months] |
Bias Score [1] |
RMSE Score [1] |
Seasonal Cycle Score [1] |
Spatial Distribution Score [1] |
Interannual Variability Score [1] |
Overall Score [1] |
|||
|---|---|---|---|---|---|---|---|---|---|---|---|---|---|---|---|---|---|
| Benchmark | [-] | 1.56 | |||||||||||||||
| CON | [-] | 1.07 | 1.11 | 0.239 | 1.57 | 0.0342 | -0.519 | 3.81 | 1.62 | 0.715 | 0.341 | 0.780 | 0.723 | 0.524 | 0.571 | ||
| OP | [-] | 1.08 | 1.12 | 0.236 | 1.57 | 0.0342 | -0.514 | 3.81 | 1.64 | 0.716 | 0.341 | 0.781 | 0.731 | 0.525 | 0.572 |
Download Data |
Period Mean (original grids) [%] |
Model Period Mean (intersection) [%] |
Model Period Mean (complement) [%] |
Benchmark Period Mean (intersection) [%] |
Benchmark Period Mean (complement) [%] |
Bias [%] |
RMSE [%] |
Phase Shift [months] |
Bias Score [1] |
RMSE Score [1] |
Seasonal Cycle Score [1] |
Spatial Distribution Score [1] |
Interannual Variability Score [1] |
Overall Score [1] |
|||
|---|---|---|---|---|---|---|---|---|---|---|---|---|---|---|---|---|---|
| Benchmark | [-] | 0.0193 | |||||||||||||||
| CON | [-] | 0.143 | 0.155 | 0.00503 | 0.0193 | 0.00103 | 0.121 | 0.606 | 2.27 | 0.767 | 0.285 | 0.949 | 0.0900 | 0.435 | 0.468 | ||
| OP | [-] | 0.122 | 0.132 | 0.00424 | 0.0193 | 0.00103 | 0.101 | 0.554 | 2.27 | 0.782 | 0.291 | 0.949 | 0.107 | 0.437 | 0.476 |
Download Data |
Period Mean (original grids) [%] |
Model Period Mean (intersection) [%] |
Model Period Mean (complement) [%] |
Benchmark Period Mean (intersection) [%] |
Benchmark Period Mean (complement) [%] |
Bias [%] |
RMSE [%] |
Phase Shift [months] |
Bias Score [1] |
RMSE Score [1] |
Seasonal Cycle Score [1] |
Spatial Distribution Score [1] |
Interannual Variability Score [1] |
Overall Score [1] |
|||
|---|---|---|---|---|---|---|---|---|---|---|---|---|---|---|---|---|---|
| Benchmark | [-] | 0.0475 | |||||||||||||||
| CON | [-] | 0.0837 | 0.0782 | 0.100 | 0.0485 | 0.0167 | 0.0427 | 0.299 | 1.68 | 0.737 | 0.315 | 0.893 | 0.646 | 0.479 | 0.564 | ||
| OP | [-] | 0.0835 | 0.0780 | 0.100 | 0.0485 | 0.0167 | 0.0425 | 0.298 | 1.68 | 0.737 | 0.315 | 0.893 | 0.646 | 0.479 | 0.564 |
Download Data |
Period Mean (original grids) [%] |
Model Period Mean (intersection) [%] |
Model Period Mean (complement) [%] |
Benchmark Period Mean (intersection) [%] |
Benchmark Period Mean (complement) [%] |
Bias [%] |
RMSE [%] |
Phase Shift [months] |
Bias Score [1] |
RMSE Score [1] |
Seasonal Cycle Score [1] |
Spatial Distribution Score [1] |
Interannual Variability Score [1] |
Overall Score [1] |
|||
|---|---|---|---|---|---|---|---|---|---|---|---|---|---|---|---|---|---|
| Benchmark | [-] | 0.0788 | |||||||||||||||
| CON | [-] | 0.179 | 0.172 | 0.0242 | 0.0789 | 0.00283 | 0.0897 | 0.821 | 1.51 | 0.794 | 0.291 | 0.761 | 0.437 | 0.473 | 0.508 | ||
| OP | [-] | 0.175 | 0.169 | 0.0242 | 0.0789 | 0.00283 | 0.0869 | 0.817 | 1.51 | 0.795 | 0.292 | 0.754 | 0.435 | 0.473 | 0.507 |
Download Data |
Period Mean (original grids) [%] |
Model Period Mean (intersection) [%] |
Model Period Mean (complement) [%] |
Benchmark Period Mean (intersection) [%] |
Benchmark Period Mean (complement) [%] |
Bias [%] |
RMSE [%] |
Phase Shift [months] |
Bias Score [1] |
RMSE Score [1] |
Seasonal Cycle Score [1] |
Spatial Distribution Score [1] |
Interannual Variability Score [1] |
Overall Score [1] |
|||
|---|---|---|---|---|---|---|---|---|---|---|---|---|---|---|---|---|---|
| Benchmark | [-] | 0.115 | |||||||||||||||
| CON | [-] | 0.191 | 0.220 | 0.0141 | 0.115 | 0.00360 | 0.0992 | 0.820 | 2.33 | 0.771 | 0.324 | 0.774 | 0.521 | 0.449 | 0.527 | ||
| OP | [-] | 0.189 | 0.217 | 0.0140 | 0.115 | 0.00360 | 0.0966 | 0.818 | 2.33 | 0.771 | 0.324 | 0.774 | 0.523 | 0.448 | 0.527 |
Download Data |
Period Mean (original grids) [%] |
Model Period Mean (intersection) [%] |
Model Period Mean (complement) [%] |
Benchmark Period Mean (intersection) [%] |
Benchmark Period Mean (complement) [%] |
Bias [%] |
RMSE [%] |
Phase Shift [months] |
Bias Score [1] |
RMSE Score [1] |
Seasonal Cycle Score [1] |
Spatial Distribution Score [1] |
Interannual Variability Score [1] |
Overall Score [1] |
|||
|---|---|---|---|---|---|---|---|---|---|---|---|---|---|---|---|---|---|
| Benchmark | [-] | 0.177 | |||||||||||||||
| CON | [-] | 0.152 | 0.161 | 0.0767 | 0.178 | 0.0111 | -0.0189 | 0.638 | 1.50 | 0.714 | 0.350 | 0.845 | 0.406 | 0.462 | 0.521 | ||
| OP | [-] | 0.152 | 0.161 | 0.0763 | 0.178 | 0.0111 | -0.0194 | 0.639 | 1.50 | 0.714 | 0.350 | 0.845 | 0.407 | 0.462 | 0.521 |
Download Data |
Period Mean (original grids) [%] |
Model Period Mean (intersection) [%] |
Model Period Mean (complement) [%] |
Benchmark Period Mean (intersection) [%] |
Benchmark Period Mean (complement) [%] |
Bias [%] |
RMSE [%] |
Phase Shift [months] |
Bias Score [1] |
RMSE Score [1] |
Seasonal Cycle Score [1] |
Spatial Distribution Score [1] |
Interannual Variability Score [1] |
Overall Score [1] |
|||
|---|---|---|---|---|---|---|---|---|---|---|---|---|---|---|---|---|---|
| Benchmark | [-] | 0.00900 | |||||||||||||||
| CON | [-] | 0.185 | 0.202 | 0.000803 | 0.00900 | 0.00 | 0.186 | 0.669 | 2.22 | 0.715 | 0.270 | 0.863 | 0.0101 | 0.414 | 0.423 | ||
| OP | [-] | 0.174 | 0.190 | 0.000600 | 0.00900 | 0.00 | 0.174 | 0.643 | 2.24 | 0.725 | 0.273 | 0.855 | 0.0109 | 0.417 | 0.426 |
Download Data |
Period Mean (original grids) [%] |
Model Period Mean (intersection) [%] |
Model Period Mean (complement) [%] |
Benchmark Period Mean (intersection) [%] |
Benchmark Period Mean (complement) [%] |
Bias [%] |
RMSE [%] |
Phase Shift [months] |
Bias Score [1] |
RMSE Score [1] |
Seasonal Cycle Score [1] |
Spatial Distribution Score [1] |
Interannual Variability Score [1] |
Overall Score [1] |
|||
|---|---|---|---|---|---|---|---|---|---|---|---|---|---|---|---|---|---|
| Benchmark | [-] | 0.529 | |||||||||||||||
| CON | [-] | 0.432 | 0.449 | 0.134 | 0.531 | 0.214 | -0.114 | 2.24 | 1.63 | 0.770 | 0.363 | 0.809 | 0.554 | 0.417 | 0.546 | ||
| OP | [-] | 0.431 | 0.448 | 0.134 | 0.531 | 0.214 | -0.115 | 2.24 | 1.62 | 0.770 | 0.363 | 0.811 | 0.554 | 0.417 | 0.546 |
Download Data |
Period Mean (original grids) [%] |
Model Period Mean (intersection) [%] |
Model Period Mean (complement) [%] |
Benchmark Period Mean (intersection) [%] |
Benchmark Period Mean (complement) [%] |
Bias [%] |
RMSE [%] |
Phase Shift [months] |
Bias Score [1] |
RMSE Score [1] |
Seasonal Cycle Score [1] |
Spatial Distribution Score [1] |
Interannual Variability Score [1] |
Overall Score [1] |
|||
|---|---|---|---|---|---|---|---|---|---|---|---|---|---|---|---|---|---|
| Benchmark | [-] | 0.0201 | |||||||||||||||
| CON | [-] | 0.117 | 0.119 | 0.0827 | 0.0201 | 0.0328 | 0.102 | 0.298 | 2.13 | 0.597 | 0.234 | 0.862 | 0.128 | 0.463 | 0.420 | ||
| OP | [-] | 0.116 | 0.118 | 0.0833 | 0.0201 | 0.0328 | 0.101 | 0.297 | 2.14 | 0.598 | 0.236 | 0.863 | 0.126 | 0.463 | 0.420 |
Download Data |
Period Mean (original grids) [%] |
Model Period Mean (intersection) [%] |
Model Period Mean (complement) [%] |
Benchmark Period Mean (intersection) [%] |
Benchmark Period Mean (complement) [%] |
Bias [%] |
RMSE [%] |
Phase Shift [months] |
Bias Score [1] |
RMSE Score [1] |
Seasonal Cycle Score [1] |
Spatial Distribution Score [1] |
Interannual Variability Score [1] |
Overall Score [1] |
|||
|---|---|---|---|---|---|---|---|---|---|---|---|---|---|---|---|---|---|
| Benchmark | [-] | 0.319 | |||||||||||||||
| CON | [-] | 0.255 | 0.305 | 0.0255 | 0.322 | 0.0200 | -0.0350 | 1.12 | 1.95 | 0.730 | 0.346 | 0.781 | 0.658 | 0.487 | 0.558 | ||
| OP | [-] | 0.253 | 0.302 | 0.0253 | 0.322 | 0.0200 | -0.0374 | 1.12 | 1.95 | 0.730 | 0.346 | 0.780 | 0.658 | 0.486 | 0.558 |
Download Data |
Period Mean (original grids) [%] |
Model Period Mean (intersection) [%] |
Model Period Mean (complement) [%] |
Benchmark Period Mean (intersection) [%] |
Benchmark Period Mean (complement) [%] |
Bias [%] |
RMSE [%] |
Phase Shift [months] |
Bias Score [1] |
RMSE Score [1] |
Seasonal Cycle Score [1] |
Spatial Distribution Score [1] |
Interannual Variability Score [1] |
Overall Score [1] |
|||
|---|---|---|---|---|---|---|---|---|---|---|---|---|---|---|---|---|---|
| Benchmark | [-] | 0.0194 | |||||||||||||||
| CON | [-] | 0.0295 | 0.0869 | 0.00330 | 0.0195 | 0.00238 | 0.0695 | 0.214 | 2.44 | 0.673 | 0.310 | 0.803 | 0.244 | 0.420 | 0.460 | ||
| OP | [-] | 0.0291 | 0.0858 | 0.00327 | 0.0195 | 0.00238 | 0.0685 | 0.213 | 2.42 | 0.674 | 0.310 | 0.803 | 0.252 | 0.419 | 0.461 |
Download Data |
Period Mean (original grids) [%] |
Model Period Mean (intersection) [%] |
Model Period Mean (complement) [%] |
Benchmark Period Mean (intersection) [%] |
Benchmark Period Mean (complement) [%] |
Bias [%] |
RMSE [%] |
Phase Shift [months] |
Bias Score [1] |
RMSE Score [1] |
Seasonal Cycle Score [1] |
Spatial Distribution Score [1] |
Interannual Variability Score [1] |
Overall Score [1] |
|||
|---|---|---|---|---|---|---|---|---|---|---|---|---|---|---|---|---|---|
| Benchmark | [-] | 0.0156 | |||||||||||||||
| CON | [-] | 0.0145 | 0.0154 | 0.00142 | 0.0156 | 0.000305 | -0.00170 | 0.179 | 2.84 | 0.887 | 0.360 | 0.813 | 0.561 | 0.386 | 0.561 | ||
| OP | [-] | 0.0127 | 0.0134 | 0.00131 | 0.0156 | 0.000305 | -0.00344 | 0.175 | 2.84 | 0.887 | 0.360 | 0.780 | 0.573 | 0.384 | 0.557 |
Download Data |
Period Mean (original grids) [%] |
Model Period Mean (intersection) [%] |
Model Period Mean (complement) [%] |
Benchmark Period Mean (intersection) [%] |
Benchmark Period Mean (complement) [%] |
Bias [%] |
RMSE [%] |
Phase Shift [months] |
Bias Score [1] |
RMSE Score [1] |
Seasonal Cycle Score [1] |
Spatial Distribution Score [1] |
Interannual Variability Score [1] |
Overall Score [1] |
|||
|---|---|---|---|---|---|---|---|---|---|---|---|---|---|---|---|---|---|
| Benchmark | [-] | 0.0820 | |||||||||||||||
| CON | [-] | 0.296 | 0.322 | 0.162 | 0.0826 | 0.0262 | 0.195 | 0.668 | 1.69 | 0.636 | 0.299 | 0.822 | 0.111 | 0.427 | 0.432 | ||
| OP | [-] | 0.295 | 0.320 | 0.159 | 0.0826 | 0.0262 | 0.194 | 0.668 | 1.69 | 0.637 | 0.299 | 0.822 | 0.109 | 0.426 | 0.432 |
Download Data |
Period Mean (original grids) [%] |
Model Period Mean (intersection) [%] |
Model Period Mean (complement) [%] |
Benchmark Period Mean (intersection) [%] |
Benchmark Period Mean (complement) [%] |
Bias [%] |
RMSE [%] |
Phase Shift [months] |
Bias Score [1] |
RMSE Score [1] |
Seasonal Cycle Score [1] |
Spatial Distribution Score [1] |
Interannual Variability Score [1] |
Overall Score [1] |
|||
|---|---|---|---|---|---|---|---|---|---|---|---|---|---|---|---|---|---|
| Benchmark | [-] | 0.0297 | |||||||||||||||
| CON | [-] | 0.0298 | 0.0328 | 0.00533 | 0.0298 | 0.00847 | 0.00191 | 0.177 | 2.98 | 0.685 | 0.276 | 0.561 | 0.519 | 0.430 | 0.458 | ||
| OP | [-] | 0.0283 | 0.0313 | 0.00511 | 0.0298 | 0.00847 | 0.000463 | 0.172 | 2.98 | 0.687 | 0.278 | 0.561 | 0.513 | 0.434 | 0.459 |
Download Data |
Period Mean (original grids) [%] |
Model Period Mean (intersection) [%] |
Model Period Mean (complement) [%] |
Benchmark Period Mean (intersection) [%] |
Benchmark Period Mean (complement) [%] |
Bias [%] |
RMSE [%] |
Phase Shift [months] |
Bias Score [1] |
RMSE Score [1] |
Seasonal Cycle Score [1] |
Spatial Distribution Score [1] |
Interannual Variability Score [1] |
Overall Score [1] |
|||
|---|---|---|---|---|---|---|---|---|---|---|---|---|---|---|---|---|---|
| Benchmark | [-] | 0.0271 | |||||||||||||||
| CON | [-] | 0.0175 | 0.0202 | 0.00254 | 0.0272 | 0.000329 | -0.00822 | 0.251 | 2.26 | 0.871 | 0.352 | 0.845 | 0.574 | 0.415 | 0.568 | ||
| OP | [-] | 0.0167 | 0.0192 | 0.00244 | 0.0272 | 0.000329 | -0.00910 | 0.250 | 2.28 | 0.871 | 0.353 | 0.845 | 0.582 | 0.413 | 0.569 |
Download Data |
Period Mean (original grids) [%] |
Model Period Mean (intersection) [%] |
Model Period Mean (complement) [%] |
Benchmark Period Mean (intersection) [%] |
Benchmark Period Mean (complement) [%] |
Bias [%] |
RMSE [%] |
Phase Shift [months] |
Bias Score [1] |
RMSE Score [1] |
Seasonal Cycle Score [1] |
Spatial Distribution Score [1] |
Interannual Variability Score [1] |
Overall Score [1] |
|||
|---|---|---|---|---|---|---|---|---|---|---|---|---|---|---|---|---|---|
| Benchmark | [-] | 0.0297 | |||||||||||||||
| CON | [-] | 0.132 | 0.132 | 0.217 | 0.0297 | 0.0588 | 0.0996 | 0.432 | 1.87 | 0.731 | 0.290 | 0.837 | 0.127 | 0.412 | 0.448 | ||
| OP | [-] | 0.132 | 0.132 | 0.210 | 0.0297 | 0.0588 | 0.0996 | 0.432 | 1.87 | 0.729 | 0.289 | 0.837 | 0.127 | 0.412 | 0.447 |
Download Data |
Period Mean (original grids) [%] |
Model Period Mean (intersection) [%] |
Model Period Mean (complement) [%] |
Benchmark Period Mean (intersection) [%] |
Benchmark Period Mean (complement) [%] |
Bias [%] |
RMSE [%] |
Phase Shift [months] |
Bias Score [1] |
RMSE Score [1] |
Seasonal Cycle Score [1] |
Spatial Distribution Score [1] |
Interannual Variability Score [1] |
Overall Score [1] |
|||
|---|---|---|---|---|---|---|---|---|---|---|---|---|---|---|---|---|---|
| Benchmark | [-] | 0.125 | |||||||||||||||
| CON | [-] | 0.0964 | 0.0996 | 0.0990 | 0.125 | 0.0211 | -0.0241 | 0.456 | 1.30 | 0.683 | 0.322 | 0.868 | 0.676 | 0.436 | 0.551 | ||
| OP | [-] | 0.0955 | 0.0988 | 0.0973 | 0.125 | 0.0211 | -0.0250 | 0.455 | 1.30 | 0.683 | 0.322 | 0.868 | 0.674 | 0.435 | 0.551 |
Download Data |
Period Mean (original grids) [%] |
Model Period Mean (intersection) [%] |
Model Period Mean (complement) [%] |
Benchmark Period Mean (intersection) [%] |
Benchmark Period Mean (complement) [%] |
Bias [%] |
RMSE [%] |
Phase Shift [months] |
Bias Score [1] |
RMSE Score [1] |
Seasonal Cycle Score [1] |
Spatial Distribution Score [1] |
Interannual Variability Score [1] |
Overall Score [1] |
|||
|---|---|---|---|---|---|---|---|---|---|---|---|---|---|---|---|---|---|
| Benchmark | [-] | 0.224 | |||||||||||||||
| CON | [-] | 0.464 | 0.474 | 0.0727 | 0.225 | 0.00895 | 0.226 | 1.13 | 1.38 | 0.665 | 0.311 | 0.880 | 0.604 | 0.478 | 0.541 | ||
| OP | [-] | 0.458 | 0.467 | 0.0682 | 0.225 | 0.00895 | 0.220 | 1.13 | 1.39 | 0.666 | 0.311 | 0.872 | 0.604 | 0.477 | 0.540 |
Download Data |
Period Mean (original grids) [%] |
Model Period Mean (intersection) [%] |
Model Period Mean (complement) [%] |
Benchmark Period Mean (intersection) [%] |
Benchmark Period Mean (complement) [%] |
Bias [%] |
RMSE [%] |
Phase Shift [months] |
Bias Score [1] |
RMSE Score [1] |
Seasonal Cycle Score [1] |
Spatial Distribution Score [1] |
Interannual Variability Score [1] |
Overall Score [1] |
|||
|---|---|---|---|---|---|---|---|---|---|---|---|---|---|---|---|---|---|
| Benchmark | [-] | 0.0270 | |||||||||||||||
| CON | [-] | 0.221 | 0.214 | 0.132 | 0.0272 | 0.00237 | 0.172 | 0.484 | 1.70 | 0.760 | 0.310 | 0.853 | 0.101 | 0.400 | 0.456 | ||
| OP | [-] | 0.219 | 0.213 | 0.131 | 0.0272 | 0.00237 | 0.171 | 0.482 | 1.67 | 0.760 | 0.310 | 0.856 | 0.103 | 0.402 | 0.457 |
Temporally integrated period mean