Mean State
Download Data |
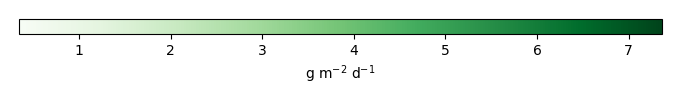
Period Mean (original grids) [g m-2 d-1] |
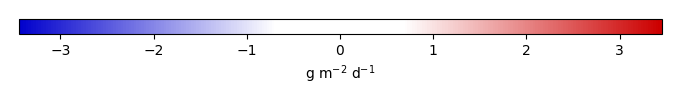
Bias [g m-2 d-1] |
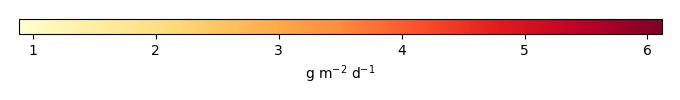
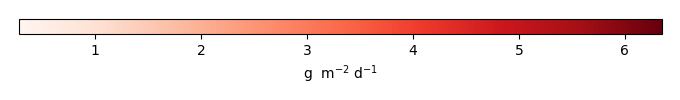
RMSE [g m-2 d-1] |
Phase Shift [months] |
Bias Score [1] |
RMSE Score [1] |
Seasonal Cycle Score [1] |
Interannual Variability Score [1] |
Overall Score [1] |
|||
|---|---|---|---|---|---|---|---|---|---|---|---|---|
| Benchmark | [-] | 1.90 | ||||||||||
| CON | [-] | 1.36 | -0.542 | 1.87 | 0.492 | 0.770 | 0.394 | 0.970 | 0.571 | 0.620 | ||
| OP | [-] | 1.37 | -0.535 | 1.87 | 0.492 | 0.772 | 0.394 | 0.970 | 0.573 | 0.620 |
Download Data |
Period Mean (original grids) [g m-2 d-1] |
Bias [g m-2 d-1] |
RMSE [g m-2 d-1] |
Phase Shift [months] |
Bias Score [1] |
RMSE Score [1] |
Seasonal Cycle Score [1] |
Interannual Variability Score [1] |
Overall Score [1] |
|||
|---|---|---|---|---|---|---|---|---|---|---|---|---|
| Benchmark | [-] | 1.45 | ||||||||||
| CON | [-] | 1.90 | 0.447 | 3.75 | 0.00 | 0.714 | 0.0666 | 1.00 | 0.200 | 0.409 | ||
| OP | [-] | 1.77 | 0.322 | 3.46 | 0.00 | 0.784 | 0.0798 | 1.00 | 0.231 | 0.435 |
Download Data |
Period Mean (original grids) [g m-2 d-1] |
Bias [g m-2 d-1] |
RMSE [g m-2 d-1] |
Phase Shift [months] |
Bias Score [1] |
RMSE Score [1] |
Seasonal Cycle Score [1] |
Interannual Variability Score [1] |
Overall Score [1] |
|||
|---|---|---|---|---|---|---|---|---|---|---|---|---|
| Benchmark | [-] | 8.69 | ||||||||||
| CON | [-] | 7.24 | -1.45 | 1.89 | 3.05 | 0.335 | 0.357 | 0.498 | 0.469 | 0.403 | ||
| OP | [-] | 7.37 | -1.32 | 1.80 | 3.05 | 0.370 | 0.358 | 0.498 | 0.467 | 0.410 |
Download Data |
Period Mean (original grids) [g m-2 d-1] |
Bias [g m-2 d-1] |
RMSE [g m-2 d-1] |
Phase Shift [months] |
Bias Score [1] |
RMSE Score [1] |
Seasonal Cycle Score [1] |
Interannual Variability Score [1] |
Overall Score [1] |
|||
|---|---|---|---|---|---|---|---|---|---|---|---|---|
| Benchmark | [-] | 1.87 | ||||||||||
| CON | [-] | 2.84 | 0.964 | 2.47 | 0.00 | 0.614 | 0.355 | 1.00 | 0.556 | 0.576 | ||
| OP | [-] | 2.89 | 1.01 | 2.52 | 0.00 | 0.599 | 0.350 | 1.00 | 0.543 | 0.568 |
Download Data |
Period Mean (original grids) [g m-2 d-1] |
Bias [g m-2 d-1] |
RMSE [g m-2 d-1] |
Phase Shift [months] |
Bias Score [1] |
RMSE Score [1] |
Seasonal Cycle Score [1] |
Interannual Variability Score [1] |
Overall Score [1] |
|||
|---|---|---|---|---|---|---|---|---|---|---|---|---|
| Benchmark | [-] | 4.97 | ||||||||||
| CON | [-] | 5.94 | 0.972 | 5.51 | 2.56 | 0.132 | 0.357 | 0.643 | 0.777 | 0.453 | ||
| OP | [-] | 5.91 | 0.944 | 5.46 | 2.56 | 0.134 | 0.361 | 0.643 | 0.782 | 0.456 |
Download Data |
Period Mean (original grids) [g m-2 d-1] |
Bias [g m-2 d-1] |
RMSE [g m-2 d-1] |
Phase Shift [months] |
Bias Score [1] |
RMSE Score [1] |
Seasonal Cycle Score [1] |
Interannual Variability Score [1] |
Overall Score [1] |
|||
|---|---|---|---|---|---|---|---|---|---|---|---|---|
| Benchmark | [-] | 3.63 | ||||||||||
| CON | [-] | 3.00 | -0.632 | 2.44 | 0.665 | 0.662 | 0.530 | 0.943 | 0.757 | 0.684 | ||
| OP | [-] | 2.97 | -0.659 | 2.44 | 0.665 | 0.656 | 0.532 | 0.943 | 0.758 | 0.684 |
Download Data |
Period Mean (original grids) [g m-2 d-1] |
Bias [g m-2 d-1] |
RMSE [g m-2 d-1] |
Phase Shift [months] |
Bias Score [1] |
RMSE Score [1] |
Seasonal Cycle Score [1] |
Interannual Variability Score [1] |
Overall Score [1] |
|||
|---|---|---|---|---|---|---|---|---|---|---|---|---|
| Benchmark | [-] | 3.27 | ||||||||||
| CON | [-] | 2.96 | -0.312 | 2.50 | 0.822 | 0.638 | 0.500 | 0.898 | 0.717 | 0.650 | ||
| OP | [-] | 2.95 | -0.320 | 2.49 | 0.822 | 0.638 | 0.502 | 0.898 | 0.718 | 0.652 |
Download Data |
Period Mean (original grids) [g m-2 d-1] |
Bias [g m-2 d-1] |
RMSE [g m-2 d-1] |
Phase Shift [months] |
Bias Score [1] |
RMSE Score [1] |
Seasonal Cycle Score [1] |
Interannual Variability Score [1] |
Overall Score [1] |
|||
|---|---|---|---|---|---|---|---|---|---|---|---|---|
| Benchmark | [-] | 1.98 | ||||||||||
| CON | [-] | 0.997 | -0.980 | 1.35 | 2.03 | 0.494 | 0.475 | 0.749 | 0.765 | 0.592 | ||
| OP | [-] | 0.988 | -0.990 | 1.36 | 2.03 | 0.491 | 0.471 | 0.749 | 0.754 | 0.587 |
Download Data |
Period Mean (original grids) [g m-2 d-1] |
Bias [g m-2 d-1] |
RMSE [g m-2 d-1] |
Phase Shift [months] |
Bias Score [1] |
RMSE Score [1] |
Seasonal Cycle Score [1] |
Interannual Variability Score [1] |
Overall Score [1] |
|||
|---|---|---|---|---|---|---|---|---|---|---|---|---|
| Benchmark | [-] | 3.69 | ||||||||||
| CON | [-] | 3.13 | -0.555 | 2.73 | 1.31 | 0.750 | 0.530 | 0.830 | 0.741 | 0.676 | ||
| OP | [-] | 3.13 | -0.553 | 2.67 | 1.31 | 0.756 | 0.537 | 0.830 | 0.745 | 0.681 |
Download Data |
Period Mean (original grids) [g m-2 d-1] |
Bias [g m-2 d-1] |
RMSE [g m-2 d-1] |
Phase Shift [months] |
Bias Score [1] |
RMSE Score [1] |
Seasonal Cycle Score [1] |
Interannual Variability Score [1] |
Overall Score [1] |
|||
|---|---|---|---|---|---|---|---|---|---|---|---|---|
| Benchmark | [-] | 1.64 | ||||||||||
| CON | [-] | 2.81 | 1.17 | 2.19 | 0.293 | 0.579 | 0.440 | 0.980 | 0.615 | 0.611 | ||
| OP | [-] | 2.84 | 1.21 | 2.23 | 0.293 | 0.575 | 0.435 | 0.980 | 0.612 | 0.607 |
Download Data |
Period Mean (original grids) [g m-2 d-1] |
Bias [g m-2 d-1] |
RMSE [g m-2 d-1] |
Phase Shift [months] |
Bias Score [1] |
RMSE Score [1] |
Seasonal Cycle Score [1] |
Interannual Variability Score [1] |
Overall Score [1] |
|||
|---|---|---|---|---|---|---|---|---|---|---|---|---|
| Benchmark | [-] | 1.85 | ||||||||||
| CON | [-] | 1.22 | -0.632 | 2.44 | 1.02 | 0.446 | 0.360 | 0.881 | 0.470 | 0.503 | ||
| OP | [-] | 1.22 | -0.626 | 2.45 | 1.02 | 0.438 | 0.358 | 0.881 | 0.467 | 0.501 |
Download Data |
Period Mean (original grids) [g m-2 d-1] |
Bias [g m-2 d-1] |
RMSE [g m-2 d-1] |
Phase Shift [months] |
Bias Score [1] |
RMSE Score [1] |
Seasonal Cycle Score [1] |
Interannual Variability Score [1] |
Overall Score [1] |
|||
|---|---|---|---|---|---|---|---|---|---|---|---|---|
| Benchmark | [-] | 7.40 | ||||||||||
| CON | [-] | 5.89 | -1.51 | 1.84 | 1.02 | 0.241 | 0.364 | 0.933 | 0.555 | 0.491 | ||
| OP | [-] | 5.97 | -1.43 | 1.78 | 1.02 | 0.260 | 0.363 | 0.933 | 0.560 | 0.496 |
Temporally integrated period mean