Mean State
Download Data |
Period Mean (original grids) [Pg yr-1] |
Model Period Mean (intersection) [Pg yr-1] |
Model Period Mean (complement) [Pg yr-1] |
Benchmark Period Mean (intersection) [Pg yr-1] |
Benchmark Period Mean (complement) [Pg yr-1] |
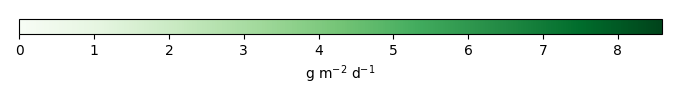
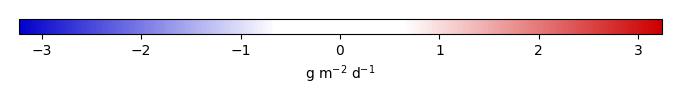
Bias [g m-2 d-1] |
RMSE [g m-2 d-1] |
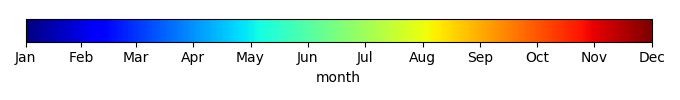
Phase Shift [months] |
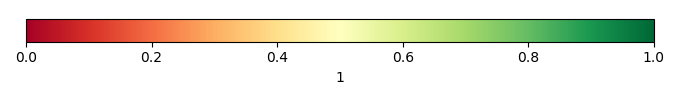
Bias Score [1] |
RMSE Score [1] |
Seasonal Cycle Score [1] |
Spatial Distribution Score [1] |
Overall Score [1] |
|||
|---|---|---|---|---|---|---|---|---|---|---|---|---|---|---|---|---|
| Benchmark | [-] | 8.21 | ||||||||||||||
| CON | [-] | 7.73 | 6.77 | 0.352 | 8.21 | 0.000187 | -0.618 | 1.62 | 2.27 | 0.333 | 0.294 | 0.590 | 0.969 | 0.496 | ||
| OP | [-] | 7.84 | 6.87 | 0.353 | 8.21 | 0.000187 | -0.553 | 1.58 | 2.28 | 0.352 | 0.296 | 0.590 | 0.973 | 0.501 |
Download Data |
Period Mean (original grids) [Pg yr-1] |
Model Period Mean (intersection) [Pg yr-1] |
Model Period Mean (complement) [Pg yr-1] |
Benchmark Period Mean (intersection) [Pg yr-1] |
Benchmark Period Mean (complement) [Pg yr-1] |
Bias [g m-2 d-1] |
RMSE [g m-2 d-1] |
Phase Shift [months] |
Bias Score [1] |
RMSE Score [1] |
Seasonal Cycle Score [1] |
Spatial Distribution Score [1] |
Overall Score [1] |
|||
|---|---|---|---|---|---|---|---|---|---|---|---|---|---|---|---|---|
| Benchmark | [-] | 5.66 | ||||||||||||||
| CON | [-] | 4.80 | 5.19 | 0.0544 | 5.66 | -0.154 | 1.73 | 1.63 | 0.595 | 0.425 | 0.723 | 0.836 | 0.601 | |||
| OP | [-] | 4.80 | 5.19 | 0.0544 | 5.66 | -0.153 | 1.72 | 1.63 | 0.595 | 0.426 | 0.724 | 0.839 | 0.602 |
Download Data |
Period Mean (original grids) [Pg yr-1] |
Model Period Mean (intersection) [Pg yr-1] |
Model Period Mean (complement) [Pg yr-1] |
Benchmark Period Mean (intersection) [Pg yr-1] |
Benchmark Period Mean (complement) [Pg yr-1] |
Bias [g m-2 d-1] |
RMSE [g m-2 d-1] |
Phase Shift [months] |
Bias Score [1] |
RMSE Score [1] |
Seasonal Cycle Score [1] |
Spatial Distribution Score [1] |
Overall Score [1] |
|||
|---|---|---|---|---|---|---|---|---|---|---|---|---|---|---|---|---|
| Benchmark | [-] | 9.93 | ||||||||||||||
| CON | [-] | 7.16 | 6.61 | 0.503 | 9.93 | 0.00241 | -0.745 | 2.07 | 1.42 | 0.399 | 0.379 | 0.820 | 0.915 | 0.578 | ||
| OP | [-] | 7.20 | 6.66 | 0.503 | 9.93 | 0.00241 | -0.730 | 2.05 | 1.37 | 0.401 | 0.381 | 0.828 | 0.917 | 0.581 |
Download Data |
Period Mean (original grids) [Pg yr-1] |
Model Period Mean (intersection) [Pg yr-1] |
Model Period Mean (complement) [Pg yr-1] |
Benchmark Period Mean (intersection) [Pg yr-1] |
Benchmark Period Mean (complement) [Pg yr-1] |
Bias [g m-2 d-1] |
RMSE [g m-2 d-1] |
Phase Shift [months] |
Bias Score [1] |
RMSE Score [1] |
Seasonal Cycle Score [1] |
Spatial Distribution Score [1] |
Overall Score [1] |
|||
|---|---|---|---|---|---|---|---|---|---|---|---|---|---|---|---|---|
| Benchmark | [-] | 1.04 | ||||||||||||||
| CON | [-] | 1.75 | 1.63 | 0.0963 | 1.04 | 0.00178 | 0.663 | 2.01 | 0.179 | 0.570 | 0.384 | 0.989 | 0.563 | 0.578 | ||
| OP | [-] | 1.76 | 1.65 | 0.0957 | 1.04 | 0.00178 | 0.675 | 2.02 | 0.142 | 0.566 | 0.382 | 0.991 | 0.563 | 0.577 |
Download Data |
Period Mean (original grids) [Pg yr-1] |
Model Period Mean (intersection) [Pg yr-1] |
Model Period Mean (complement) [Pg yr-1] |
Benchmark Period Mean (intersection) [Pg yr-1] |
Benchmark Period Mean (complement) [Pg yr-1] |
Bias [g m-2 d-1] |
RMSE [g m-2 d-1] |
Phase Shift [months] |
Bias Score [1] |
RMSE Score [1] |
Seasonal Cycle Score [1] |
Spatial Distribution Score [1] |
Overall Score [1] |
|||
|---|---|---|---|---|---|---|---|---|---|---|---|---|---|---|---|---|
| Benchmark | [-] | 7.14 | ||||||||||||||
| CON | [-] | 6.31 | 4.81 | 1.26 | 7.07 | 0.0686 | 0.491 | 2.27 | 1.87 | 0.116 | 0.178 | 0.745 | 0.220 | 0.287 | ||
| OP | [-] | 6.39 | 4.87 | 1.27 | 7.07 | 0.0686 | 0.579 | 2.25 | 1.89 | 0.122 | 0.178 | 0.741 | 0.224 | 0.289 |
Download Data |
Period Mean (original grids) [Pg yr-1] |
Model Period Mean (intersection) [Pg yr-1] |
Model Period Mean (complement) [Pg yr-1] |
Benchmark Period Mean (intersection) [Pg yr-1] |
Benchmark Period Mean (complement) [Pg yr-1] |
Bias [g m-2 d-1] |
RMSE [g m-2 d-1] |
Phase Shift [months] |
Bias Score [1] |
RMSE Score [1] |
Seasonal Cycle Score [1] |
Spatial Distribution Score [1] |
Overall Score [1] |
|||
|---|---|---|---|---|---|---|---|---|---|---|---|---|---|---|---|---|
| Benchmark | [-] | 6.89 | ||||||||||||||
| CON | [-] | 7.82 | 7.50 | 0.124 | 6.89 | 0.00299 | 0.234 | 1.39 | 0.489 | 0.783 | 0.656 | 0.966 | 0.825 | 0.777 | ||
| OP | [-] | 7.89 | 7.57 | 0.124 | 6.89 | 0.00299 | 0.255 | 1.39 | 0.489 | 0.780 | 0.657 | 0.966 | 0.822 | 0.776 |
Download Data |
Period Mean (original grids) [Pg yr-1] |
Model Period Mean (intersection) [Pg yr-1] |
Model Period Mean (complement) [Pg yr-1] |
Benchmark Period Mean (intersection) [Pg yr-1] |
Benchmark Period Mean (complement) [Pg yr-1] |
Bias [g m-2 d-1] |
RMSE [g m-2 d-1] |
Phase Shift [months] |
Bias Score [1] |
RMSE Score [1] |
Seasonal Cycle Score [1] |
Spatial Distribution Score [1] |
Overall Score [1] |
|||
|---|---|---|---|---|---|---|---|---|---|---|---|---|---|---|---|---|
| Benchmark | [-] | 10.2 | ||||||||||||||
| CON | [-] | 11.1 | 10.7 | 0.473 | 10.2 | 0.00385 | 0.213 | 1.27 | 1.07 | 0.713 | 0.552 | 0.925 | 0.952 | 0.738 | ||
| OP | [-] | 11.1 | 10.7 | 0.474 | 10.2 | 0.00385 | 0.213 | 1.26 | 1.08 | 0.713 | 0.558 | 0.925 | 0.953 | 0.741 |
Download Data |
Period Mean (original grids) [Pg yr-1] |
Model Period Mean (intersection) [Pg yr-1] |
Model Period Mean (complement) [Pg yr-1] |
Benchmark Period Mean (intersection) [Pg yr-1] |
Benchmark Period Mean (complement) [Pg yr-1] |
Bias [g m-2 d-1] |
RMSE [g m-2 d-1] |
Phase Shift [months] |
Bias Score [1] |
RMSE Score [1] |
Seasonal Cycle Score [1] |
Spatial Distribution Score [1] |
Overall Score [1] |
|||
|---|---|---|---|---|---|---|---|---|---|---|---|---|---|---|---|---|
| Benchmark | [-] | 8.44 | ||||||||||||||
| CON | [-] | 7.31 | 6.27 | 0.681 | 8.44 | 0.00440 | -0.202 | 2.12 | 2.93 | 0.471 | 0.360 | 0.542 | 0.948 | 0.536 | ||
| OP | [-] | 7.34 | 6.29 | 0.687 | 8.44 | 0.00440 | -0.188 | 2.11 | 2.93 | 0.474 | 0.361 | 0.544 | 0.949 | 0.538 |
Download Data |
Period Mean (original grids) [Pg yr-1] |
Model Period Mean (intersection) [Pg yr-1] |
Model Period Mean (complement) [Pg yr-1] |
Benchmark Period Mean (intersection) [Pg yr-1] |
Benchmark Period Mean (complement) [Pg yr-1] |
Bias [g m-2 d-1] |
RMSE [g m-2 d-1] |
Phase Shift [months] |
Bias Score [1] |
RMSE Score [1] |
Seasonal Cycle Score [1] |
Spatial Distribution Score [1] |
Overall Score [1] |
|||
|---|---|---|---|---|---|---|---|---|---|---|---|---|---|---|---|---|
| Benchmark | [-] | 1.28 | ||||||||||||||
| CON | [-] | 2.16 | 2.23 | 0.0557 | 1.28 | 0.000152 | 0.804 | 2.08 | 0.170 | 0.617 | 0.383 | 0.993 | 0.823 | 0.640 | ||
| OP | [-] | 2.14 | 2.21 | 0.0544 | 1.28 | 0.000152 | 0.793 | 2.06 | 0.164 | 0.620 | 0.387 | 0.994 | 0.819 | 0.641 |
Download Data |
Period Mean (original grids) [Pg yr-1] |
Model Period Mean (intersection) [Pg yr-1] |
Model Period Mean (complement) [Pg yr-1] |
Benchmark Period Mean (intersection) [Pg yr-1] |
Benchmark Period Mean (complement) [Pg yr-1] |
Bias [g m-2 d-1] |
RMSE [g m-2 d-1] |
Phase Shift [months] |
Bias Score [1] |
RMSE Score [1] |
Seasonal Cycle Score [1] |
Spatial Distribution Score [1] |
Overall Score [1] |
|||
|---|---|---|---|---|---|---|---|---|---|---|---|---|---|---|---|---|
| Benchmark | [-] | 3.54 | ||||||||||||||
| CON | [-] | 5.00 | 4.25 | 0.624 | 3.52 | 0.0139 | 0.623 | 1.31 | 2.13 | 0.441 | 0.255 | 0.818 | 0.816 | 0.517 | ||
| OP | [-] | 5.01 | 4.26 | 0.625 | 3.52 | 0.0139 | 0.624 | 1.30 | 2.07 | 0.441 | 0.258 | 0.822 | 0.817 | 0.519 |
Download Data |
Period Mean (original grids) [Pg yr-1] |
Model Period Mean (intersection) [Pg yr-1] |
Model Period Mean (complement) [Pg yr-1] |
Benchmark Period Mean (intersection) [Pg yr-1] |
Benchmark Period Mean (complement) [Pg yr-1] |
Bias [g m-2 d-1] |
RMSE [g m-2 d-1] |
Phase Shift [months] |
Bias Score [1] |
RMSE Score [1] |
Seasonal Cycle Score [1] |
Spatial Distribution Score [1] |
Overall Score [1] |
|||
|---|---|---|---|---|---|---|---|---|---|---|---|---|---|---|---|---|
| Benchmark | [-] | 5.33 | ||||||||||||||
| CON | [-] | 5.09 | 4.71 | 0.352 | 5.32 | 0.00341 | 0.220 | 1.81 | 0.344 | 0.715 | 0.576 | 0.979 | 0.777 | 0.725 | ||
| OP | [-] | 5.06 | 4.68 | 0.351 | 5.32 | 0.00341 | 0.204 | 1.78 | 0.346 | 0.712 | 0.583 | 0.979 | 0.780 | 0.728 |
Download Data |
Period Mean (original grids) [Pg yr-1] |
Model Period Mean (intersection) [Pg yr-1] |
Model Period Mean (complement) [Pg yr-1] |
Benchmark Period Mean (intersection) [Pg yr-1] |
Benchmark Period Mean (complement) [Pg yr-1] |
Bias [g m-2 d-1] |
RMSE [g m-2 d-1] |
Phase Shift [months] |
Bias Score [1] |
RMSE Score [1] |
Seasonal Cycle Score [1] |
Spatial Distribution Score [1] |
Overall Score [1] |
|||
|---|---|---|---|---|---|---|---|---|---|---|---|---|---|---|---|---|
| Benchmark | [-] | 119. | ||||||||||||||
| CON | [-] | 120. | 111. | 9.39 | 119. | 0.413 | 0.136 | 1.64 | 1.38 | 0.440 | 0.389 | 0.780 | 0.938 | 0.587 | ||
| OP | [-] | 121. | 111. | 9.42 | 119. | 0.413 | 0.150 | 1.63 | 1.37 | 0.444 | 0.391 | 0.781 | 0.940 | 0.590 |
Download Data |
Period Mean (original grids) [Pg yr-1] |
Model Period Mean (intersection) [Pg yr-1] |
Model Period Mean (complement) [Pg yr-1] |
Benchmark Period Mean (intersection) [Pg yr-1] |
Benchmark Period Mean (complement) [Pg yr-1] |
Bias [g m-2 d-1] |
RMSE [g m-2 d-1] |
Phase Shift [months] |
Bias Score [1] |
RMSE Score [1] |
Seasonal Cycle Score [1] |
Spatial Distribution Score [1] |
Overall Score [1] |
|||
|---|---|---|---|---|---|---|---|---|---|---|---|---|---|---|---|---|
| Benchmark | [-] | 0.877 | ||||||||||||||
| CON | [-] | 1.81 | 1.53 | 0.172 | 0.877 | 0.000163 | 0.305 | 0.723 | 2.28 | 0.431 | 0.240 | 0.867 | 0.829 | 0.522 | ||
| OP | [-] | 1.80 | 1.52 | 0.169 | 0.877 | 0.000163 | 0.302 | 0.715 | 2.27 | 0.430 | 0.245 | 0.868 | 0.829 | 0.523 |
Download Data |
Period Mean (original grids) [Pg yr-1] |
Model Period Mean (intersection) [Pg yr-1] |
Model Period Mean (complement) [Pg yr-1] |
Benchmark Period Mean (intersection) [Pg yr-1] |
Benchmark Period Mean (complement) [Pg yr-1] |
Bias [g m-2 d-1] |
RMSE [g m-2 d-1] |
Phase Shift [months] |
Bias Score [1] |
RMSE Score [1] |
Seasonal Cycle Score [1] |
Spatial Distribution Score [1] |
Overall Score [1] |
|||
|---|---|---|---|---|---|---|---|---|---|---|---|---|---|---|---|---|
| Benchmark | [-] | 1.57 | ||||||||||||||
| CON | [-] | 3.13 | 2.95 | 0.117 | 1.57 | 0.000582 | 0.679 | 1.60 | 0.624 | 0.454 | 0.302 | 0.971 | 0.515 | 0.509 | ||
| OP | [-] | 3.13 | 2.95 | 0.116 | 1.57 | 0.000582 | 0.681 | 1.60 | 0.624 | 0.453 | 0.303 | 0.971 | 0.510 | 0.508 |
Download Data |
Period Mean (original grids) [Pg yr-1] |
Model Period Mean (intersection) [Pg yr-1] |
Model Period Mean (complement) [Pg yr-1] |
Benchmark Period Mean (intersection) [Pg yr-1] |
Benchmark Period Mean (complement) [Pg yr-1] |
Bias [g m-2 d-1] |
RMSE [g m-2 d-1] |
Phase Shift [months] |
Bias Score [1] |
RMSE Score [1] |
Seasonal Cycle Score [1] |
Spatial Distribution Score [1] |
Overall Score [1] |
|||
|---|---|---|---|---|---|---|---|---|---|---|---|---|---|---|---|---|
| Benchmark | [-] | 3.63 | ||||||||||||||
| CON | [-] | 3.25 | 2.45 | 0.634 | 3.61 | 0.0206 | 0.118 | 1.94 | 1.73 | 0.362 | 0.344 | 0.770 | 0.941 | 0.552 | ||
| OP | [-] | 3.28 | 2.47 | 0.638 | 3.61 | 0.0206 | 0.143 | 1.94 | 1.71 | 0.367 | 0.345 | 0.765 | 0.942 | 0.553 |
Download Data |
Period Mean (original grids) [Pg yr-1] |
Model Period Mean (intersection) [Pg yr-1] |
Model Period Mean (complement) [Pg yr-1] |
Benchmark Period Mean (intersection) [Pg yr-1] |
Benchmark Period Mean (complement) [Pg yr-1] |
Bias [g m-2 d-1] |
RMSE [g m-2 d-1] |
Phase Shift [months] |
Bias Score [1] |
RMSE Score [1] |
Seasonal Cycle Score [1] |
Spatial Distribution Score [1] |
Overall Score [1] |
|||
|---|---|---|---|---|---|---|---|---|---|---|---|---|---|---|---|---|
| Benchmark | [-] | 5.10 | ||||||||||||||
| CON | [-] | 4.77 | 4.53 | 0.213 | 5.10 | 0.00139 | -0.113 | 1.82 | 0.671 | 0.733 | 0.621 | 0.942 | 0.908 | 0.765 | ||
| OP | [-] | 4.76 | 4.53 | 0.214 | 5.10 | 0.00139 | -0.117 | 1.75 | 0.669 | 0.738 | 0.633 | 0.942 | 0.910 | 0.771 |
Download Data |
Period Mean (original grids) [Pg yr-1] |
Model Period Mean (intersection) [Pg yr-1] |
Model Period Mean (complement) [Pg yr-1] |
Benchmark Period Mean (intersection) [Pg yr-1] |
Benchmark Period Mean (complement) [Pg yr-1] |
Bias [g m-2 d-1] |
RMSE [g m-2 d-1] |
Phase Shift [months] |
Bias Score [1] |
RMSE Score [1] |
Seasonal Cycle Score [1] |
Spatial Distribution Score [1] |
Overall Score [1] |
|||
|---|---|---|---|---|---|---|---|---|---|---|---|---|---|---|---|---|
| Benchmark | [-] | 3.36 | ||||||||||||||
| CON | [-] | 5.19 | 5.11 | 0.120 | 3.36 | 0.00768 | 1.10 | 1.91 | 0.517 | 0.592 | 0.524 | 0.966 | 0.933 | 0.708 | ||
| OP | [-] | 5.23 | 5.16 | 0.121 | 3.36 | 0.00768 | 1.12 | 1.91 | 0.518 | 0.589 | 0.524 | 0.966 | 0.930 | 0.707 |
Download Data |
Period Mean (original grids) [Pg yr-1] |
Model Period Mean (intersection) [Pg yr-1] |
Model Period Mean (complement) [Pg yr-1] |
Benchmark Period Mean (intersection) [Pg yr-1] |
Benchmark Period Mean (complement) [Pg yr-1] |
Bias [g m-2 d-1] |
RMSE [g m-2 d-1] |
Phase Shift [months] |
Bias Score [1] |
RMSE Score [1] |
Seasonal Cycle Score [1] |
Spatial Distribution Score [1] |
Overall Score [1] |
|||
|---|---|---|---|---|---|---|---|---|---|---|---|---|---|---|---|---|
| Benchmark | [-] | 1.80 | ||||||||||||||
| CON | [-] | 1.87 | 1.80 | 0.0245 | 1.80 | 0.000356 | 0.0809 | 1.25 | 0.942 | 0.530 | 0.409 | 0.917 | 0.910 | 0.635 | ||
| OP | [-] | 1.87 | 1.81 | 0.0246 | 1.80 | 0.000356 | 0.0859 | 1.24 | 0.916 | 0.529 | 0.413 | 0.918 | 0.909 | 0.636 |
Download Data |
Period Mean (original grids) [Pg yr-1] |
Model Period Mean (intersection) [Pg yr-1] |
Model Period Mean (complement) [Pg yr-1] |
Benchmark Period Mean (intersection) [Pg yr-1] |
Benchmark Period Mean (complement) [Pg yr-1] |
Bias [g m-2 d-1] |
RMSE [g m-2 d-1] |
Phase Shift [months] |
Bias Score [1] |
RMSE Score [1] |
Seasonal Cycle Score [1] |
Spatial Distribution Score [1] |
Overall Score [1] |
|||
|---|---|---|---|---|---|---|---|---|---|---|---|---|---|---|---|---|
| Benchmark | [-] | 23.2 | ||||||||||||||
| CON | [-] | 19.9 | 19.5 | 0.307 | 23.2 | 0.0155 | -0.877 | 1.97 | 2.53 | 0.128 | 0.235 | 0.604 | 0.891 | 0.418 | ||
| OP | [-] | 20.2 | 19.8 | 0.309 | 23.2 | 0.0155 | -0.797 | 1.91 | 2.52 | 0.135 | 0.235 | 0.607 | 0.891 | 0.421 |
Download Data |
Period Mean (original grids) [Pg yr-1] |
Model Period Mean (intersection) [Pg yr-1] |
Model Period Mean (complement) [Pg yr-1] |
Benchmark Period Mean (intersection) [Pg yr-1] |
Benchmark Period Mean (complement) [Pg yr-1] |
Bias [g m-2 d-1] |
RMSE [g m-2 d-1] |
Phase Shift [months] |
Bias Score [1] |
RMSE Score [1] |
Seasonal Cycle Score [1] |
Spatial Distribution Score [1] |
Overall Score [1] |
|||
|---|---|---|---|---|---|---|---|---|---|---|---|---|---|---|---|---|
| Benchmark | [-] | 10.4 | ||||||||||||||
| CON | [-] | 10.8 | 10.3 | 0.406 | 10.4 | 0.0104 | 0.184 | 2.02 | 1.11 | 0.533 | 0.466 | 0.894 | 0.854 | 0.643 | ||
| OP | [-] | 10.8 | 10.4 | 0.404 | 10.4 | 0.0104 | 0.184 | 2.00 | 1.11 | 0.535 | 0.471 | 0.894 | 0.859 | 0.646 |
Download Data |
Period Mean (original grids) [Pg yr-1] |
Model Period Mean (intersection) [Pg yr-1] |
Model Period Mean (complement) [Pg yr-1] |
Benchmark Period Mean (intersection) [Pg yr-1] |
Benchmark Period Mean (complement) [Pg yr-1] |
Bias [g m-2 d-1] |
RMSE [g m-2 d-1] |
Phase Shift [months] |
Bias Score [1] |
RMSE Score [1] |
Seasonal Cycle Score [1] |
Spatial Distribution Score [1] |
Overall Score [1] |
|||
|---|---|---|---|---|---|---|---|---|---|---|---|---|---|---|---|---|
| Benchmark | [-] | 1.16 | ||||||||||||||
| CON | [-] | 1.82 | 1.62 | 0.107 | 1.14 | 0.0186 | 0.708 | 1.38 | 1.50 | 0.401 | 0.389 | 0.887 | 0.878 | 0.589 | ||
| OP | [-] | 1.83 | 1.63 | 0.107 | 1.14 | 0.0186 | 0.721 | 1.39 | 1.46 | 0.400 | 0.389 | 0.892 | 0.879 | 0.590 |
Temporally integrated period mean