Mean State
Download Data |
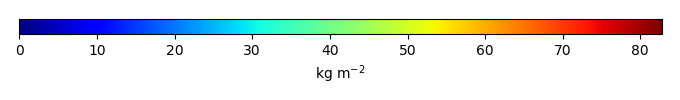
Period Mean (original grids) [Pg] |
Model Period Mean (intersection) [Pg] |
Model Period Mean (complement) [Pg] |
Benchmark Period Mean (intersection) [Pg] |
Benchmark Period Mean (complement) [Pg] |
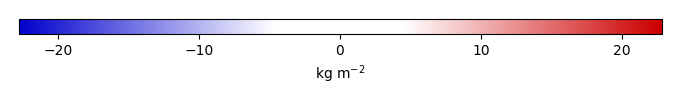
Bias [kg m-2] |
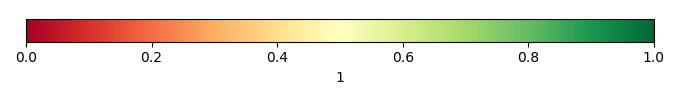
Bias Score [1] |
Spatial Distribution Score [1] |
Overall Score [1] |
|||
|---|---|---|---|---|---|---|---|---|---|---|---|---|
| Benchmark | [-] | 34.1 | ||||||||||
| CON | [-] | 29.2 | 26.7 | 0.666 | 34.1 | 0.0278 | -1.03 | 0.713 | 0.909 | 0.811 | ||
| OP | [-] | 29.2 | 26.8 | 0.666 | 34.1 | 0.0278 | -1.03 | 0.713 | 0.910 | 0.811 |
Download Data |
Period Mean (original grids) [Pg] |
Model Period Mean (intersection) [Pg] |
Model Period Mean (complement) [Pg] |
Benchmark Period Mean (intersection) [Pg] |
Benchmark Period Mean (complement) [Pg] |
Bias [kg m-2] |
Bias Score [1] |
Spatial Distribution Score [1] |
Overall Score [1] |
|||
|---|---|---|---|---|---|---|---|---|---|---|---|---|
| Benchmark | [-] | 44.8 | ||||||||||
| CON | [-] | 12.5 | 13.8 | 0.0921 | 44.8 | 0.0683 | -4.45 | 0.500 | 0.650 | 0.575 | ||
| OP | [-] | 12.5 | 13.8 | 0.0921 | 44.8 | 0.0683 | -4.45 | 0.500 | 0.650 | 0.575 |
Download Data |
Period Mean (original grids) [Pg] |
Model Period Mean (intersection) [Pg] |
Model Period Mean (complement) [Pg] |
Benchmark Period Mean (intersection) [Pg] |
Benchmark Period Mean (complement) [Pg] |
Bias [kg m-2] |
Bias Score [1] |
Spatial Distribution Score [1] |
Overall Score [1] |
|||
|---|---|---|---|---|---|---|---|---|---|---|---|---|
| Benchmark | [-] | 60.1 | ||||||||||
| CON | [-] | 29.1 | 27.1 | 1.36 | 59.8 | 0.261 | -2.90 | 0.548 | 0.843 | 0.696 | ||
| OP | [-] | 29.1 | 27.1 | 1.36 | 59.8 | 0.261 | -2.90 | 0.549 | 0.843 | 0.696 |
Download Data |
Period Mean (original grids) [Pg] |
Model Period Mean (intersection) [Pg] |
Model Period Mean (complement) [Pg] |
Benchmark Period Mean (intersection) [Pg] |
Benchmark Period Mean (complement) [Pg] |
Bias [kg m-2] |
Bias Score [1] |
Spatial Distribution Score [1] |
Overall Score [1] |
|||
|---|---|---|---|---|---|---|---|---|---|---|---|---|
| Benchmark | [-] | 11.1 | ||||||||||
| CON | [-] | 108. | 10.2 | 95.3 | 10.7 | 0.441 | 10.3 | 0.416 | 0.152 | 0.284 | ||
| OP | [-] | 108. | 10.2 | 95.2 | 10.7 | 0.441 | 10.3 | 0.416 | 0.152 | 0.284 |
Download Data |
Period Mean (original grids) [Pg] |
Model Period Mean (intersection) [Pg] |
Model Period Mean (complement) [Pg] |
Benchmark Period Mean (intersection) [Pg] |
Benchmark Period Mean (complement) [Pg] |
Bias [kg m-2] |
Bias Score [1] |
Spatial Distribution Score [1] |
Overall Score [1] |
|||
|---|---|---|---|---|---|---|---|---|---|---|---|---|
| Benchmark | [-] | 55.7 | ||||||||||
| CON | [-] | 20.7 | 17.4 | 2.31 | 54.0 | 1.77 | -5.76 | 0.659 | 0.222 | 0.441 | ||
| OP | [-] | 20.7 | 17.4 | 2.31 | 54.0 | 1.77 | -5.76 | 0.659 | 0.221 | 0.440 |
Download Data |
Period Mean (original grids) [Pg] |
Model Period Mean (intersection) [Pg] |
Model Period Mean (complement) [Pg] |
Benchmark Period Mean (intersection) [Pg] |
Benchmark Period Mean (complement) [Pg] |
Bias [kg m-2] |
Bias Score [1] |
Spatial Distribution Score [1] |
Overall Score [1] |
|||
|---|---|---|---|---|---|---|---|---|---|---|---|---|
| Benchmark | [-] | 65.6 | ||||||||||
| CON | [-] | 137. | 59.7 | 73.2 | 65.5 | 0.127 | -0.698 | 0.714 | 0.850 | 0.782 | ||
| OP | [-] | 137. | 59.7 | 73.2 | 65.5 | 0.127 | -0.708 | 0.714 | 0.850 | 0.782 |
Download Data |
Period Mean (original grids) [Pg] |
Model Period Mean (intersection) [Pg] |
Model Period Mean (complement) [Pg] |
Benchmark Period Mean (intersection) [Pg] |
Benchmark Period Mean (complement) [Pg] |
Bias [kg m-2] |
Bias Score [1] |
Spatial Distribution Score [1] |
Overall Score [1] |
|||
|---|---|---|---|---|---|---|---|---|---|---|---|---|
| Benchmark | [-] | 143. | ||||||||||
| CON | [-] | 94.7 | 89.6 | 6.74 | 143. | 0.544 | -2.63 | 0.622 | 0.903 | 0.762 | ||
| OP | [-] | 94.6 | 89.5 | 6.73 | 143. | 0.544 | -2.63 | 0.622 | 0.903 | 0.763 |
Download Data |
Period Mean (original grids) [Pg] |
Model Period Mean (intersection) [Pg] |
Model Period Mean (complement) [Pg] |
Benchmark Period Mean (intersection) [Pg] |
Benchmark Period Mean (complement) [Pg] |
Bias [kg m-2] |
Bias Score [1] |
Spatial Distribution Score [1] |
Overall Score [1] |
|||
|---|---|---|---|---|---|---|---|---|---|---|---|---|
| Benchmark | [-] | 58.4 | ||||||||||
| CON | [-] | 32.3 | 29.3 | 1.52 | 58.0 | 0.365 | -2.68 | 0.656 | 0.863 | 0.760 | ||
| OP | [-] | 32.3 | 29.3 | 1.52 | 58.0 | 0.365 | -2.68 | 0.656 | 0.864 | 0.760 |
Download Data |
Period Mean (original grids) [Pg] |
Model Period Mean (intersection) [Pg] |
Model Period Mean (complement) [Pg] |
Benchmark Period Mean (intersection) [Pg] |
Benchmark Period Mean (complement) [Pg] |
Bias [kg m-2] |
Bias Score [1] |
Spatial Distribution Score [1] |
Overall Score [1] |
|||
|---|---|---|---|---|---|---|---|---|---|---|---|---|
| Benchmark | [-] | 7.78 | ||||||||||
| CON | [-] | 118. | 10.7 | 112. | 7.68 | 0.0955 | 11.2 | 0.436 | 0.207 | 0.321 | ||
| OP | [-] | 118. | 10.7 | 111. | 7.68 | 0.0955 | 11.2 | 0.435 | 0.207 | 0.321 |
Download Data |
Period Mean (original grids) [Pg] |
Model Period Mean (intersection) [Pg] |
Model Period Mean (complement) [Pg] |
Benchmark Period Mean (intersection) [Pg] |
Benchmark Period Mean (complement) [Pg] |
Bias [kg m-2] |
Bias Score [1] |
Spatial Distribution Score [1] |
Overall Score [1] |
|||
|---|---|---|---|---|---|---|---|---|---|---|---|---|
| Benchmark | [-] | 58.9 | ||||||||||
| CON | [-] | 28.8 | 25.8 | 2.21 | 57.9 | 0.945 | -2.53 | 0.538 | 0.444 | 0.491 | ||
| OP | [-] | 28.8 | 25.8 | 2.21 | 57.9 | 0.945 | -2.53 | 0.538 | 0.445 | 0.492 |
Download Data |
Period Mean (original grids) [Pg] |
Model Period Mean (intersection) [Pg] |
Model Period Mean (complement) [Pg] |
Benchmark Period Mean (intersection) [Pg] |
Benchmark Period Mean (complement) [Pg] |
Bias [kg m-2] |
Bias Score [1] |
Spatial Distribution Score [1] |
Overall Score [1] |
|||
|---|---|---|---|---|---|---|---|---|---|---|---|---|
| Benchmark | [-] | 61.8 | ||||||||||
| CON | [-] | 43.5 | 38.2 | 4.92 | 61.4 | 0.340 | -2.34 | 0.713 | 0.842 | 0.777 | ||
| OP | [-] | 43.4 | 38.2 | 4.92 | 61.4 | 0.340 | -2.35 | 0.713 | 0.841 | 0.777 |
Download Data |
Period Mean (original grids) [Pg] |
Model Period Mean (intersection) [Pg] |
Model Period Mean (complement) [Pg] |
Benchmark Period Mean (intersection) [Pg] |
Benchmark Period Mean (complement) [Pg] |
Bias [kg m-2] |
Bias Score [1] |
Spatial Distribution Score [1] |
Overall Score [1] |
|||
|---|---|---|---|---|---|---|---|---|---|---|---|---|
| Benchmark | [-] | 1.09e+03 | ||||||||||
| CON | [-] | 1.08e+03 | 602. | 474. | 1.05e+03 | 33.6 | -2.72 | 0.622 | 0.718 | 0.670 | ||
| OP | [-] | 1.08e+03 | 602. | 473. | 1.05e+03 | 33.6 | -2.72 | 0.622 | 0.718 | 0.670 |
Download Data |
Period Mean (original grids) [Pg] |
Model Period Mean (intersection) [Pg] |
Model Period Mean (complement) [Pg] |
Benchmark Period Mean (intersection) [Pg] |
Benchmark Period Mean (complement) [Pg] |
Bias [kg m-2] |
Bias Score [1] |
Spatial Distribution Score [1] |
Overall Score [1] |
|||
|---|---|---|---|---|---|---|---|---|---|---|---|---|
| Benchmark | [-] | 64.3 | ||||||||||
| CON | [-] | 15.4 | 13.8 | 0.796 | 64.2 | 0.107 | -2.89 | 0.487 | 0.819 | 0.653 | ||
| OP | [-] | 15.4 | 13.8 | 0.795 | 64.2 | 0.107 | -2.89 | 0.487 | 0.819 | 0.653 |
Download Data |
Period Mean (original grids) [Pg] |
Model Period Mean (intersection) [Pg] |
Model Period Mean (complement) [Pg] |
Benchmark Period Mean (intersection) [Pg] |
Benchmark Period Mean (complement) [Pg] |
Bias [kg m-2] |
Bias Score [1] |
Spatial Distribution Score [1] |
Overall Score [1] |
|||
|---|---|---|---|---|---|---|---|---|---|---|---|---|
| Benchmark | [-] | 13.3 | ||||||||||
| CON | [-] | 124. | 8.34 | 115. | 12.9 | 0.453 | -0.619 | 0.464 | 0.449 | 0.457 | ||
| OP | [-] | 124. | 8.33 | 115. | 12.9 | 0.453 | -0.625 | 0.464 | 0.449 | 0.457 |
Download Data |
Period Mean (original grids) [Pg] |
Model Period Mean (intersection) [Pg] |
Model Period Mean (complement) [Pg] |
Benchmark Period Mean (intersection) [Pg] |
Benchmark Period Mean (complement) [Pg] |
Bias [kg m-2] |
Bias Score [1] |
Spatial Distribution Score [1] |
Overall Score [1] |
|||
|---|---|---|---|---|---|---|---|---|---|---|---|---|
| Benchmark | [-] | 42.5 | ||||||||||
| CON | [-] | 16.9 | 14.1 | 1.92 | 41.9 | 0.623 | -5.27 | 0.577 | 0.759 | 0.668 | ||
| OP | [-] | 16.9 | 14.1 | 1.92 | 41.9 | 0.623 | -5.27 | 0.577 | 0.759 | 0.668 |
Download Data |
Period Mean (original grids) [Pg] |
Model Period Mean (intersection) [Pg] |
Model Period Mean (complement) [Pg] |
Benchmark Period Mean (intersection) [Pg] |
Benchmark Period Mean (complement) [Pg] |
Bias [kg m-2] |
Bias Score [1] |
Spatial Distribution Score [1] |
Overall Score [1] |
|||
|---|---|---|---|---|---|---|---|---|---|---|---|---|
| Benchmark | [-] | 45.3 | ||||||||||
| CON | [-] | 31.6 | 30.8 | 0.715 | 45.1 | 0.204 | -2.83 | 0.725 | 0.756 | 0.741 | ||
| OP | [-] | 31.6 | 30.7 | 0.714 | 45.1 | 0.204 | -2.85 | 0.725 | 0.753 | 0.739 |
Download Data |
Period Mean (original grids) [Pg] |
Model Period Mean (intersection) [Pg] |
Model Period Mean (complement) [Pg] |
Benchmark Period Mean (intersection) [Pg] |
Benchmark Period Mean (complement) [Pg] |
Bias [kg m-2] |
Bias Score [1] |
Spatial Distribution Score [1] |
Overall Score [1] |
|||
|---|---|---|---|---|---|---|---|---|---|---|---|---|
| Benchmark | [-] | 51.3 | ||||||||||
| CON | [-] | 76.3 | 39.7 | 37.3 | 50.7 | 0.642 | -2.34 | 0.638 | 0.876 | 0.757 | ||
| OP | [-] | 76.2 | 39.7 | 37.2 | 50.7 | 0.642 | -2.35 | 0.638 | 0.876 | 0.757 |
Download Data |
Period Mean (original grids) [Pg] |
Model Period Mean (intersection) [Pg] |
Model Period Mean (complement) [Pg] |
Benchmark Period Mean (intersection) [Pg] |
Benchmark Period Mean (complement) [Pg] |
Bias [kg m-2] |
Bias Score [1] |
Spatial Distribution Score [1] |
Overall Score [1] |
|||
|---|---|---|---|---|---|---|---|---|---|---|---|---|
| Benchmark | [-] | 34.3 | ||||||||||
| CON | [-] | 13.1 | 12.4 | 0.432 | 34.2 | 0.0949 | -5.23 | 0.553 | 0.886 | 0.719 | ||
| OP | [-] | 13.1 | 12.4 | 0.432 | 34.2 | 0.0949 | -5.23 | 0.553 | 0.886 | 0.719 |
Download Data |
Period Mean (original grids) [Pg] |
Model Period Mean (intersection) [Pg] |
Model Period Mean (complement) [Pg] |
Benchmark Period Mean (intersection) [Pg] |
Benchmark Period Mean (complement) [Pg] |
Bias [kg m-2] |
Bias Score [1] |
Spatial Distribution Score [1] |
Overall Score [1] |
|||
|---|---|---|---|---|---|---|---|---|---|---|---|---|
| Benchmark | [-] | 101. | ||||||||||
| CON | [-] | 67.4 | 66.7 | 0.802 | 100. | 0.729 | -3.34 | 0.694 | 0.431 | 0.563 | ||
| OP | [-] | 67.5 | 66.8 | 0.802 | 100. | 0.729 | -3.33 | 0.695 | 0.429 | 0.562 |
Download Data |
Period Mean (original grids) [Pg] |
Model Period Mean (intersection) [Pg] |
Model Period Mean (complement) [Pg] |
Benchmark Period Mean (intersection) [Pg] |
Benchmark Period Mean (complement) [Pg] |
Bias [kg m-2] |
Bias Score [1] |
Spatial Distribution Score [1] |
Overall Score [1] |
|||
|---|---|---|---|---|---|---|---|---|---|---|---|---|
| Benchmark | [-] | 60.7 | ||||||||||
| CON | [-] | 51.0 | 49.6 | 0.969 | 60.5 | 0.223 | -1.02 | 0.672 | 0.815 | 0.743 | ||
| OP | [-] | 50.9 | 49.6 | 0.968 | 60.5 | 0.223 | -1.03 | 0.672 | 0.814 | 0.743 |
Download Data |
Period Mean (original grids) [Pg] |
Model Period Mean (intersection) [Pg] |
Model Period Mean (complement) [Pg] |
Benchmark Period Mean (intersection) [Pg] |
Benchmark Period Mean (complement) [Pg] |
Bias [kg m-2] |
Bias Score [1] |
Spatial Distribution Score [1] |
Overall Score [1] |
|||
|---|---|---|---|---|---|---|---|---|---|---|---|---|
| Benchmark | [-] | 29.6 | ||||||||||
| CON | [-] | 15.5 | 14.4 | 0.423 | 28.8 | 0.768 | -3.24 | 0.563 | 0.456 | 0.509 | ||
| OP | [-] | 15.5 | 14.4 | 0.423 | 28.8 | 0.768 | -3.24 | 0.563 | 0.455 | 0.509 |
Temporally integrated period mean