Mean State
Download Data |
Period Mean (original grids) [Pg] |
Model Period Mean (intersection) [Pg] |
Model Period Mean (complement) [Pg] |
Benchmark Period Mean (intersection) [Pg] |
Benchmark Period Mean (complement) [Pg] |
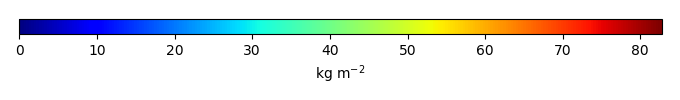
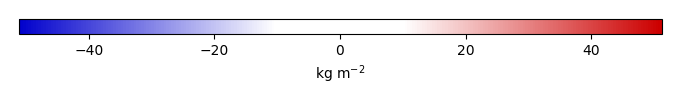
Bias [kg m-2] |
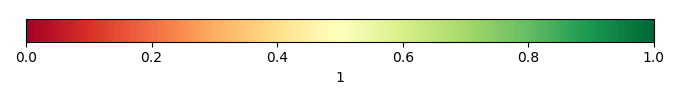
Bias Score [1] |
Spatial Distribution Score [1] |
Overall Score [1] |
|||
|---|---|---|---|---|---|---|---|---|---|---|---|---|
| Benchmark | [-] | 76.5 | ||||||||||
| CON | [-] | 108. | 92.3 | 13.2 | 76.3 | 0.132 | 8.18 | 0.508 | 0.266 | 0.387 | ||
| OP | [-] | 108. | 92.2 | 13.2 | 76.3 | 0.132 | 8.16 | 0.508 | 0.267 | 0.388 |
Download Data |
Period Mean (original grids) [Pg] |
Model Period Mean (intersection) [Pg] |
Model Period Mean (complement) [Pg] |
Benchmark Period Mean (intersection) [Pg] |
Benchmark Period Mean (complement) [Pg] |
Bias [kg m-2] |
Bias Score [1] |
Spatial Distribution Score [1] |
Overall Score [1] |
|||
|---|---|---|---|---|---|---|---|---|---|---|---|---|
| Benchmark | [-] | 113. | ||||||||||
| CON | [-] | 137. | 72.1 | 60.9 | 113. | -8.38 | 0.564 | 0.839 | 0.702 | |||
| OP | [-] | 137. | 72.0 | 60.8 | 113. | -8.39 | 0.564 | 0.839 | 0.702 |
Download Data |
Period Mean (original grids) [Pg] |
Model Period Mean (intersection) [Pg] |
Model Period Mean (complement) [Pg] |
Benchmark Period Mean (intersection) [Pg] |
Benchmark Period Mean (complement) [Pg] |
Bias [kg m-2] |
Bias Score [1] |
Spatial Distribution Score [1] |
Overall Score [1] |
|||
|---|---|---|---|---|---|---|---|---|---|---|---|---|
| Benchmark | [-] | 12.2 | ||||||||||
| CON | [-] | 94.7 | 5.59 | 90.8 | 12.2 | -6.71 | 0.561 | 0.816 | 0.688 | |||
| OP | [-] | 94.6 | 5.59 | 90.7 | 12.2 | -6.71 | 0.561 | 0.815 | 0.688 |
Download Data |
Period Mean (original grids) [Pg] |
Model Period Mean (intersection) [Pg] |
Model Period Mean (complement) [Pg] |
Benchmark Period Mean (intersection) [Pg] |
Benchmark Period Mean (complement) [Pg] |
Bias [kg m-2] |
Bias Score [1] |
Spatial Distribution Score [1] |
Overall Score [1] |
|||
|---|---|---|---|---|---|---|---|---|---|---|---|---|
| Benchmark | [-] | 97.3 | ||||||||||
| CON | [-] | 118. | 110. | 12.3 | 97.2 | 0.0316 | 4.77 | 0.539 | 0.373 | 0.456 | ||
| OP | [-] | 118. | 110. | 12.2 | 97.2 | 0.0316 | 4.75 | 0.539 | 0.373 | 0.456 |
Download Data |
Period Mean (original grids) [Pg] |
Model Period Mean (intersection) [Pg] |
Model Period Mean (complement) [Pg] |
Benchmark Period Mean (intersection) [Pg] |
Benchmark Period Mean (complement) [Pg] |
Bias [kg m-2] |
Bias Score [1] |
Spatial Distribution Score [1] |
Overall Score [1] |
|||
|---|---|---|---|---|---|---|---|---|---|---|---|---|
| Benchmark | [-] | 5.12 | ||||||||||
| CON | [-] | 43.5 | 3.34 | 39.8 | 5.12 | -6.39 | 0.637 | 0.649 | 0.643 | |||
| OP | [-] | 43.4 | 3.34 | 39.7 | 5.12 | -6.40 | 0.637 | 0.649 | 0.643 |
Download Data |
Period Mean (original grids) [Pg] |
Model Period Mean (intersection) [Pg] |
Model Period Mean (complement) [Pg] |
Benchmark Period Mean (intersection) [Pg] |
Benchmark Period Mean (complement) [Pg] |
Bias [kg m-2] |
Bias Score [1] |
Spatial Distribution Score [1] |
Overall Score [1] |
|||
|---|---|---|---|---|---|---|---|---|---|---|---|---|
| Benchmark | [-] | 475. | ||||||||||
| CON | [-] | 1.08e+03 | 437. | 639. | 475. | 0.691 | -0.913 | 0.527 | 0.616 | 0.572 | ||
| OP | [-] | 1.08e+03 | 437. | 638. | 475. | 0.691 | -0.926 | 0.527 | 0.617 | 0.572 |
Download Data |
Period Mean (original grids) [Pg] |
Model Period Mean (intersection) [Pg] |
Model Period Mean (complement) [Pg] |
Benchmark Period Mean (intersection) [Pg] |
Benchmark Period Mean (complement) [Pg] |
Bias [kg m-2] |
Bias Score [1] |
Spatial Distribution Score [1] |
Overall Score [1] |
|||
|---|---|---|---|---|---|---|---|---|---|---|---|---|
| Benchmark | [-] | 116. | ||||||||||
| CON | [-] | 124. | 115. | 7.63 | 116. | 0.0985 | 0.825 | 0.480 | 0.588 | 0.534 | ||
| OP | [-] | 124. | 115. | 7.63 | 116. | 0.0985 | 0.811 | 0.480 | 0.588 | 0.534 |
Download Data |
Period Mean (original grids) [Pg] |
Model Period Mean (intersection) [Pg] |
Model Period Mean (complement) [Pg] |
Benchmark Period Mean (intersection) [Pg] |
Benchmark Period Mean (complement) [Pg] |
Bias [kg m-2] |
Bias Score [1] |
Spatial Distribution Score [1] |
Overall Score [1] |
|||
|---|---|---|---|---|---|---|---|---|---|---|---|---|
| Benchmark | [-] | 0.0131 | ||||||||||
| CON | [-] | 31.6 | 0.0185 | 31.5 | 0.0131 | 3.18 | 0.584 | 4.91e-23 | 0.292 | |||
| OP | [-] | 31.6 | 0.0185 | 31.4 | 0.0131 | 3.18 | 0.584 | 4.94e-23 | 0.292 |
Download Data |
Period Mean (original grids) [Pg] |
Model Period Mean (intersection) [Pg] |
Model Period Mean (complement) [Pg] |
Benchmark Period Mean (intersection) [Pg] |
Benchmark Period Mean (complement) [Pg] |
Bias [kg m-2] |
Bias Score [1] |
Spatial Distribution Score [1] |
Overall Score [1] |
|||
|---|---|---|---|---|---|---|---|---|---|---|---|---|
| Benchmark | [-] | 46.1 | ||||||||||
| CON | [-] | 76.3 | 37.0 | 40.0 | 46.1 | -4.25 | 0.557 | 0.579 | 0.568 | |||
| OP | [-] | 76.2 | 36.9 | 40.0 | 46.1 | -4.26 | 0.557 | 0.578 | 0.568 |
Download Data |
Period Mean (original grids) [Pg] |
Model Period Mean (intersection) [Pg] |
Model Period Mean (complement) [Pg] |
Benchmark Period Mean (intersection) [Pg] |
Benchmark Period Mean (complement) [Pg] |
Bias [kg m-2] |
Bias Score [1] |
Spatial Distribution Score [1] |
Overall Score [1] |
|||
|---|---|---|---|---|---|---|---|---|---|---|---|---|
| Benchmark | [-] | 0.232 | ||||||||||
| CON | [-] | 13.1 | 0.290 | 12.5 | 0.232 | 0.946 | 0.578 | 0.846 | 0.712 | |||
| OP | [-] | 13.1 | 0.290 | 12.5 | 0.232 | 0.941 | 0.578 | 0.846 | 0.712 |
Temporally integrated period mean