Mean State
Download Data |
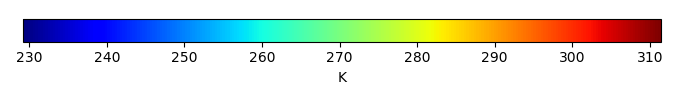
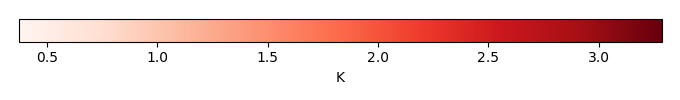
Period Mean (original grids) [K] |
Model Period Mean (intersection) [K] |
Model Period Mean (complement) [K] |
Benchmark Period Mean (intersection) [K] |
Benchmark Period Mean (complement) [K] |
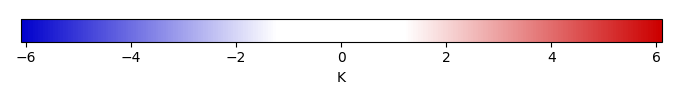
Bias [K] |
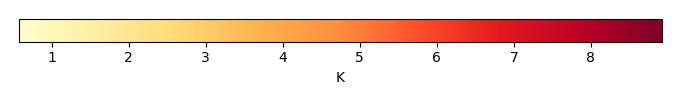
RMSE [K] |
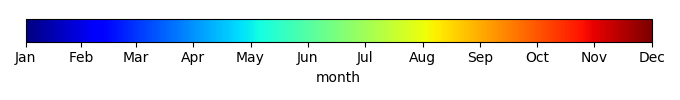
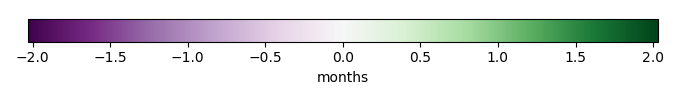
Phase Shift [months] |
Bias Score [1] |
RMSE Score [1] |
Seasonal Cycle Score [1] |
Spatial Distribution Score [1] |
Interannual Variability Score [1] |
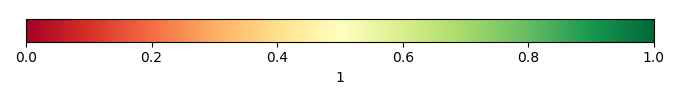
Overall Score [1] |
|||
|---|---|---|---|---|---|---|---|---|---|---|---|---|---|---|---|---|---|
| Benchmark | [-] | 304. | |||||||||||||||
| CON | [-] | 306. | 306. | 304. | 304. | 305. | 1.62 | 2.11 | 0.376 | 0.293 | 0.642 | 0.956 | 0.996 | 0.820 | 0.725 | ||
| OP | [-] | 306. | 306. | 304. | 304. | 305. | 1.59 | 2.08 | 0.376 | 0.298 | 0.643 | 0.956 | 0.996 | 0.820 | 0.726 |
Download Data |
Period Mean (original grids) [K] |
Model Period Mean (intersection) [K] |
Model Period Mean (complement) [K] |
Benchmark Period Mean (intersection) [K] |
Benchmark Period Mean (complement) [K] |
Bias [K] |
RMSE [K] |
Phase Shift [months] |
Bias Score [1] |
RMSE Score [1] |
Seasonal Cycle Score [1] |
Spatial Distribution Score [1] |
Interannual Variability Score [1] |
Overall Score [1] |
|||
|---|---|---|---|---|---|---|---|---|---|---|---|---|---|---|---|---|---|
| Benchmark | [-] | 307. | |||||||||||||||
| CON | [-] | 309. | 309. | 305. | 307. | 306. | 2.04 | 2.42 | 0.232 | 0.471 | 0.763 | 0.981 | 0.999 | 0.909 | 0.814 | ||
| OP | [-] | 309. | 309. | 305. | 307. | 306. | 2.04 | 2.42 | 0.232 | 0.471 | 0.763 | 0.981 | 1.00 | 0.909 | 0.815 |
Download Data |
Period Mean (original grids) [K] |
Model Period Mean (intersection) [K] |
Model Period Mean (complement) [K] |
Benchmark Period Mean (intersection) [K] |
Benchmark Period Mean (complement) [K] |
Bias [K] |
RMSE [K] |
Phase Shift [months] |
Bias Score [1] |
RMSE Score [1] |
Seasonal Cycle Score [1] |
Spatial Distribution Score [1] |
Interannual Variability Score [1] |
Overall Score [1] |
|||
|---|---|---|---|---|---|---|---|---|---|---|---|---|---|---|---|---|---|
| Benchmark | [-] | 302. | |||||||||||||||
| CON | [-] | 304. | 304. | 301. | 302. | 299. | 1.59 | 2.14 | 0.439 | 0.440 | 0.709 | 0.948 | 0.997 | 0.857 | 0.777 | ||
| OP | [-] | 304. | 304. | 301. | 302. | 299. | 1.58 | 2.13 | 0.431 | 0.442 | 0.709 | 0.949 | 0.997 | 0.857 | 0.777 |
Download Data |
Period Mean (original grids) [K] |
Model Period Mean (intersection) [K] |
Model Period Mean (complement) [K] |
Benchmark Period Mean (intersection) [K] |
Benchmark Period Mean (complement) [K] |
Bias [K] |
RMSE [K] |
Phase Shift [months] |
Bias Score [1] |
RMSE Score [1] |
Seasonal Cycle Score [1] |
Spatial Distribution Score [1] |
Interannual Variability Score [1] |
Overall Score [1] |
|||
|---|---|---|---|---|---|---|---|---|---|---|---|---|---|---|---|---|---|
| Benchmark | [-] | 267. | |||||||||||||||
| CON | [-] | 267. | 267. | 270. | 267. | 270. | 0.707 | 2.00 | 0.0413 | 0.927 | 0.911 | 0.997 | 1.00 | 0.927 | 0.945 | ||
| OP | [-] | 267. | 267. | 270. | 267. | 270. | 0.675 | 1.99 | 0.0413 | 0.928 | 0.911 | 0.997 | 1.00 | 0.927 | 0.946 |
Download Data |
Period Mean (original grids) [K] |
Model Period Mean (intersection) [K] |
Model Period Mean (complement) [K] |
Benchmark Period Mean (intersection) [K] |
Benchmark Period Mean (complement) [K] |
Bias [K] |
RMSE [K] |
Phase Shift [months] |
Bias Score [1] |
RMSE Score [1] |
Seasonal Cycle Score [1] |
Spatial Distribution Score [1] |
Interannual Variability Score [1] |
Overall Score [1] |
|||
|---|---|---|---|---|---|---|---|---|---|---|---|---|---|---|---|---|---|
| Benchmark | [-] | 304. | |||||||||||||||
| CON | [-] | 305. | 305. | 305. | 304. | 304. | 0.981 | 1.74 | 0.973 | 0.171 | 0.495 | 0.854 | 0.864 | 0.827 | 0.618 | ||
| OP | [-] | 305. | 305. | 304. | 304. | 304. | 0.927 | 1.70 | 0.975 | 0.176 | 0.495 | 0.854 | 0.865 | 0.828 | 0.619 |
Download Data |
Period Mean (original grids) [K] |
Model Period Mean (intersection) [K] |
Model Period Mean (complement) [K] |
Benchmark Period Mean (intersection) [K] |
Benchmark Period Mean (complement) [K] |
Bias [K] |
RMSE [K] |
Phase Shift [months] |
Bias Score [1] |
RMSE Score [1] |
Seasonal Cycle Score [1] |
Spatial Distribution Score [1] |
Interannual Variability Score [1] |
Overall Score [1] |
|||
|---|---|---|---|---|---|---|---|---|---|---|---|---|---|---|---|---|---|
| Benchmark | [-] | 277. | |||||||||||||||
| CON | [-] | 277. | 277. | 279. | 277. | 278. | 0.264 | 1.21 | 0.00937 | 0.950 | 0.942 | 0.999 | 1.00 | 0.963 | 0.966 | ||
| OP | [-] | 277. | 277. | 279. | 277. | 278. | 0.232 | 1.20 | 0.00937 | 0.951 | 0.943 | 0.999 | 1.00 | 0.964 | 0.967 |
Download Data |
Period Mean (original grids) [K] |
Model Period Mean (intersection) [K] |
Model Period Mean (complement) [K] |
Benchmark Period Mean (intersection) [K] |
Benchmark Period Mean (complement) [K] |
Bias [K] |
RMSE [K] |
Phase Shift [months] |
Bias Score [1] |
RMSE Score [1] |
Seasonal Cycle Score [1] |
Spatial Distribution Score [1] |
Interannual Variability Score [1] |
Overall Score [1] |
|||
|---|---|---|---|---|---|---|---|---|---|---|---|---|---|---|---|---|---|
| Benchmark | [-] | 286. | |||||||||||||||
| CON | [-] | 287. | 287. | 291. | 286. | 292. | 1.04 | 2.03 | 0.0798 | 0.846 | 0.916 | 0.993 | 1.00 | 0.930 | 0.934 | ||
| OP | [-] | 287. | 287. | 291. | 286. | 292. | 1.03 | 2.02 | 0.0786 | 0.846 | 0.916 | 0.994 | 1.00 | 0.931 | 0.934 |
Download Data |
Period Mean (original grids) [K] |
Model Period Mean (intersection) [K] |
Model Period Mean (complement) [K] |
Benchmark Period Mean (intersection) [K] |
Benchmark Period Mean (complement) [K] |
Bias [K] |
RMSE [K] |
Phase Shift [months] |
Bias Score [1] |
RMSE Score [1] |
Seasonal Cycle Score [1] |
Spatial Distribution Score [1] |
Interannual Variability Score [1] |
Overall Score [1] |
|||
|---|---|---|---|---|---|---|---|---|---|---|---|---|---|---|---|---|---|
| Benchmark | [-] | 303. | |||||||||||||||
| CON | [-] | 304. | 304. | 305. | 303. | 303. | 1.12 | 2.25 | 0.301 | 0.574 | 0.773 | 0.968 | 0.998 | 0.899 | 0.831 | ||
| OP | [-] | 304. | 304. | 305. | 303. | 303. | 1.11 | 2.25 | 0.293 | 0.576 | 0.773 | 0.968 | 0.998 | 0.899 | 0.831 |
Download Data |
Period Mean (original grids) [K] |
Model Period Mean (intersection) [K] |
Model Period Mean (complement) [K] |
Benchmark Period Mean (intersection) [K] |
Benchmark Period Mean (complement) [K] |
Bias [K] |
RMSE [K] |
Phase Shift [months] |
Bias Score [1] |
RMSE Score [1] |
Seasonal Cycle Score [1] |
Spatial Distribution Score [1] |
Interannual Variability Score [1] |
Overall Score [1] |
|||
|---|---|---|---|---|---|---|---|---|---|---|---|---|---|---|---|---|---|
| Benchmark | [-] | 268. | |||||||||||||||
| CON | [-] | 268. | 268. | 269. | 268. | 269. | -0.0839 | 1.38 | 0.0226 | 0.956 | 0.926 | 0.998 | 1.00 | 0.952 | 0.960 | ||
| OP | [-] | 268. | 268. | 269. | 268. | 269. | -0.110 | 1.39 | 0.0226 | 0.955 | 0.926 | 0.998 | 1.00 | 0.952 | 0.960 |
Download Data |
Period Mean (original grids) [K] |
Model Period Mean (intersection) [K] |
Model Period Mean (complement) [K] |
Benchmark Period Mean (intersection) [K] |
Benchmark Period Mean (complement) [K] |
Bias [K] |
RMSE [K] |
Phase Shift [months] |
Bias Score [1] |
RMSE Score [1] |
Seasonal Cycle Score [1] |
Spatial Distribution Score [1] |
Interannual Variability Score [1] |
Overall Score [1] |
|||
|---|---|---|---|---|---|---|---|---|---|---|---|---|---|---|---|---|---|
| Benchmark | [-] | 301. | |||||||||||||||
| CON | [-] | 304. | 304. | 298. | 301. | 300. | 1.66 | 2.07 | 0.153 | 0.663 | 0.860 | 0.987 | 0.999 | 0.869 | 0.873 | ||
| OP | [-] | 304. | 304. | 298. | 301. | 300. | 1.64 | 2.05 | 0.159 | 0.665 | 0.860 | 0.986 | 0.999 | 0.869 | 0.873 |
Download Data |
Period Mean (original grids) [K] |
Model Period Mean (intersection) [K] |
Model Period Mean (complement) [K] |
Benchmark Period Mean (intersection) [K] |
Benchmark Period Mean (complement) [K] |
Bias [K] |
RMSE [K] |
Phase Shift [months] |
Bias Score [1] |
RMSE Score [1] |
Seasonal Cycle Score [1] |
Spatial Distribution Score [1] |
Interannual Variability Score [1] |
Overall Score [1] |
|||
|---|---|---|---|---|---|---|---|---|---|---|---|---|---|---|---|---|---|
| Benchmark | [-] | 287. | |||||||||||||||
| CON | [-] | 287. | 287. | 288. | 287. | 286. | 0.348 | 1.57 | 0.338 | 0.862 | 0.889 | 0.977 | 0.998 | 0.927 | 0.924 | ||
| OP | [-] | 287. | 287. | 288. | 287. | 286. | 0.330 | 1.57 | 0.351 | 0.862 | 0.889 | 0.976 | 0.998 | 0.928 | 0.924 |
Download Data |
Period Mean (original grids) [K] |
Model Period Mean (intersection) [K] |
Model Period Mean (complement) [K] |
Benchmark Period Mean (intersection) [K] |
Benchmark Period Mean (complement) [K] |
Bias [K] |
RMSE [K] |
Phase Shift [months] |
Bias Score [1] |
RMSE Score [1] |
Seasonal Cycle Score [1] |
Spatial Distribution Score [1] |
Interannual Variability Score [1] |
Overall Score [1] |
|||
|---|---|---|---|---|---|---|---|---|---|---|---|---|---|---|---|---|---|
| Benchmark | [-] | 293. | |||||||||||||||
| CON | [-] | 289. | 294. | 260. | 293. | 297. | 1.10 | 2.03 | 0.230 | 0.674 | 0.826 | 0.975 | 0.997 | 0.907 | 0.867 | ||
| OP | [-] | 289. | 294. | 260. | 293. | 297. | 1.08 | 2.02 | 0.229 | 0.675 | 0.826 | 0.975 | 0.997 | 0.907 | 0.868 |
Download Data |
Period Mean (original grids) [K] |
Model Period Mean (intersection) [K] |
Model Period Mean (complement) [K] |
Benchmark Period Mean (intersection) [K] |
Benchmark Period Mean (complement) [K] |
Bias [K] |
RMSE [K] |
Phase Shift [months] |
Bias Score [1] |
RMSE Score [1] |
Seasonal Cycle Score [1] |
Spatial Distribution Score [1] |
Interannual Variability Score [1] |
Overall Score [1] |
|||
|---|---|---|---|---|---|---|---|---|---|---|---|---|---|---|---|---|---|
| Benchmark | [-] | 303. | |||||||||||||||
| CON | [-] | 305. | 305. | 300. | 303. | 300. | 1.65 | 2.35 | 0.187 | 0.723 | 0.879 | 0.984 | 0.998 | 0.915 | 0.896 | ||
| OP | [-] | 305. | 305. | 300. | 303. | 300. | 1.65 | 2.35 | 0.187 | 0.723 | 0.879 | 0.984 | 0.998 | 0.915 | 0.896 |
Download Data |
Period Mean (original grids) [K] |
Model Period Mean (intersection) [K] |
Model Period Mean (complement) [K] |
Benchmark Period Mean (intersection) [K] |
Benchmark Period Mean (complement) [K] |
Bias [K] |
RMSE [K] |
Phase Shift [months] |
Bias Score [1] |
RMSE Score [1] |
Seasonal Cycle Score [1] |
Spatial Distribution Score [1] |
Interannual Variability Score [1] |
Overall Score [1] |
|||
|---|---|---|---|---|---|---|---|---|---|---|---|---|---|---|---|---|---|
| Benchmark | [-] | 269. | |||||||||||||||
| CON | [-] | 270. | 270. | 268. | 269. | 272. | 0.423 | 1.88 | 0.0462 | 0.920 | 0.895 | 0.997 | 1.00 | 0.931 | 0.940 | ||
| OP | [-] | 270. | 270. | 268. | 269. | 272. | 0.405 | 1.87 | 0.0462 | 0.920 | 0.895 | 0.997 | 1.00 | 0.931 | 0.940 |
Download Data |
Period Mean (original grids) [K] |
Model Period Mean (intersection) [K] |
Model Period Mean (complement) [K] |
Benchmark Period Mean (intersection) [K] |
Benchmark Period Mean (complement) [K] |
Bias [K] |
RMSE [K] |
Phase Shift [months] |
Bias Score [1] |
RMSE Score [1] |
Seasonal Cycle Score [1] |
Spatial Distribution Score [1] |
Interannual Variability Score [1] |
Overall Score [1] |
|||
|---|---|---|---|---|---|---|---|---|---|---|---|---|---|---|---|---|---|
| Benchmark | [-] | 303. | |||||||||||||||
| CON | [-] | 304. | 304. | 304. | 303. | 303. | 1.00 | 2.29 | 0.451 | 0.527 | 0.712 | 0.948 | 0.974 | 0.876 | 0.792 | ||
| OP | [-] | 304. | 304. | 304. | 303. | 303. | 0.979 | 2.28 | 0.451 | 0.529 | 0.712 | 0.948 | 0.974 | 0.876 | 0.792 |
Download Data |
Period Mean (original grids) [K] |
Model Period Mean (intersection) [K] |
Model Period Mean (complement) [K] |
Benchmark Period Mean (intersection) [K] |
Benchmark Period Mean (complement) [K] |
Bias [K] |
RMSE [K] |
Phase Shift [months] |
Bias Score [1] |
RMSE Score [1] |
Seasonal Cycle Score [1] |
Spatial Distribution Score [1] |
Interannual Variability Score [1] |
Overall Score [1] |
|||
|---|---|---|---|---|---|---|---|---|---|---|---|---|---|---|---|---|---|
| Benchmark | [-] | 292. | |||||||||||||||
| CON | [-] | 293. | 293. | 299. | 292. | 295. | 0.919 | 1.40 | 0.119 | 0.871 | 0.926 | 0.992 | 0.996 | 0.952 | 0.944 | ||
| OP | [-] | 293. | 293. | 299. | 292. | 295. | 0.899 | 1.39 | 0.108 | 0.872 | 0.926 | 0.993 | 0.996 | 0.952 | 0.944 |
Download Data |
Period Mean (original grids) [K] |
Model Period Mean (intersection) [K] |
Model Period Mean (complement) [K] |
Benchmark Period Mean (intersection) [K] |
Benchmark Period Mean (complement) [K] |
Bias [K] |
RMSE [K] |
Phase Shift [months] |
Bias Score [1] |
RMSE Score [1] |
Seasonal Cycle Score [1] |
Spatial Distribution Score [1] |
Interannual Variability Score [1] |
Overall Score [1] |
|||
|---|---|---|---|---|---|---|---|---|---|---|---|---|---|---|---|---|---|
| Benchmark | [-] | 280. | |||||||||||||||
| CON | [-] | 280. | 280. | 282. | 280. | 283. | 0.568 | 1.40 | 0.0773 | 0.914 | 0.921 | 0.995 | 0.998 | 0.953 | 0.950 | ||
| OP | [-] | 280. | 280. | 282. | 280. | 283. | 0.528 | 1.37 | 0.0778 | 0.915 | 0.921 | 0.995 | 0.998 | 0.954 | 0.951 |
Download Data |
Period Mean (original grids) [K] |
Model Period Mean (intersection) [K] |
Model Period Mean (complement) [K] |
Benchmark Period Mean (intersection) [K] |
Benchmark Period Mean (complement) [K] |
Bias [K] |
RMSE [K] |
Phase Shift [months] |
Bias Score [1] |
RMSE Score [1] |
Seasonal Cycle Score [1] |
Spatial Distribution Score [1] |
Interannual Variability Score [1] |
Overall Score [1] |
|||
|---|---|---|---|---|---|---|---|---|---|---|---|---|---|---|---|---|---|
| Benchmark | [-] | 291. | |||||||||||||||
| CON | [-] | 292. | 293. | 292. | 291. | 295. | 1.28 | 2.09 | 0.0760 | 0.823 | 0.899 | 0.995 | 0.996 | 0.930 | 0.923 | ||
| OP | [-] | 292. | 293. | 292. | 291. | 295. | 1.27 | 2.08 | 0.0842 | 0.823 | 0.899 | 0.994 | 0.996 | 0.930 | 0.923 |
Download Data |
Period Mean (original grids) [K] |
Model Period Mean (intersection) [K] |
Model Period Mean (complement) [K] |
Benchmark Period Mean (intersection) [K] |
Benchmark Period Mean (complement) [K] |
Bias [K] |
RMSE [K] |
Phase Shift [months] |
Bias Score [1] |
RMSE Score [1] |
Seasonal Cycle Score [1] |
Spatial Distribution Score [1] |
Interannual Variability Score [1] |
Overall Score [1] |
|||
|---|---|---|---|---|---|---|---|---|---|---|---|---|---|---|---|---|---|
| Benchmark | [-] | 304. | |||||||||||||||
| CON | [-] | 306. | 306. | 304. | 304. | 304. | 1.67 | 2.11 | 0.550 | 0.231 | 0.654 | 0.929 | 1.00 | 0.888 | 0.726 | ||
| OP | [-] | 306. | 306. | 304. | 304. | 304. | 1.62 | 2.06 | 0.528 | 0.239 | 0.654 | 0.931 | 1.00 | 0.888 | 0.728 |
Download Data |
Period Mean (original grids) [K] |
Model Period Mean (intersection) [K] |
Model Period Mean (complement) [K] |
Benchmark Period Mean (intersection) [K] |
Benchmark Period Mean (complement) [K] |
Bias [K] |
RMSE [K] |
Phase Shift [months] |
Bias Score [1] |
RMSE Score [1] |
Seasonal Cycle Score [1] |
Spatial Distribution Score [1] |
Interannual Variability Score [1] |
Overall Score [1] |
|||
|---|---|---|---|---|---|---|---|---|---|---|---|---|---|---|---|---|---|
| Benchmark | [-] | 302. | |||||||||||||||
| CON | [-] | 303. | 304. | 300. | 302. | 301. | 1.64 | 1.92 | 0.305 | 0.489 | 0.773 | 0.963 | 0.996 | 0.896 | 0.815 | ||
| OP | [-] | 303. | 304. | 300. | 302. | 301. | 1.63 | 1.91 | 0.305 | 0.491 | 0.773 | 0.963 | 0.996 | 0.897 | 0.816 |
Download Data |
Period Mean (original grids) [K] |
Model Period Mean (intersection) [K] |
Model Period Mean (complement) [K] |
Benchmark Period Mean (intersection) [K] |
Benchmark Period Mean (complement) [K] |
Bias [K] |
RMSE [K] |
Phase Shift [months] |
Bias Score [1] |
RMSE Score [1] |
Seasonal Cycle Score [1] |
Spatial Distribution Score [1] |
Interannual Variability Score [1] |
Overall Score [1] |
|||
|---|---|---|---|---|---|---|---|---|---|---|---|---|---|---|---|---|---|
| Benchmark | [-] | 290. | |||||||||||||||
| CON | [-] | 293. | 292. | 293. | 290. | 288. | 1.69 | 2.99 | 0.479 | 0.524 | 0.735 | 0.939 | 0.990 | 0.864 | 0.798 | ||
| OP | [-] | 293. | 292. | 293. | 290. | 288. | 1.67 | 2.98 | 0.479 | 0.525 | 0.735 | 0.939 | 0.990 | 0.864 | 0.798 |
Temporally integrated period mean