Mean State
Download Data |
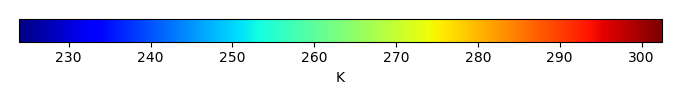
Period Mean (original grids) [K] |
Model Period Mean (intersection) [K] |
Model Period Mean (complement) [K] |
Benchmark Period Mean (intersection) [K] |
Benchmark Period Mean (complement) [K] |
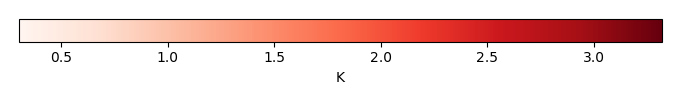
Bias [K] |
RMSE [K] |
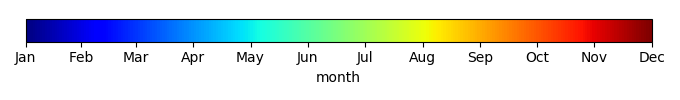
Phase Shift [months] |
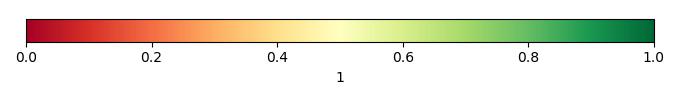
Bias Score [1] |
RMSE Score [1] |
Seasonal Cycle Score [1] |
Spatial Distribution Score [1] |
Interannual Variability Score [1] |
Overall Score [1] |
|||
|---|---|---|---|---|---|---|---|---|---|---|---|---|---|---|---|---|---|
| Benchmark | [-] | 299. | |||||||||||||||
| CON | [-] | 299. | 299. | 300. | 299. | 301. | 0.344 | 0.918 | 0.454 | 0.608 | 0.753 | 0.958 | 1.00 | 0.935 | 0.835 | ||
| OP | [-] | 299. | 299. | 300. | 299. | 301. | 0.317 | 0.917 | 0.464 | 0.609 | 0.750 | 0.957 | 1.00 | 0.935 | 0.834 |
Download Data |
Period Mean (original grids) [K] |
Model Period Mean (intersection) [K] |
Model Period Mean (complement) [K] |
Benchmark Period Mean (intersection) [K] |
Benchmark Period Mean (complement) [K] |
Bias [K] |
RMSE [K] |
Phase Shift [months] |
Bias Score [1] |
RMSE Score [1] |
Seasonal Cycle Score [1] |
Spatial Distribution Score [1] |
Interannual Variability Score [1] |
Overall Score [1] |
|||
|---|---|---|---|---|---|---|---|---|---|---|---|---|---|---|---|---|---|
| Benchmark | [-] | 300. | |||||||||||||||
| CON | [-] | 301. | 301. | 300. | 300. | 300. | 0.478 | 1.07 | 0.233 | 0.713 | 0.809 | 0.981 | 0.983 | 0.948 | 0.874 | ||
| OP | [-] | 301. | 301. | 300. | 300. | 300. | 0.473 | 1.07 | 0.233 | 0.714 | 0.809 | 0.981 | 0.984 | 0.948 | 0.874 |
Download Data |
Period Mean (original grids) [K] |
Model Period Mean (intersection) [K] |
Model Period Mean (complement) [K] |
Benchmark Period Mean (intersection) [K] |
Benchmark Period Mean (complement) [K] |
Bias [K] |
RMSE [K] |
Phase Shift [months] |
Bias Score [1] |
RMSE Score [1] |
Seasonal Cycle Score [1] |
Spatial Distribution Score [1] |
Interannual Variability Score [1] |
Overall Score [1] |
|||
|---|---|---|---|---|---|---|---|---|---|---|---|---|---|---|---|---|---|
| Benchmark | [-] | 295. | |||||||||||||||
| CON | [-] | 296. | 296. | 297. | 295. | 295. | 0.553 | 1.12 | 0.368 | 0.666 | 0.832 | 0.957 | 1.00 | 0.933 | 0.870 | ||
| OP | [-] | 296. | 296. | 297. | 295. | 295. | 0.539 | 1.11 | 0.368 | 0.668 | 0.832 | 0.958 | 1.00 | 0.932 | 0.870 |
Download Data |
Period Mean (original grids) [K] |
Model Period Mean (intersection) [K] |
Model Period Mean (complement) [K] |
Benchmark Period Mean (intersection) [K] |
Benchmark Period Mean (complement) [K] |
Bias [K] |
RMSE [K] |
Phase Shift [months] |
Bias Score [1] |
RMSE Score [1] |
Seasonal Cycle Score [1] |
Spatial Distribution Score [1] |
Interannual Variability Score [1] |
Overall Score [1] |
|||
|---|---|---|---|---|---|---|---|---|---|---|---|---|---|---|---|---|---|
| Benchmark | [-] | 262. | |||||||||||||||
| CON | [-] | 262. | 262. | 266. | 262. | 267. | 0.514 | 1.77 | 0.0288 | 0.918 | 0.935 | 0.998 | 0.998 | 0.926 | 0.952 | ||
| OP | [-] | 262. | 262. | 266. | 262. | 267. | 0.498 | 1.76 | 0.0288 | 0.918 | 0.936 | 0.998 | 0.998 | 0.926 | 0.952 |
Download Data |
Period Mean (original grids) [K] |
Model Period Mean (intersection) [K] |
Model Period Mean (complement) [K] |
Benchmark Period Mean (intersection) [K] |
Benchmark Period Mean (complement) [K] |
Bias [K] |
RMSE [K] |
Phase Shift [months] |
Bias Score [1] |
RMSE Score [1] |
Seasonal Cycle Score [1] |
Spatial Distribution Score [1] |
Interannual Variability Score [1] |
Overall Score [1] |
|||
|---|---|---|---|---|---|---|---|---|---|---|---|---|---|---|---|---|---|
| Benchmark | [-] | 299. | |||||||||||||||
| CON | [-] | 299. | 299. | 300. | 299. | 299. | 0.328 | 1.03 | 0.577 | 0.356 | 0.657 | 0.916 | 0.904 | 0.877 | 0.728 | ||
| OP | [-] | 299. | 299. | 300. | 299. | 299. | 0.297 | 1.02 | 0.570 | 0.359 | 0.655 | 0.916 | 0.906 | 0.876 | 0.728 |
Download Data |
Period Mean (original grids) [K] |
Model Period Mean (intersection) [K] |
Model Period Mean (complement) [K] |
Benchmark Period Mean (intersection) [K] |
Benchmark Period Mean (complement) [K] |
Bias [K] |
RMSE [K] |
Phase Shift [months] |
Bias Score [1] |
RMSE Score [1] |
Seasonal Cycle Score [1] |
Spatial Distribution Score [1] |
Interannual Variability Score [1] |
Overall Score [1] |
|||
|---|---|---|---|---|---|---|---|---|---|---|---|---|---|---|---|---|---|
| Benchmark | [-] | 272. | |||||||||||||||
| CON | [-] | 271. | 271. | 274. | 271. | 274. | -0.0331 | 0.894 | 0.0123 | 0.954 | 0.964 | 0.999 | 1.00 | 0.975 | 0.976 | ||
| OP | [-] | 271. | 271. | 274. | 271. | 274. | -0.0496 | 0.893 | 0.0123 | 0.954 | 0.964 | 0.999 | 1.00 | 0.975 | 0.976 |
Download Data |
Period Mean (original grids) [K] |
Model Period Mean (intersection) [K] |
Model Period Mean (complement) [K] |
Benchmark Period Mean (intersection) [K] |
Benchmark Period Mean (complement) [K] |
Bias [K] |
RMSE [K] |
Phase Shift [months] |
Bias Score [1] |
RMSE Score [1] |
Seasonal Cycle Score [1] |
Spatial Distribution Score [1] |
Interannual Variability Score [1] |
Overall Score [1] |
|||
|---|---|---|---|---|---|---|---|---|---|---|---|---|---|---|---|---|---|
| Benchmark | [-] | 281. | |||||||||||||||
| CON | [-] | 281. | 281. | 288. | 281. | 288. | 0.329 | 1.59 | 0.0337 | 0.873 | 0.942 | 0.998 | 1.00 | 0.955 | 0.951 | ||
| OP | [-] | 281. | 281. | 288. | 281. | 288. | 0.320 | 1.59 | 0.0372 | 0.873 | 0.942 | 0.997 | 1.00 | 0.955 | 0.951 |
Download Data |
Period Mean (original grids) [K] |
Model Period Mean (intersection) [K] |
Model Period Mean (complement) [K] |
Benchmark Period Mean (intersection) [K] |
Benchmark Period Mean (complement) [K] |
Bias [K] |
RMSE [K] |
Phase Shift [months] |
Bias Score [1] |
RMSE Score [1] |
Seasonal Cycle Score [1] |
Spatial Distribution Score [1] |
Interannual Variability Score [1] |
Overall Score [1] |
|||
|---|---|---|---|---|---|---|---|---|---|---|---|---|---|---|---|---|---|
| Benchmark | [-] | 297. | |||||||||||||||
| CON | [-] | 297. | 297. | 300. | 297. | 299. | 0.0499 | 1.55 | 0.277 | 0.714 | 0.831 | 0.972 | 0.997 | 0.925 | 0.878 | ||
| OP | [-] | 297. | 297. | 300. | 297. | 299. | 0.0307 | 1.55 | 0.280 | 0.715 | 0.831 | 0.972 | 0.997 | 0.924 | 0.878 |
Download Data |
Period Mean (original grids) [K] |
Model Period Mean (intersection) [K] |
Model Period Mean (complement) [K] |
Benchmark Period Mean (intersection) [K] |
Benchmark Period Mean (complement) [K] |
Bias [K] |
RMSE [K] |
Phase Shift [months] |
Bias Score [1] |
RMSE Score [1] |
Seasonal Cycle Score [1] |
Spatial Distribution Score [1] |
Interannual Variability Score [1] |
Overall Score [1] |
|||
|---|---|---|---|---|---|---|---|---|---|---|---|---|---|---|---|---|---|
| Benchmark | [-] | 264. | |||||||||||||||
| CON | [-] | 264. | 264. | 266. | 264. | 265. | 0.107 | 1.03 | 0.0211 | 0.953 | 0.954 | 0.999 | 1.00 | 0.954 | 0.969 | ||
| OP | [-] | 264. | 264. | 266. | 264. | 265. | 0.0920 | 1.03 | 0.0211 | 0.953 | 0.954 | 0.999 | 1.00 | 0.954 | 0.969 |
Download Data |
Period Mean (original grids) [K] |
Model Period Mean (intersection) [K] |
Model Period Mean (complement) [K] |
Benchmark Period Mean (intersection) [K] |
Benchmark Period Mean (complement) [K] |
Bias [K] |
RMSE [K] |
Phase Shift [months] |
Bias Score [1] |
RMSE Score [1] |
Seasonal Cycle Score [1] |
Spatial Distribution Score [1] |
Interannual Variability Score [1] |
Overall Score [1] |
|||
|---|---|---|---|---|---|---|---|---|---|---|---|---|---|---|---|---|---|
| Benchmark | [-] | 295. | |||||||||||||||
| CON | [-] | 295. | 295. | 293. | 295. | 294. | 0.528 | 0.902 | 0.120 | 0.853 | 0.903 | 0.991 | 0.999 | 0.948 | 0.933 | ||
| OP | [-] | 295. | 295. | 293. | 295. | 294. | 0.516 | 0.896 | 0.115 | 0.854 | 0.903 | 0.991 | 1.00 | 0.947 | 0.933 |
Download Data |
Period Mean (original grids) [K] |
Model Period Mean (intersection) [K] |
Model Period Mean (complement) [K] |
Benchmark Period Mean (intersection) [K] |
Benchmark Period Mean (complement) [K] |
Bias [K] |
RMSE [K] |
Phase Shift [months] |
Bias Score [1] |
RMSE Score [1] |
Seasonal Cycle Score [1] |
Spatial Distribution Score [1] |
Interannual Variability Score [1] |
Overall Score [1] |
|||
|---|---|---|---|---|---|---|---|---|---|---|---|---|---|---|---|---|---|
| Benchmark | [-] | 282. | |||||||||||||||
| CON | [-] | 282. | 282. | 284. | 282. | 283. | 0.125 | 1.28 | 0.185 | 0.862 | 0.914 | 0.988 | 1.00 | 0.949 | 0.938 | ||
| OP | [-] | 282. | 282. | 284. | 282. | 283. | 0.113 | 1.28 | 0.191 | 0.862 | 0.914 | 0.987 | 1.00 | 0.949 | 0.938 |
Download Data |
Period Mean (original grids) [K] |
Model Period Mean (intersection) [K] |
Model Period Mean (complement) [K] |
Benchmark Period Mean (intersection) [K] |
Benchmark Period Mean (complement) [K] |
Bias [K] |
RMSE [K] |
Phase Shift [months] |
Bias Score [1] |
RMSE Score [1] |
Seasonal Cycle Score [1] |
Spatial Distribution Score [1] |
Interannual Variability Score [1] |
Overall Score [1] |
|||
|---|---|---|---|---|---|---|---|---|---|---|---|---|---|---|---|---|---|
| Benchmark | [-] | 287. | |||||||||||||||
| CON | [-] | 283. | 287. | 256. | 287. | 293. | 0.271 | 1.27 | 0.187 | 0.795 | 0.879 | 0.980 | 1.00 | 0.943 | 0.913 | ||
| OP | [-] | 283. | 287. | 256. | 287. | 293. | 0.257 | 1.27 | 0.189 | 0.796 | 0.879 | 0.980 | 1.00 | 0.943 | 0.913 |
Download Data |
Period Mean (original grids) [K] |
Model Period Mean (intersection) [K] |
Model Period Mean (complement) [K] |
Benchmark Period Mean (intersection) [K] |
Benchmark Period Mean (complement) [K] |
Bias [K] |
RMSE [K] |
Phase Shift [months] |
Bias Score [1] |
RMSE Score [1] |
Seasonal Cycle Score [1] |
Spatial Distribution Score [1] |
Interannual Variability Score [1] |
Overall Score [1] |
|||
|---|---|---|---|---|---|---|---|---|---|---|---|---|---|---|---|---|---|
| Benchmark | [-] | 296. | |||||||||||||||
| CON | [-] | 296. | 296. | 295. | 296. | 295. | 0.180 | 1.19 | 0.170 | 0.868 | 0.918 | 0.988 | 1.00 | 0.951 | 0.940 | ||
| OP | [-] | 296. | 296. | 295. | 296. | 295. | 0.177 | 1.19 | 0.174 | 0.868 | 0.918 | 0.987 | 1.00 | 0.951 | 0.940 |
Download Data |
Period Mean (original grids) [K] |
Model Period Mean (intersection) [K] |
Model Period Mean (complement) [K] |
Benchmark Period Mean (intersection) [K] |
Benchmark Period Mean (complement) [K] |
Bias [K] |
RMSE [K] |
Phase Shift [months] |
Bias Score [1] |
RMSE Score [1] |
Seasonal Cycle Score [1] |
Spatial Distribution Score [1] |
Interannual Variability Score [1] |
Overall Score [1] |
|||
|---|---|---|---|---|---|---|---|---|---|---|---|---|---|---|---|---|---|
| Benchmark | [-] | 265. | |||||||||||||||
| CON | [-] | 265. | 265. | 266. | 265. | 268. | 0.451 | 1.51 | 0.0350 | 0.921 | 0.931 | 0.998 | 1.00 | 0.950 | 0.955 | ||
| OP | [-] | 265. | 265. | 266. | 265. | 268. | 0.442 | 1.51 | 0.0350 | 0.921 | 0.931 | 0.998 | 1.00 | 0.950 | 0.955 |
Download Data |
Period Mean (original grids) [K] |
Model Period Mean (intersection) [K] |
Model Period Mean (complement) [K] |
Benchmark Period Mean (intersection) [K] |
Benchmark Period Mean (complement) [K] |
Bias [K] |
RMSE [K] |
Phase Shift [months] |
Bias Score [1] |
RMSE Score [1] |
Seasonal Cycle Score [1] |
Spatial Distribution Score [1] |
Interannual Variability Score [1] |
Overall Score [1] |
|||
|---|---|---|---|---|---|---|---|---|---|---|---|---|---|---|---|---|---|
| Benchmark | [-] | 296. | |||||||||||||||
| CON | [-] | 296. | 295. | 298. | 296. | 299. | 0.463 | 1.70 | 0.406 | 0.614 | 0.806 | 0.958 | 0.999 | 0.912 | 0.849 | ||
| OP | [-] | 296. | 295. | 298. | 296. | 299. | 0.444 | 1.69 | 0.416 | 0.615 | 0.806 | 0.958 | 0.999 | 0.912 | 0.850 |
Download Data |
Period Mean (original grids) [K] |
Model Period Mean (intersection) [K] |
Model Period Mean (complement) [K] |
Benchmark Period Mean (intersection) [K] |
Benchmark Period Mean (complement) [K] |
Bias [K] |
RMSE [K] |
Phase Shift [months] |
Bias Score [1] |
RMSE Score [1] |
Seasonal Cycle Score [1] |
Spatial Distribution Score [1] |
Interannual Variability Score [1] |
Overall Score [1] |
|||
|---|---|---|---|---|---|---|---|---|---|---|---|---|---|---|---|---|---|
| Benchmark | [-] | 286. | |||||||||||||||
| CON | [-] | 286. | 286. | 294. | 286. | 290. | 0.297 | 0.898 | 0.0383 | 0.917 | 0.942 | 0.997 | 0.999 | 0.961 | 0.960 | ||
| OP | [-] | 286. | 286. | 294. | 286. | 290. | 0.282 | 0.895 | 0.0378 | 0.918 | 0.942 | 0.997 | 0.999 | 0.961 | 0.960 |
Download Data |
Period Mean (original grids) [K] |
Model Period Mean (intersection) [K] |
Model Period Mean (complement) [K] |
Benchmark Period Mean (intersection) [K] |
Benchmark Period Mean (complement) [K] |
Bias [K] |
RMSE [K] |
Phase Shift [months] |
Bias Score [1] |
RMSE Score [1] |
Seasonal Cycle Score [1] |
Spatial Distribution Score [1] |
Interannual Variability Score [1] |
Overall Score [1] |
|||
|---|---|---|---|---|---|---|---|---|---|---|---|---|---|---|---|---|---|
| Benchmark | [-] | 275. | |||||||||||||||
| CON | [-] | 275. | 274. | 278. | 275. | 279. | 0.0800 | 1.03 | 0.0417 | 0.924 | 0.942 | 0.997 | 0.998 | 0.963 | 0.961 | ||
| OP | [-] | 274. | 274. | 278. | 275. | 279. | 0.0604 | 1.02 | 0.0417 | 0.924 | 0.942 | 0.997 | 0.998 | 0.963 | 0.961 |
Download Data |
Period Mean (original grids) [K] |
Model Period Mean (intersection) [K] |
Model Period Mean (complement) [K] |
Benchmark Period Mean (intersection) [K] |
Benchmark Period Mean (complement) [K] |
Bias [K] |
RMSE [K] |
Phase Shift [months] |
Bias Score [1] |
RMSE Score [1] |
Seasonal Cycle Score [1] |
Spatial Distribution Score [1] |
Interannual Variability Score [1] |
Overall Score [1] |
|||
|---|---|---|---|---|---|---|---|---|---|---|---|---|---|---|---|---|---|
| Benchmark | [-] | 284. | |||||||||||||||
| CON | [-] | 284. | 284. | 287. | 284. | 289. | 0.455 | 1.63 | 0.0359 | 0.841 | 0.916 | 0.998 | 1.00 | 0.953 | 0.937 | ||
| OP | [-] | 284. | 284. | 287. | 284. | 289. | 0.447 | 1.62 | 0.0359 | 0.841 | 0.916 | 0.998 | 1.00 | 0.953 | 0.937 |
Download Data |
Period Mean (original grids) [K] |
Model Period Mean (intersection) [K] |
Model Period Mean (complement) [K] |
Benchmark Period Mean (intersection) [K] |
Benchmark Period Mean (complement) [K] |
Bias [K] |
RMSE [K] |
Phase Shift [months] |
Bias Score [1] |
RMSE Score [1] |
Seasonal Cycle Score [1] |
Spatial Distribution Score [1] |
Interannual Variability Score [1] |
Overall Score [1] |
|||
|---|---|---|---|---|---|---|---|---|---|---|---|---|---|---|---|---|---|
| Benchmark | [-] | 299. | |||||||||||||||
| CON | [-] | 299. | 299. | 300. | 299. | 300. | 0.170 | 0.956 | 0.485 | 0.612 | 0.739 | 0.932 | 0.999 | 0.910 | 0.822 | ||
| OP | [-] | 299. | 299. | 300. | 299. | 300. | 0.135 | 0.952 | 0.492 | 0.619 | 0.735 | 0.931 | 0.999 | 0.909 | 0.821 |
Download Data |
Period Mean (original grids) [K] |
Model Period Mean (intersection) [K] |
Model Period Mean (complement) [K] |
Benchmark Period Mean (intersection) [K] |
Benchmark Period Mean (complement) [K] |
Bias [K] |
RMSE [K] |
Phase Shift [months] |
Bias Score [1] |
RMSE Score [1] |
Seasonal Cycle Score [1] |
Spatial Distribution Score [1] |
Interannual Variability Score [1] |
Overall Score [1] |
|||
|---|---|---|---|---|---|---|---|---|---|---|---|---|---|---|---|---|---|
| Benchmark | [-] | 296. | |||||||||||||||
| CON | [-] | 296. | 296. | 295. | 296. | 297. | 0.370 | 0.891 | 0.334 | 0.726 | 0.844 | 0.958 | 0.999 | 0.946 | 0.886 | ||
| OP | [-] | 296. | 296. | 295. | 296. | 297. | 0.357 | 0.886 | 0.334 | 0.728 | 0.844 | 0.958 | 0.999 | 0.946 | 0.886 |
Download Data |
Period Mean (original grids) [K] |
Model Period Mean (intersection) [K] |
Model Period Mean (complement) [K] |
Benchmark Period Mean (intersection) [K] |
Benchmark Period Mean (complement) [K] |
Bias [K] |
RMSE [K] |
Phase Shift [months] |
Bias Score [1] |
RMSE Score [1] |
Seasonal Cycle Score [1] |
Spatial Distribution Score [1] |
Interannual Variability Score [1] |
Overall Score [1] |
|||
|---|---|---|---|---|---|---|---|---|---|---|---|---|---|---|---|---|---|
| Benchmark | [-] | 284. | |||||||||||||||
| CON | [-] | 285. | 284. | 288. | 284. | 284. | 0.641 | 2.44 | 0.294 | 0.592 | 0.817 | 0.959 | 0.999 | 0.925 | 0.851 | ||
| OP | [-] | 285. | 284. | 288. | 284. | 284. | 0.628 | 2.43 | 0.294 | 0.593 | 0.817 | 0.959 | 0.999 | 0.925 | 0.851 |
Temporally integrated period mean