Mean State
Download Data |
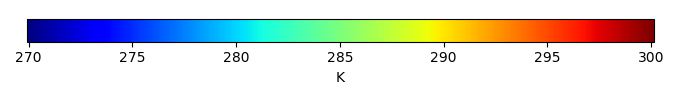
Period Mean (original grids) [K] |
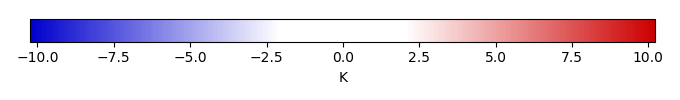
Bias [K] |
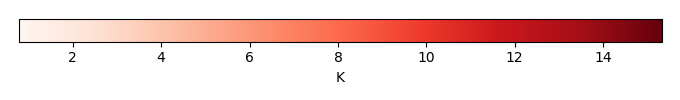
RMSE [K] |
Phase Shift [months] |
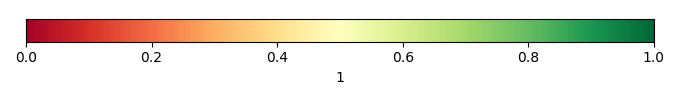
Bias Score [1] |
RMSE Score [1] |
Seasonal Cycle Score [1] |
Interannual Variability Score [1] |
Overall Score [1] |
|||
|---|---|---|---|---|---|---|---|---|---|---|---|---|
| Benchmark | [-] | 295. | ||||||||||
| CON | [-] | 297. | 1.90 | 2.16 | 1.00 | 0.568 | 0.696 | 0.935 | 0.903 | 0.760 | ||
| OP | [-] | 297. | 1.90 | 2.16 | 1.00 | 0.569 | 0.696 | 0.935 | 0.903 | 0.760 |
Download Data |
Period Mean (original grids) [K] |
Bias [K] |
RMSE [K] |
Phase Shift [months] |
Bias Score [1] |
RMSE Score [1] |
Seasonal Cycle Score [1] |
Interannual Variability Score [1] |
Overall Score [1] |
|||
|---|---|---|---|---|---|---|---|---|---|---|---|---|
| Benchmark | [-] | 275. | ||||||||||
| CON | [-] | 259. | -15.5 | 13.7 | 0.00 | 0.130 | 0.187 | 1.00 | 0.279 | 0.356 | ||
| OP | [-] | 259. | -15.5 | 13.7 | 0.00 | 0.130 | 0.187 | 1.00 | 0.279 | 0.357 |
Download Data |
Period Mean (original grids) [K] |
Bias [K] |
RMSE [K] |
Phase Shift [months] |
Bias Score [1] |
RMSE Score [1] |
Seasonal Cycle Score [1] |
Interannual Variability Score [1] |
Overall Score [1] |
|||
|---|---|---|---|---|---|---|---|---|---|---|---|---|
| Benchmark | [-] | 300. | ||||||||||
| CON | [-] | 297. | -2.97 | 2.96 | 0.00 | 0.000617 | 0.366 | 1.00 | 0.873 | 0.521 | ||
| OP | [-] | 297. | -3.01 | 3.00 | 0.00 | 0.000558 | 0.366 | 1.00 | 0.869 | 0.520 |
Download Data |
Period Mean (original grids) [K] |
Bias [K] |
RMSE [K] |
Phase Shift [months] |
Bias Score [1] |
RMSE Score [1] |
Seasonal Cycle Score [1] |
Interannual Variability Score [1] |
Overall Score [1] |
|||
|---|---|---|---|---|---|---|---|---|---|---|---|---|
| Benchmark | [-] | 277. | ||||||||||
| CON | [-] | 271. | -5.41 | 6.20 | 0.508 | 0.649 | 0.657 | 0.966 | 0.860 | 0.758 | ||
| OP | [-] | 271. | -5.43 | 6.21 | 0.508 | 0.648 | 0.657 | 0.966 | 0.861 | 0.758 |
Download Data |
Period Mean (original grids) [K] |
Bias [K] |
RMSE [K] |
Phase Shift [months] |
Bias Score [1] |
RMSE Score [1] |
Seasonal Cycle Score [1] |
Interannual Variability Score [1] |
Overall Score [1] |
|||
|---|---|---|---|---|---|---|---|---|---|---|---|---|
| Benchmark | [-] | 291. | ||||||||||
| CON | [-] | 295. | 4.01 | 4.43 | 0.508 | 0.420 | 0.659 | 0.966 | 0.825 | 0.706 | ||
| OP | [-] | 295. | 3.99 | 4.42 | 0.508 | 0.423 | 0.659 | 0.966 | 0.827 | 0.707 |
Download Data |
Period Mean (original grids) [K] |
Bias [K] |
RMSE [K] |
Phase Shift [months] |
Bias Score [1] |
RMSE Score [1] |
Seasonal Cycle Score [1] |
Interannual Variability Score [1] |
Overall Score [1] |
|||
|---|---|---|---|---|---|---|---|---|---|---|---|---|
| Benchmark | [-] | 283. | ||||||||||
| CON | [-] | 283. | -0.130 | 2.43 | 0.257 | 0.786 | 0.812 | 0.976 | 0.925 | 0.862 | ||
| OP | [-] | 283. | -0.142 | 2.43 | 0.257 | 0.786 | 0.813 | 0.976 | 0.925 | 0.862 |
Download Data |
Period Mean (original grids) [K] |
Bias [K] |
RMSE [K] |
Phase Shift [months] |
Bias Score [1] |
RMSE Score [1] |
Seasonal Cycle Score [1] |
Interannual Variability Score [1] |
Overall Score [1] |
|||
|---|---|---|---|---|---|---|---|---|---|---|---|---|
| Benchmark | [-] | 283. | ||||||||||
| CON | [-] | 282. | -0.603 | 2.69 | 0.197 | 0.780 | 0.789 | 0.983 | 0.923 | 0.853 | ||
| OP | [-] | 282. | -0.617 | 2.69 | 0.197 | 0.780 | 0.789 | 0.983 | 0.923 | 0.853 |
Download Data |
Period Mean (original grids) [K] |
Bias [K] |
RMSE [K] |
Phase Shift [months] |
Bias Score [1] |
RMSE Score [1] |
Seasonal Cycle Score [1] |
Interannual Variability Score [1] |
Overall Score [1] |
|||
|---|---|---|---|---|---|---|---|---|---|---|---|---|
| Benchmark | [-] | 292. | ||||||||||
| CON | [-] | 294. | 2.29 | 2.85 | 0.00 | 0.663 | 0.814 | 1.00 | 0.993 | 0.857 | ||
| OP | [-] | 294. | 2.29 | 2.84 | 0.00 | 0.664 | 0.814 | 1.00 | 0.994 | 0.857 |
Download Data |
Period Mean (original grids) [K] |
Bias [K] |
RMSE [K] |
Phase Shift [months] |
Bias Score [1] |
RMSE Score [1] |
Seasonal Cycle Score [1] |
Interannual Variability Score [1] |
Overall Score [1] |
|||
|---|---|---|---|---|---|---|---|---|---|---|---|---|
| Benchmark | [-] | 284. | ||||||||||
| CON | [-] | 284. | -0.00103 | 2.08 | 0.0984 | 0.890 | 0.821 | 0.993 | 0.940 | 0.893 | ||
| OP | [-] | 284. | -0.0185 | 2.08 | 0.0984 | 0.891 | 0.821 | 0.993 | 0.940 | 0.893 |
Download Data |
Period Mean (original grids) [K] |
Bias [K] |
RMSE [K] |
Phase Shift [months] |
Bias Score [1] |
RMSE Score [1] |
Seasonal Cycle Score [1] |
Interannual Variability Score [1] |
Overall Score [1] |
|||
|---|---|---|---|---|---|---|---|---|---|---|---|---|
| Benchmark | [-] | 274. | ||||||||||
| CON | [-] | 273. | -1.63 | 2.65 | 0.00 | 0.890 | 0.839 | 1.00 | 0.970 | 0.908 | ||
| OP | [-] | 273. | -1.65 | 2.65 | 0.00 | 0.889 | 0.839 | 1.00 | 0.971 | 0.908 |
Download Data |
Period Mean (original grids) [K] |
Bias [K] |
RMSE [K] |
Phase Shift [months] |
Bias Score [1] |
RMSE Score [1] |
Seasonal Cycle Score [1] |
Interannual Variability Score [1] |
Overall Score [1] |
|||
|---|---|---|---|---|---|---|---|---|---|---|---|---|
| Benchmark | [-] | 286. | ||||||||||
| CON | [-] | 283. | -3.00 | 4.07 | 0.169 | 0.659 | 0.731 | 0.989 | 0.918 | 0.805 | ||
| OP | [-] | 283. | -3.01 | 4.07 | 0.169 | 0.659 | 0.730 | 0.989 | 0.918 | 0.805 |
Download Data |
Period Mean (original grids) [K] |
Bias [K] |
RMSE [K] |
Phase Shift [months] |
Bias Score [1] |
RMSE Score [1] |
Seasonal Cycle Score [1] |
Interannual Variability Score [1] |
Overall Score [1] |
|||
|---|---|---|---|---|---|---|---|---|---|---|---|---|
| Benchmark | [-] | 299. | ||||||||||
| CON | [-] | 300. | 1.08 | 1.29 | 0.00 | 0.343 | 0.477 | 1.00 | 0.781 | 0.615 | ||
| OP | [-] | 300. | 1.03 | 1.24 | 0.00 | 0.361 | 0.477 | 1.00 | 0.774 | 0.618 |
Temporally integrated period mean