Mean State
Download Data |
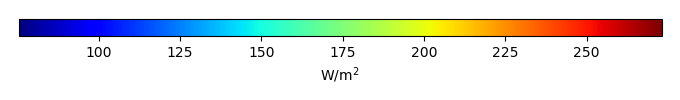
Period Mean (original grids) [W/m2] |
Model Period Mean (intersection) [W/m2] |
Model Period Mean (complement) [W/m2] |
Benchmark Period Mean (intersection) [W/m2] |
Benchmark Period Mean (complement) [W/m2] |
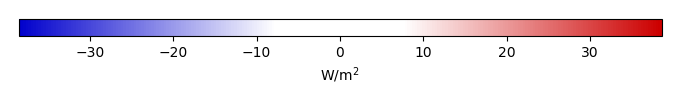
Bias [W/m2] |
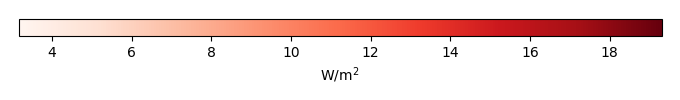
RMSE [W/m2] |
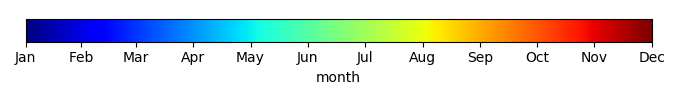
Phase Shift [months] |
Bias Score [1] |
RMSE Score [1] |
Seasonal Cycle Score [1] |
Spatial Distribution Score [1] |
Interannual Variability Score [1] |
Overall Score [1] |
|||
|---|---|---|---|---|---|---|---|---|---|---|---|---|---|---|---|---|---|
| Benchmark | [-] | 218. | |||||||||||||||
| CON | [-] | 214. | 215. | 218. | 226. | -2.25 | 17.9 | 0.919 | 0.710 | 0.483 | 0.889 | 0.941 | 0.815 | 0.720 | |||
| OP | [-] | 214. | 215. | 218. | 226. | -2.25 | 17.9 | 0.919 | 0.710 | 0.483 | 0.889 | 0.941 | 0.815 | 0.720 |
Download Data |
Period Mean (original grids) [W/m2] |
Model Period Mean (intersection) [W/m2] |
Model Period Mean (complement) [W/m2] |
Benchmark Period Mean (intersection) [W/m2] |
Benchmark Period Mean (complement) [W/m2] |
Bias [W/m2] |
RMSE [W/m2] |
Phase Shift [months] |
Bias Score [1] |
RMSE Score [1] |
Seasonal Cycle Score [1] |
Spatial Distribution Score [1] |
Interannual Variability Score [1] |
Overall Score [1] |
|||
|---|---|---|---|---|---|---|---|---|---|---|---|---|---|---|---|---|---|
| Benchmark | [-] | 243. | |||||||||||||||
| CON | [-] | 241. | 241. | 243. | 214. | -2.12 | 15.4 | 0.421 | 0.780 | 0.541 | 0.969 | 0.994 | 0.859 | 0.781 | |||
| OP | [-] | 241. | 241. | 243. | 214. | -2.12 | 15.4 | 0.421 | 0.780 | 0.541 | 0.969 | 0.994 | 0.859 | 0.781 |
Download Data |
Period Mean (original grids) [W/m2] |
Model Period Mean (intersection) [W/m2] |
Model Period Mean (complement) [W/m2] |
Benchmark Period Mean (intersection) [W/m2] |
Benchmark Period Mean (complement) [W/m2] |
Bias [W/m2] |
RMSE [W/m2] |
Phase Shift [months] |
Bias Score [1] |
RMSE Score [1] |
Seasonal Cycle Score [1] |
Spatial Distribution Score [1] |
Interannual Variability Score [1] |
Overall Score [1] |
|||
|---|---|---|---|---|---|---|---|---|---|---|---|---|---|---|---|---|---|
| Benchmark | [-] | 233. | |||||||||||||||
| CON | [-] | 233. | 232. | 233. | 233. | -0.580 | 17.8 | 0.857 | 0.814 | 0.568 | 0.884 | 0.981 | 0.752 | 0.761 | |||
| OP | [-] | 233. | 232. | 233. | 233. | -0.580 | 17.8 | 0.857 | 0.814 | 0.568 | 0.884 | 0.981 | 0.752 | 0.761 |
Download Data |
Period Mean (original grids) [W/m2] |
Model Period Mean (intersection) [W/m2] |
Model Period Mean (complement) [W/m2] |
Benchmark Period Mean (intersection) [W/m2] |
Benchmark Period Mean (complement) [W/m2] |
Bias [W/m2] |
RMSE [W/m2] |
Phase Shift [months] |
Bias Score [1] |
RMSE Score [1] |
Seasonal Cycle Score [1] |
Spatial Distribution Score [1] |
Interannual Variability Score [1] |
Overall Score [1] |
|||
|---|---|---|---|---|---|---|---|---|---|---|---|---|---|---|---|---|---|
| Benchmark | [-] | 111. | |||||||||||||||
| CON | [-] | 106. | 107. | 112. | 108. | -5.15 | 21.6 | 0.879 | 0.937 | 0.792 | 0.937 | 0.998 | 0.742 | 0.866 | |||
| OP | [-] | 106. | 107. | 112. | 108. | -5.15 | 21.6 | 0.879 | 0.937 | 0.792 | 0.937 | 0.998 | 0.742 | 0.866 |
Download Data |
Period Mean (original grids) [W/m2] |
Model Period Mean (intersection) [W/m2] |
Model Period Mean (complement) [W/m2] |
Benchmark Period Mean (intersection) [W/m2] |
Benchmark Period Mean (complement) [W/m2] |
Bias [W/m2] |
RMSE [W/m2] |
Phase Shift [months] |
Bias Score [1] |
RMSE Score [1] |
Seasonal Cycle Score [1] |
Spatial Distribution Score [1] |
Interannual Variability Score [1] |
Overall Score [1] |
|||
|---|---|---|---|---|---|---|---|---|---|---|---|---|---|---|---|---|---|
| Benchmark | [-] | 212. | |||||||||||||||
| CON | [-] | 203. | 202. | 211. | 219. | -0.897 | 18.6 | 1.10 | 0.688 | 0.437 | 0.831 | 0.951 | 0.764 | 0.684 | |||
| OP | [-] | 203. | 202. | 211. | 219. | -0.897 | 18.6 | 1.10 | 0.688 | 0.437 | 0.831 | 0.951 | 0.764 | 0.684 |
Download Data |
Period Mean (original grids) [W/m2] |
Model Period Mean (intersection) [W/m2] |
Model Period Mean (complement) [W/m2] |
Benchmark Period Mean (intersection) [W/m2] |
Benchmark Period Mean (complement) [W/m2] |
Bias [W/m2] |
RMSE [W/m2] |
Phase Shift [months] |
Bias Score [1] |
RMSE Score [1] |
Seasonal Cycle Score [1] |
Spatial Distribution Score [1] |
Interannual Variability Score [1] |
Overall Score [1] |
|||
|---|---|---|---|---|---|---|---|---|---|---|---|---|---|---|---|---|---|
| Benchmark | [-] | 126. | |||||||||||||||
| CON | [-] | 126. | 125. | 126. | 132. | 0.0648 | 14.8 | 0.338 | 0.954 | 0.832 | 0.973 | 0.974 | 0.642 | 0.868 | |||
| OP | [-] | 126. | 125. | 126. | 132. | 0.0648 | 14.8 | 0.338 | 0.954 | 0.832 | 0.973 | 0.974 | 0.642 | 0.868 |
Download Data |
Period Mean (original grids) [W/m2] |
Model Period Mean (intersection) [W/m2] |
Model Period Mean (complement) [W/m2] |
Benchmark Period Mean (intersection) [W/m2] |
Benchmark Period Mean (complement) [W/m2] |
Bias [W/m2] |
RMSE [W/m2] |
Phase Shift [months] |
Bias Score [1] |
RMSE Score [1] |
Seasonal Cycle Score [1] |
Spatial Distribution Score [1] |
Interannual Variability Score [1] |
Overall Score [1] |
|||
|---|---|---|---|---|---|---|---|---|---|---|---|---|---|---|---|---|---|
| Benchmark | [-] | 174. | |||||||||||||||
| CON | [-] | 170. | 170. | 174. | 163. | -4.36 | 18.3 | 0.396 | 0.864 | 0.773 | 0.967 | 0.977 | 0.626 | 0.830 | |||
| OP | [-] | 170. | 170. | 174. | 163. | -4.36 | 18.3 | 0.396 | 0.864 | 0.773 | 0.967 | 0.977 | 0.626 | 0.830 |
Download Data |
Period Mean (original grids) [W/m2] |
Model Period Mean (intersection) [W/m2] |
Model Period Mean (complement) [W/m2] |
Benchmark Period Mean (intersection) [W/m2] |
Benchmark Period Mean (complement) [W/m2] |
Bias [W/m2] |
RMSE [W/m2] |
Phase Shift [months] |
Bias Score [1] |
RMSE Score [1] |
Seasonal Cycle Score [1] |
Spatial Distribution Score [1] |
Interannual Variability Score [1] |
Overall Score [1] |
|||
|---|---|---|---|---|---|---|---|---|---|---|---|---|---|---|---|---|---|
| Benchmark | [-] | 210. | |||||||||||||||
| CON | [-] | 207. | 207. | 210. | 222. | -0.471 | 20.1 | 0.318 | 0.789 | 0.615 | 0.973 | 0.949 | 0.738 | 0.780 | |||
| OP | [-] | 207. | 207. | 210. | 222. | -0.471 | 20.1 | 0.318 | 0.789 | 0.615 | 0.973 | 0.949 | 0.738 | 0.780 |
Download Data |
Period Mean (original grids) [W/m2] |
Model Period Mean (intersection) [W/m2] |
Model Period Mean (complement) [W/m2] |
Benchmark Period Mean (intersection) [W/m2] |
Benchmark Period Mean (complement) [W/m2] |
Bias [W/m2] |
RMSE [W/m2] |
Phase Shift [months] |
Bias Score [1] |
RMSE Score [1] |
Seasonal Cycle Score [1] |
Spatial Distribution Score [1] |
Interannual Variability Score [1] |
Overall Score [1] |
|||
|---|---|---|---|---|---|---|---|---|---|---|---|---|---|---|---|---|---|
| Benchmark | [-] | 98.9 | |||||||||||||||
| CON | [-] | 95.7 | 96.4 | 99.0 | 92.4 | -3.54 | 20.5 | 0.669 | 0.947 | 0.805 | 0.954 | 0.892 | 0.675 | 0.846 | |||
| OP | [-] | 95.7 | 96.4 | 99.0 | 92.4 | -3.54 | 20.5 | 0.669 | 0.947 | 0.805 | 0.954 | 0.892 | 0.675 | 0.846 |
Download Data |
Period Mean (original grids) [W/m2] |
Model Period Mean (intersection) [W/m2] |
Model Period Mean (complement) [W/m2] |
Benchmark Period Mean (intersection) [W/m2] |
Benchmark Period Mean (complement) [W/m2] |
Bias [W/m2] |
RMSE [W/m2] |
Phase Shift [months] |
Bias Score [1] |
RMSE Score [1] |
Seasonal Cycle Score [1] |
Spatial Distribution Score [1] |
Interannual Variability Score [1] |
Overall Score [1] |
|||
|---|---|---|---|---|---|---|---|---|---|---|---|---|---|---|---|---|---|
| Benchmark | [-] | 235. | |||||||||||||||
| CON | [-] | 231. | 232. | 235. | 211. | -6.96 | 18.2 | 0.383 | 0.850 | 0.770 | 0.970 | 0.993 | 0.729 | 0.847 | |||
| OP | [-] | 231. | 232. | 235. | 211. | -6.96 | 18.2 | 0.383 | 0.850 | 0.770 | 0.970 | 0.993 | 0.729 | 0.847 |
Download Data |
Period Mean (original grids) [W/m2] |
Model Period Mean (intersection) [W/m2] |
Model Period Mean (complement) [W/m2] |
Benchmark Period Mean (intersection) [W/m2] |
Benchmark Period Mean (complement) [W/m2] |
Bias [W/m2] |
RMSE [W/m2] |
Phase Shift [months] |
Bias Score [1] |
RMSE Score [1] |
Seasonal Cycle Score [1] |
Spatial Distribution Score [1] |
Interannual Variability Score [1] |
Overall Score [1] |
|||
|---|---|---|---|---|---|---|---|---|---|---|---|---|---|---|---|---|---|
| Benchmark | [-] | 140. | |||||||||||||||
| CON | [-] | 135. | 135. | 140. | 125. | -0.119 | 15.1 | 0.236 | 0.929 | 0.842 | 0.984 | 0.999 | 0.657 | 0.875 | |||
| OP | [-] | 135. | 135. | 140. | 125. | -0.119 | 15.1 | 0.236 | 0.929 | 0.842 | 0.984 | 0.999 | 0.657 | 0.875 |
Download Data |
Period Mean (original grids) [W/m2] |
Model Period Mean (intersection) [W/m2] |
Model Period Mean (complement) [W/m2] |
Benchmark Period Mean (intersection) [W/m2] |
Benchmark Period Mean (complement) [W/m2] |
Bias [W/m2] |
RMSE [W/m2] |
Phase Shift [months] |
Bias Score [1] |
RMSE Score [1] |
Seasonal Cycle Score [1] |
Spatial Distribution Score [1] |
Interannual Variability Score [1] |
Overall Score [1] |
|||
|---|---|---|---|---|---|---|---|---|---|---|---|---|---|---|---|---|---|
| Benchmark | [-] | 187. | |||||||||||||||
| CON | [-] | 181. | 181. | 187. | 187. | -4.55 | 19.1 | 0.438 | 0.845 | 0.720 | 0.956 | 0.998 | 0.725 | 0.828 | |||
| OP | [-] | 181. | 181. | 187. | 187. | -4.55 | 19.1 | 0.438 | 0.845 | 0.720 | 0.956 | 0.998 | 0.725 | 0.828 |
Download Data |
Period Mean (original grids) [W/m2] |
Model Period Mean (intersection) [W/m2] |
Model Period Mean (complement) [W/m2] |
Benchmark Period Mean (intersection) [W/m2] |
Benchmark Period Mean (complement) [W/m2] |
Bias [W/m2] |
RMSE [W/m2] |
Phase Shift [months] |
Bias Score [1] |
RMSE Score [1] |
Seasonal Cycle Score [1] |
Spatial Distribution Score [1] |
Interannual Variability Score [1] |
Overall Score [1] |
|||
|---|---|---|---|---|---|---|---|---|---|---|---|---|---|---|---|---|---|
| Benchmark | [-] | 249. | |||||||||||||||
| CON | [-] | 240. | 240. | 249. | 227. | -9.60 | 17.8 | 0.367 | 0.804 | 0.768 | 0.970 | 0.998 | 0.708 | 0.836 | |||
| OP | [-] | 240. | 240. | 249. | 227. | -9.60 | 17.8 | 0.367 | 0.804 | 0.768 | 0.970 | 0.998 | 0.708 | 0.836 |
Download Data |
Period Mean (original grids) [W/m2] |
Model Period Mean (intersection) [W/m2] |
Model Period Mean (complement) [W/m2] |
Benchmark Period Mean (intersection) [W/m2] |
Benchmark Period Mean (complement) [W/m2] |
Bias [W/m2] |
RMSE [W/m2] |
Phase Shift [months] |
Bias Score [1] |
RMSE Score [1] |
Seasonal Cycle Score [1] |
Spatial Distribution Score [1] |
Interannual Variability Score [1] |
Overall Score [1] |
|||
|---|---|---|---|---|---|---|---|---|---|---|---|---|---|---|---|---|---|
| Benchmark | [-] | 116. | |||||||||||||||
| CON | [-] | 108. | 108. | 116. | 112. | -8.46 | 23.8 | 0.655 | 0.912 | 0.791 | 0.949 | 0.994 | 0.753 | 0.865 | |||
| OP | [-] | 108. | 108. | 116. | 112. | -8.46 | 23.8 | 0.655 | 0.912 | 0.791 | 0.949 | 0.994 | 0.753 | 0.865 |
Download Data |
Period Mean (original grids) [W/m2] |
Model Period Mean (intersection) [W/m2] |
Model Period Mean (complement) [W/m2] |
Benchmark Period Mean (intersection) [W/m2] |
Benchmark Period Mean (complement) [W/m2] |
Bias [W/m2] |
RMSE [W/m2] |
Phase Shift [months] |
Bias Score [1] |
RMSE Score [1] |
Seasonal Cycle Score [1] |
Spatial Distribution Score [1] |
Interannual Variability Score [1] |
Overall Score [1] |
|||
|---|---|---|---|---|---|---|---|---|---|---|---|---|---|---|---|---|---|
| Benchmark | [-] | 230. | |||||||||||||||
| CON | [-] | 226. | 227. | 230. | 225. | -0.611 | 18.4 | 0.367 | 0.784 | 0.682 | 0.960 | 0.992 | 0.753 | 0.809 | |||
| OP | [-] | 226. | 227. | 230. | 225. | -0.611 | 18.4 | 0.367 | 0.784 | 0.682 | 0.960 | 0.992 | 0.753 | 0.809 |
Download Data |
Period Mean (original grids) [W/m2] |
Model Period Mean (intersection) [W/m2] |
Model Period Mean (complement) [W/m2] |
Benchmark Period Mean (intersection) [W/m2] |
Benchmark Period Mean (complement) [W/m2] |
Bias [W/m2] |
RMSE [W/m2] |
Phase Shift [months] |
Bias Score [1] |
RMSE Score [1] |
Seasonal Cycle Score [1] |
Spatial Distribution Score [1] |
Interannual Variability Score [1] |
Overall Score [1] |
|||
|---|---|---|---|---|---|---|---|---|---|---|---|---|---|---|---|---|---|
| Benchmark | [-] | 177. | |||||||||||||||
| CON | [-] | 172. | 172. | 177. | 199. | -2.12 | 15.3 | 0.292 | 0.938 | 0.796 | 0.980 | 1.00 | 0.648 | 0.859 | |||
| OP | [-] | 172. | 172. | 177. | 199. | -2.12 | 15.3 | 0.292 | 0.938 | 0.796 | 0.980 | 1.00 | 0.648 | 0.859 |
Download Data |
Period Mean (original grids) [W/m2] |
Model Period Mean (intersection) [W/m2] |
Model Period Mean (complement) [W/m2] |
Benchmark Period Mean (intersection) [W/m2] |
Benchmark Period Mean (complement) [W/m2] |
Bias [W/m2] |
RMSE [W/m2] |
Phase Shift [months] |
Bias Score [1] |
RMSE Score [1] |
Seasonal Cycle Score [1] |
Spatial Distribution Score [1] |
Interannual Variability Score [1] |
Overall Score [1] |
|||
|---|---|---|---|---|---|---|---|---|---|---|---|---|---|---|---|---|---|
| Benchmark | [-] | 136. | |||||||||||||||
| CON | [-] | 135. | 135. | 136. | 127. | -1.46 | 14.6 | 0.203 | 0.952 | 0.834 | 0.986 | 0.997 | 0.655 | 0.876 | |||
| OP | [-] | 135. | 135. | 136. | 127. | -1.46 | 14.6 | 0.203 | 0.952 | 0.834 | 0.986 | 0.997 | 0.655 | 0.876 |
Download Data |
Period Mean (original grids) [W/m2] |
Model Period Mean (intersection) [W/m2] |
Model Period Mean (complement) [W/m2] |
Benchmark Period Mean (intersection) [W/m2] |
Benchmark Period Mean (complement) [W/m2] |
Bias [W/m2] |
RMSE [W/m2] |
Phase Shift [months] |
Bias Score [1] |
RMSE Score [1] |
Seasonal Cycle Score [1] |
Spatial Distribution Score [1] |
Interannual Variability Score [1] |
Overall Score [1] |
|||
|---|---|---|---|---|---|---|---|---|---|---|---|---|---|---|---|---|---|
| Benchmark | [-] | 199. | |||||||||||||||
| CON | [-] | 194. | 194. | 199. | 204. | -6.02 | 15.6 | 0.180 | 0.911 | 0.837 | 0.988 | 0.985 | 0.685 | 0.874 | |||
| OP | [-] | 194. | 194. | 199. | 204. | -6.02 | 15.6 | 0.180 | 0.911 | 0.837 | 0.988 | 0.985 | 0.685 | 0.874 |
Download Data |
Period Mean (original grids) [W/m2] |
Model Period Mean (intersection) [W/m2] |
Model Period Mean (complement) [W/m2] |
Benchmark Period Mean (intersection) [W/m2] |
Benchmark Period Mean (complement) [W/m2] |
Bias [W/m2] |
RMSE [W/m2] |
Phase Shift [months] |
Bias Score [1] |
RMSE Score [1] |
Seasonal Cycle Score [1] |
Spatial Distribution Score [1] |
Interannual Variability Score [1] |
Overall Score [1] |
|||
|---|---|---|---|---|---|---|---|---|---|---|---|---|---|---|---|---|---|
| Benchmark | [-] | 206. | |||||||||||||||
| CON | [-] | 201. | 200. | 206. | 232. | -4.00 | 16.8 | 0.759 | 0.693 | 0.467 | 0.905 | 0.999 | 0.801 | 0.722 | |||
| OP | [-] | 201. | 200. | 206. | 232. | -4.00 | 16.8 | 0.759 | 0.693 | 0.467 | 0.905 | 0.999 | 0.801 | 0.722 |
Download Data |
Period Mean (original grids) [W/m2] |
Model Period Mean (intersection) [W/m2] |
Model Period Mean (complement) [W/m2] |
Benchmark Period Mean (intersection) [W/m2] |
Benchmark Period Mean (complement) [W/m2] |
Bias [W/m2] |
RMSE [W/m2] |
Phase Shift [months] |
Bias Score [1] |
RMSE Score [1] |
Seasonal Cycle Score [1] |
Spatial Distribution Score [1] |
Interannual Variability Score [1] |
Overall Score [1] |
|||
|---|---|---|---|---|---|---|---|---|---|---|---|---|---|---|---|---|---|
| Benchmark | [-] | 216. | |||||||||||||||
| CON | [-] | 211. | 212. | 216. | 213. | -4.20 | 18.6 | 0.785 | 0.816 | 0.640 | 0.903 | 0.993 | 0.712 | 0.784 | |||
| OP | [-] | 211. | 212. | 216. | 213. | -4.20 | 18.6 | 0.785 | 0.816 | 0.640 | 0.903 | 0.993 | 0.712 | 0.784 |
Download Data |
Period Mean (original grids) [W/m2] |
Model Period Mean (intersection) [W/m2] |
Model Period Mean (complement) [W/m2] |
Benchmark Period Mean (intersection) [W/m2] |
Benchmark Period Mean (complement) [W/m2] |
Bias [W/m2] |
RMSE [W/m2] |
Phase Shift [months] |
Bias Score [1] |
RMSE Score [1] |
Seasonal Cycle Score [1] |
Spatial Distribution Score [1] |
Interannual Variability Score [1] |
Overall Score [1] |
|||
|---|---|---|---|---|---|---|---|---|---|---|---|---|---|---|---|---|---|
| Benchmark | [-] | 208. | |||||||||||||||
| CON | [-] | 209. | 207. | 210. | 182. | -6.91 | 25.4 | 0.390 | 0.774 | 0.718 | 0.958 | 0.995 | 0.713 | 0.813 | |||
| OP | [-] | 209. | 207. | 210. | 182. | -6.91 | 25.4 | 0.390 | 0.774 | 0.718 | 0.958 | 0.995 | 0.713 | 0.813 |
Temporally integrated period mean