Mean State
Download Data |
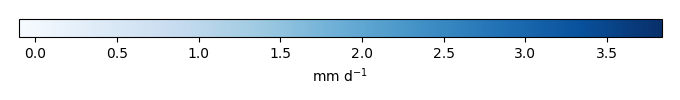
Period Mean (original grids) [mm d-1] |
Model Period Mean (intersection) [mm d-1] |
Model Period Mean (complement) [mm d-1] |
Benchmark Period Mean (intersection) [mm d-1] |
Benchmark Period Mean (complement) [mm d-1] |
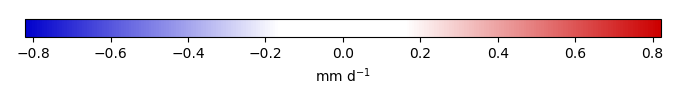
Bias [mm d-1] |
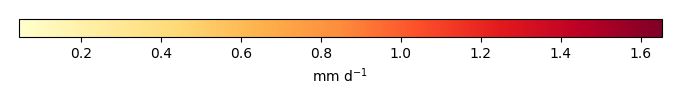
RMSE [mm d-1] |
Phase Shift [months] |
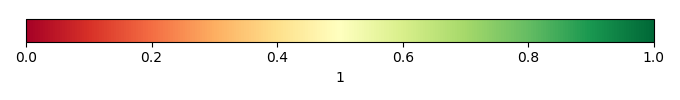
Bias Score [1] |
RMSE Score [1] |
Seasonal Cycle Score [1] |
Spatial Distribution Score [1] |
Interannual Variability Score [1] |
Overall Score [1] |
|||
|---|---|---|---|---|---|---|---|---|---|---|---|---|---|---|---|---|---|
| Benchmark | [-] | 2.04 | |||||||||||||||
| CON | [-] | 2.48 | 2.45 | 2.47 | 2.05 | 1.30 | 0.388 | 0.793 | 2.19 | 0.461 | 0.322 | 0.623 | 0.965 | 0.652 | 0.557 | ||
| OP | [-] | 2.45 | 2.42 | 2.45 | 2.05 | 1.30 | 0.359 | 0.776 | 2.24 | 0.481 | 0.322 | 0.611 | 0.971 | 0.648 | 0.559 |
Download Data |
Period Mean (original grids) [mm d-1] |
Model Period Mean (intersection) [mm d-1] |
Model Period Mean (complement) [mm d-1] |
Benchmark Period Mean (intersection) [mm d-1] |
Benchmark Period Mean (complement) [mm d-1] |
Bias [mm d-1] |
RMSE [mm d-1] |
Phase Shift [months] |
Bias Score [1] |
RMSE Score [1] |
Seasonal Cycle Score [1] |
Spatial Distribution Score [1] |
Interannual Variability Score [1] |
Overall Score [1] |
|||
|---|---|---|---|---|---|---|---|---|---|---|---|---|---|---|---|---|---|
| Benchmark | [-] | 1.45 | |||||||||||||||
| CON | [-] | 1.58 | 1.60 | 1.55 | 1.45 | 1.40 | 0.143 | 0.669 | 1.82 | 0.722 | 0.468 | 0.644 | 0.969 | 0.770 | 0.673 | ||
| OP | [-] | 1.57 | 1.59 | 1.54 | 1.45 | 1.40 | 0.137 | 0.666 | 1.76 | 0.725 | 0.469 | 0.658 | 0.971 | 0.770 | 0.677 |
Download Data |
Period Mean (original grids) [mm d-1] |
Model Period Mean (intersection) [mm d-1] |
Model Period Mean (complement) [mm d-1] |
Benchmark Period Mean (intersection) [mm d-1] |
Benchmark Period Mean (complement) [mm d-1] |
Bias [mm d-1] |
RMSE [mm d-1] |
Phase Shift [months] |
Bias Score [1] |
RMSE Score [1] |
Seasonal Cycle Score [1] |
Spatial Distribution Score [1] |
Interannual Variability Score [1] |
Overall Score [1] |
|||
|---|---|---|---|---|---|---|---|---|---|---|---|---|---|---|---|---|---|
| Benchmark | [-] | 1.61 | |||||||||||||||
| CON | [-] | 1.69 | 1.69 | 1.82 | 1.61 | 1.11 | 0.0815 | 0.723 | 1.30 | 0.651 | 0.469 | 0.823 | 0.927 | 0.704 | 0.674 | ||
| OP | [-] | 1.68 | 1.68 | 1.81 | 1.61 | 1.11 | 0.0743 | 0.723 | 1.32 | 0.653 | 0.468 | 0.819 | 0.931 | 0.703 | 0.674 |
Download Data |
Period Mean (original grids) [mm d-1] |
Model Period Mean (intersection) [mm d-1] |
Model Period Mean (complement) [mm d-1] |
Benchmark Period Mean (intersection) [mm d-1] |
Benchmark Period Mean (complement) [mm d-1] |
Bias [mm d-1] |
RMSE [mm d-1] |
Phase Shift [months] |
Bias Score [1] |
RMSE Score [1] |
Seasonal Cycle Score [1] |
Spatial Distribution Score [1] |
Interannual Variability Score [1] |
Overall Score [1] |
|||
|---|---|---|---|---|---|---|---|---|---|---|---|---|---|---|---|---|---|
| Benchmark | [-] | 0.538 | |||||||||||||||
| CON | [-] | 0.562 | 0.570 | 0.457 | 0.539 | 0.375 | 0.0112 | 0.517 | 0.636 | 0.821 | 0.484 | 0.958 | 0.974 | 0.735 | 0.742 | ||
| OP | [-] | 0.550 | 0.558 | 0.446 | 0.539 | 0.375 | -0.000229 | 0.505 | 0.624 | 0.826 | 0.490 | 0.959 | 0.977 | 0.753 | 0.749 |
Download Data |
Period Mean (original grids) [mm d-1] |
Model Period Mean (intersection) [mm d-1] |
Model Period Mean (complement) [mm d-1] |
Benchmark Period Mean (intersection) [mm d-1] |
Benchmark Period Mean (complement) [mm d-1] |
Bias [mm d-1] |
RMSE [mm d-1] |
Phase Shift [months] |
Bias Score [1] |
RMSE Score [1] |
Seasonal Cycle Score [1] |
Spatial Distribution Score [1] |
Interannual Variability Score [1] |
Overall Score [1] |
|||
|---|---|---|---|---|---|---|---|---|---|---|---|---|---|---|---|---|---|
| Benchmark | [-] | 2.96 | |||||||||||||||
| CON | [-] | 3.39 | 3.37 | 3.50 | 2.99 | 2.17 | 0.446 | 1.02 | 2.54 | 0.366 | 0.297 | 0.579 | 0.425 | 0.652 | 0.436 | ||
| OP | [-] | 3.33 | 3.31 | 3.46 | 2.99 | 2.17 | 0.398 | 1.01 | 2.59 | 0.355 | 0.301 | 0.567 | 0.430 | 0.651 | 0.434 |
Download Data |
Period Mean (original grids) [mm d-1] |
Model Period Mean (intersection) [mm d-1] |
Model Period Mean (complement) [mm d-1] |
Benchmark Period Mean (intersection) [mm d-1] |
Benchmark Period Mean (complement) [mm d-1] |
Bias [mm d-1] |
RMSE [mm d-1] |
Phase Shift [months] |
Bias Score [1] |
RMSE Score [1] |
Seasonal Cycle Score [1] |
Spatial Distribution Score [1] |
Interannual Variability Score [1] |
Overall Score [1] |
|||
|---|---|---|---|---|---|---|---|---|---|---|---|---|---|---|---|---|---|
| Benchmark | [-] | 1.01 | |||||||||||||||
| CON | [-] | 0.887 | 0.893 | 0.875 | 1.01 | 0.659 | -0.115 | 0.486 | 0.568 | 0.840 | 0.626 | 0.962 | 0.991 | 0.763 | 0.801 | ||
| OP | [-] | 0.879 | 0.884 | 0.864 | 1.01 | 0.659 | -0.123 | 0.481 | 0.567 | 0.835 | 0.631 | 0.962 | 0.990 | 0.767 | 0.803 |
Download Data |
Period Mean (original grids) [mm d-1] |
Model Period Mean (intersection) [mm d-1] |
Model Period Mean (complement) [mm d-1] |
Benchmark Period Mean (intersection) [mm d-1] |
Benchmark Period Mean (complement) [mm d-1] |
Bias [mm d-1] |
RMSE [mm d-1] |
Phase Shift [months] |
Bias Score [1] |
RMSE Score [1] |
Seasonal Cycle Score [1] |
Spatial Distribution Score [1] |
Interannual Variability Score [1] |
Overall Score [1] |
|||
|---|---|---|---|---|---|---|---|---|---|---|---|---|---|---|---|---|---|
| Benchmark | [-] | 0.947 | |||||||||||||||
| CON | [-] | 0.932 | 0.922 | 1.74 | 0.946 | 1.10 | 0.00862 | 0.498 | 0.766 | 0.742 | 0.548 | 0.939 | 0.965 | 0.706 | 0.741 | ||
| OP | [-] | 0.922 | 0.912 | 1.73 | 0.946 | 1.10 | -0.00166 | 0.493 | 0.771 | 0.737 | 0.554 | 0.935 | 0.960 | 0.711 | 0.742 |
Download Data |
Period Mean (original grids) [mm d-1] |
Model Period Mean (intersection) [mm d-1] |
Model Period Mean (complement) [mm d-1] |
Benchmark Period Mean (intersection) [mm d-1] |
Benchmark Period Mean (complement) [mm d-1] |
Bias [mm d-1] |
RMSE [mm d-1] |
Phase Shift [months] |
Bias Score [1] |
RMSE Score [1] |
Seasonal Cycle Score [1] |
Spatial Distribution Score [1] |
Interannual Variability Score [1] |
Overall Score [1] |
|||
|---|---|---|---|---|---|---|---|---|---|---|---|---|---|---|---|---|---|
| Benchmark | [-] | 1.65 | |||||||||||||||
| CON | [-] | 2.00 | 1.94 | 2.69 | 1.65 | 1.65 | 0.435 | 0.937 | 2.51 | 0.527 | 0.322 | 0.553 | 0.974 | 0.702 | 0.567 | ||
| OP | [-] | 1.97 | 1.92 | 2.67 | 1.65 | 1.65 | 0.409 | 0.917 | 2.51 | 0.533 | 0.326 | 0.549 | 0.974 | 0.700 | 0.568 |
Download Data |
Period Mean (original grids) [mm d-1] |
Model Period Mean (intersection) [mm d-1] |
Model Period Mean (complement) [mm d-1] |
Benchmark Period Mean (intersection) [mm d-1] |
Benchmark Period Mean (complement) [mm d-1] |
Bias [mm d-1] |
RMSE [mm d-1] |
Phase Shift [months] |
Bias Score [1] |
RMSE Score [1] |
Seasonal Cycle Score [1] |
Spatial Distribution Score [1] |
Interannual Variability Score [1] |
Overall Score [1] |
|||
|---|---|---|---|---|---|---|---|---|---|---|---|---|---|---|---|---|---|
| Benchmark | [-] | 0.542 | |||||||||||||||
| CON | [-] | 0.600 | 0.613 | 0.409 | 0.543 | 0.252 | 0.0510 | 0.555 | 0.314 | 0.844 | 0.459 | 0.979 | 0.982 | 0.651 | 0.729 | ||
| OP | [-] | 0.586 | 0.599 | 0.401 | 0.543 | 0.252 | 0.0373 | 0.539 | 0.321 | 0.851 | 0.468 | 0.978 | 0.985 | 0.670 | 0.737 |
Download Data |
Period Mean (original grids) [mm d-1] |
Model Period Mean (intersection) [mm d-1] |
Model Period Mean (complement) [mm d-1] |
Benchmark Period Mean (intersection) [mm d-1] |
Benchmark Period Mean (complement) [mm d-1] |
Bias [mm d-1] |
RMSE [mm d-1] |
Phase Shift [months] |
Bias Score [1] |
RMSE Score [1] |
Seasonal Cycle Score [1] |
Spatial Distribution Score [1] |
Interannual Variability Score [1] |
Overall Score [1] |
|||
|---|---|---|---|---|---|---|---|---|---|---|---|---|---|---|---|---|---|
| Benchmark | [-] | 1.20 | |||||||||||||||
| CON | [-] | 1.15 | 1.12 | 1.94 | 1.19 | 1.50 | 0.00358 | 0.510 | 0.632 | 0.737 | 0.539 | 0.930 | 0.974 | 0.775 | 0.749 | ||
| OP | [-] | 1.15 | 1.11 | 1.94 | 1.19 | 1.50 | -0.000350 | 0.508 | 0.618 | 0.737 | 0.541 | 0.932 | 0.975 | 0.779 | 0.751 |
Download Data |
Period Mean (original grids) [mm d-1] |
Model Period Mean (intersection) [mm d-1] |
Model Period Mean (complement) [mm d-1] |
Benchmark Period Mean (intersection) [mm d-1] |
Benchmark Period Mean (complement) [mm d-1] |
Bias [mm d-1] |
RMSE [mm d-1] |
Phase Shift [months] |
Bias Score [1] |
RMSE Score [1] |
Seasonal Cycle Score [1] |
Spatial Distribution Score [1] |
Interannual Variability Score [1] |
Overall Score [1] |
|||
|---|---|---|---|---|---|---|---|---|---|---|---|---|---|---|---|---|---|
| Benchmark | [-] | 1.10 | |||||||||||||||
| CON | [-] | 1.16 | 1.17 | 1.14 | 1.10 | 0.587 | 0.0661 | 0.510 | 0.446 | 0.812 | 0.612 | 0.973 | 0.970 | 0.753 | 0.788 | ||
| OP | [-] | 1.14 | 1.15 | 1.13 | 1.10 | 0.587 | 0.0523 | 0.497 | 0.491 | 0.812 | 0.621 | 0.969 | 0.969 | 0.759 | 0.792 |
Download Data |
Period Mean (original grids) [mm d-1] |
Model Period Mean (intersection) [mm d-1] |
Model Period Mean (complement) [mm d-1] |
Benchmark Period Mean (intersection) [mm d-1] |
Benchmark Period Mean (complement) [mm d-1] |
Bias [mm d-1] |
RMSE [mm d-1] |
Phase Shift [months] |
Bias Score [1] |
RMSE Score [1] |
Seasonal Cycle Score [1] |
Spatial Distribution Score [1] |
Interannual Variability Score [1] |
Overall Score [1] |
|||
|---|---|---|---|---|---|---|---|---|---|---|---|---|---|---|---|---|---|
| Benchmark | [-] | 1.17 | |||||||||||||||
| CON | [-] | 1.19 | 1.17 | 1.61 | 1.17 | 1.40 | 0.0467 | 0.546 | 1.17 | 0.637 | 0.459 | 0.783 | 0.972 | 0.709 | 0.670 | ||
| OP | [-] | 1.18 | 1.16 | 1.59 | 1.17 | 1.40 | 0.0347 | 0.542 | 1.17 | 0.634 | 0.461 | 0.778 | 0.973 | 0.711 | 0.670 |
Download Data |
Period Mean (original grids) [mm d-1] |
Model Period Mean (intersection) [mm d-1] |
Model Period Mean (complement) [mm d-1] |
Benchmark Period Mean (intersection) [mm d-1] |
Benchmark Period Mean (complement) [mm d-1] |
Bias [mm d-1] |
RMSE [mm d-1] |
Phase Shift [months] |
Bias Score [1] |
RMSE Score [1] |
Seasonal Cycle Score [1] |
Spatial Distribution Score [1] |
Interannual Variability Score [1] |
Overall Score [1] |
|||
|---|---|---|---|---|---|---|---|---|---|---|---|---|---|---|---|---|---|
| Benchmark | [-] | 0.278 | |||||||||||||||
| CON | [-] | 0.324 | 0.304 | 0.599 | 0.278 | 0.769 | 0.0409 | 0.306 | 1.18 | 0.589 | 0.379 | 0.860 | 0.916 | 0.699 | 0.637 | ||
| OP | [-] | 0.323 | 0.302 | 0.594 | 0.278 | 0.769 | 0.0393 | 0.303 | 1.19 | 0.591 | 0.383 | 0.860 | 0.916 | 0.703 | 0.639 |
Download Data |
Period Mean (original grids) [mm d-1] |
Model Period Mean (intersection) [mm d-1] |
Model Period Mean (complement) [mm d-1] |
Benchmark Period Mean (intersection) [mm d-1] |
Benchmark Period Mean (complement) [mm d-1] |
Bias [mm d-1] |
RMSE [mm d-1] |
Phase Shift [months] |
Bias Score [1] |
RMSE Score [1] |
Seasonal Cycle Score [1] |
Spatial Distribution Score [1] |
Interannual Variability Score [1] |
Overall Score [1] |
|||
|---|---|---|---|---|---|---|---|---|---|---|---|---|---|---|---|---|---|
| Benchmark | [-] | 0.532 | |||||||||||||||
| CON | [-] | 0.566 | 0.575 | 0.370 | 0.532 | 0.358 | 0.0128 | 0.507 | 0.346 | 0.796 | 0.486 | 0.975 | 0.954 | 0.717 | 0.736 | ||
| OP | [-] | 0.559 | 0.569 | 0.367 | 0.532 | 0.358 | 0.00662 | 0.502 | 0.351 | 0.798 | 0.490 | 0.975 | 0.958 | 0.720 | 0.738 |
Download Data |
Period Mean (original grids) [mm d-1] |
Model Period Mean (intersection) [mm d-1] |
Model Period Mean (complement) [mm d-1] |
Benchmark Period Mean (intersection) [mm d-1] |
Benchmark Period Mean (complement) [mm d-1] |
Bias [mm d-1] |
RMSE [mm d-1] |
Phase Shift [months] |
Bias Score [1] |
RMSE Score [1] |
Seasonal Cycle Score [1] |
Spatial Distribution Score [1] |
Interannual Variability Score [1] |
Overall Score [1] |
|||
|---|---|---|---|---|---|---|---|---|---|---|---|---|---|---|---|---|---|
| Benchmark | [-] | 1.78 | |||||||||||||||
| CON | [-] | 2.00 | 1.94 | 2.47 | 1.78 | 2.11 | 0.330 | 0.983 | 1.44 | 0.565 | 0.399 | 0.770 | 0.887 | 0.625 | 0.607 | ||
| OP | [-] | 1.99 | 1.92 | 2.46 | 1.78 | 2.11 | 0.317 | 0.980 | 1.45 | 0.567 | 0.398 | 0.765 | 0.891 | 0.620 | 0.607 |
Download Data |
Period Mean (original grids) [mm d-1] |
Model Period Mean (intersection) [mm d-1] |
Model Period Mean (complement) [mm d-1] |
Benchmark Period Mean (intersection) [mm d-1] |
Benchmark Period Mean (complement) [mm d-1] |
Bias [mm d-1] |
RMSE [mm d-1] |
Phase Shift [months] |
Bias Score [1] |
RMSE Score [1] |
Seasonal Cycle Score [1] |
Spatial Distribution Score [1] |
Interannual Variability Score [1] |
Overall Score [1] |
|||
|---|---|---|---|---|---|---|---|---|---|---|---|---|---|---|---|---|---|
| Benchmark | [-] | 1.99 | |||||||||||||||
| CON | [-] | 1.76 | 1.74 | 1.96 | 1.99 | 1.94 | -0.206 | 0.689 | 0.560 | 0.721 | 0.621 | 0.955 | 0.892 | 0.750 | 0.760 | ||
| OP | [-] | 1.73 | 1.71 | 1.95 | 1.99 | 1.94 | -0.230 | 0.676 | 0.551 | 0.711 | 0.632 | 0.955 | 0.895 | 0.750 | 0.763 |
Download Data |
Period Mean (original grids) [mm d-1] |
Model Period Mean (intersection) [mm d-1] |
Model Period Mean (complement) [mm d-1] |
Benchmark Period Mean (intersection) [mm d-1] |
Benchmark Period Mean (complement) [mm d-1] |
Bias [mm d-1] |
RMSE [mm d-1] |
Phase Shift [months] |
Bias Score [1] |
RMSE Score [1] |
Seasonal Cycle Score [1] |
Spatial Distribution Score [1] |
Interannual Variability Score [1] |
Overall Score [1] |
|||
|---|---|---|---|---|---|---|---|---|---|---|---|---|---|---|---|---|---|
| Benchmark | [-] | 1.19 | |||||||||||||||
| CON | [-] | 1.07 | 1.06 | 1.12 | 1.19 | 1.12 | -0.129 | 0.637 | 0.529 | 0.729 | 0.579 | 0.963 | 0.678 | 0.670 | 0.700 | ||
| OP | [-] | 1.06 | 1.05 | 1.11 | 1.19 | 1.12 | -0.139 | 0.632 | 0.515 | 0.727 | 0.583 | 0.964 | 0.676 | 0.670 | 0.700 |
Download Data |
Period Mean (original grids) [mm d-1] |
Model Period Mean (intersection) [mm d-1] |
Model Period Mean (complement) [mm d-1] |
Benchmark Period Mean (intersection) [mm d-1] |
Benchmark Period Mean (complement) [mm d-1] |
Bias [mm d-1] |
RMSE [mm d-1] |
Phase Shift [months] |
Bias Score [1] |
RMSE Score [1] |
Seasonal Cycle Score [1] |
Spatial Distribution Score [1] |
Interannual Variability Score [1] |
Overall Score [1] |
|||
|---|---|---|---|---|---|---|---|---|---|---|---|---|---|---|---|---|---|
| Benchmark | [-] | 1.10 | |||||||||||||||
| CON | [-] | 0.921 | 0.916 | 1.14 | 1.10 | 1.04 | -0.179 | 0.579 | 0.681 | 0.689 | 0.516 | 0.947 | 0.869 | 0.737 | 0.712 | ||
| OP | [-] | 0.916 | 0.911 | 1.13 | 1.10 | 1.04 | -0.184 | 0.573 | 0.677 | 0.688 | 0.520 | 0.947 | 0.863 | 0.741 | 0.713 |
Download Data |
Period Mean (original grids) [mm d-1] |
Model Period Mean (intersection) [mm d-1] |
Model Period Mean (complement) [mm d-1] |
Benchmark Period Mean (intersection) [mm d-1] |
Benchmark Period Mean (complement) [mm d-1] |
Bias [mm d-1] |
RMSE [mm d-1] |
Phase Shift [months] |
Bias Score [1] |
RMSE Score [1] |
Seasonal Cycle Score [1] |
Spatial Distribution Score [1] |
Interannual Variability Score [1] |
Overall Score [1] |
|||
|---|---|---|---|---|---|---|---|---|---|---|---|---|---|---|---|---|---|
| Benchmark | [-] | 3.22 | |||||||||||||||
| CON | [-] | 3.23 | 3.22 | 3.02 | 3.22 | 1.88 | -0.0123 | 0.723 | 2.68 | 0.489 | 0.353 | 0.534 | 0.773 | 0.699 | 0.534 | ||
| OP | [-] | 3.18 | 3.17 | 3.00 | 3.22 | 1.88 | -0.0609 | 0.743 | 2.77 | 0.464 | 0.347 | 0.515 | 0.756 | 0.698 | 0.521 |
Download Data |
Period Mean (original grids) [mm d-1] |
Model Period Mean (intersection) [mm d-1] |
Model Period Mean (complement) [mm d-1] |
Benchmark Period Mean (intersection) [mm d-1] |
Benchmark Period Mean (complement) [mm d-1] |
Bias [mm d-1] |
RMSE [mm d-1] |
Phase Shift [months] |
Bias Score [1] |
RMSE Score [1] |
Seasonal Cycle Score [1] |
Spatial Distribution Score [1] |
Interannual Variability Score [1] |
Overall Score [1] |
|||
|---|---|---|---|---|---|---|---|---|---|---|---|---|---|---|---|---|---|
| Benchmark | [-] | 2.25 | |||||||||||||||
| CON | [-] | 2.29 | 2.27 | 2.38 | 2.25 | 1.44 | 0.0270 | 0.636 | 1.07 | 0.753 | 0.525 | 0.881 | 0.952 | 0.757 | 0.732 | ||
| OP | [-] | 2.27 | 2.26 | 2.37 | 2.25 | 1.44 | 0.0106 | 0.628 | 1.09 | 0.757 | 0.529 | 0.879 | 0.959 | 0.765 | 0.736 |
Download Data |
Period Mean (original grids) [mm d-1] |
Model Period Mean (intersection) [mm d-1] |
Model Period Mean (complement) [mm d-1] |
Benchmark Period Mean (intersection) [mm d-1] |
Benchmark Period Mean (complement) [mm d-1] |
Bias [mm d-1] |
RMSE [mm d-1] |
Phase Shift [months] |
Bias Score [1] |
RMSE Score [1] |
Seasonal Cycle Score [1] |
Spatial Distribution Score [1] |
Interannual Variability Score [1] |
Overall Score [1] |
|||
|---|---|---|---|---|---|---|---|---|---|---|---|---|---|---|---|---|---|
| Benchmark | [-] | 0.901 | |||||||||||||||
| CON | [-] | 1.00 | 1.00 | 0.730 | 0.898 | 1.11 | 0.0720 | 0.646 | 1.05 | 0.580 | 0.456 | 0.874 | 0.908 | 0.662 | 0.656 | ||
| OP | [-] | 0.995 | 0.997 | 0.727 | 0.898 | 1.11 | 0.0672 | 0.643 | 1.06 | 0.581 | 0.457 | 0.875 | 0.912 | 0.665 | 0.658 |
Temporally integrated period mean