Mean State
Download Data |
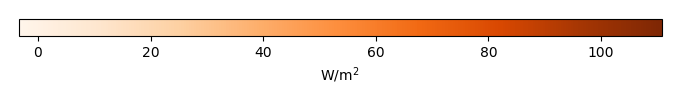
Period Mean (original grids) [W/m2] |
Model Period Mean (intersection) [W/m2] |
Model Period Mean (complement) [W/m2] |
Benchmark Period Mean (intersection) [W/m2] |
Benchmark Period Mean (complement) [W/m2] |
Bias [W/m2] |
RMSE [W/m2] |
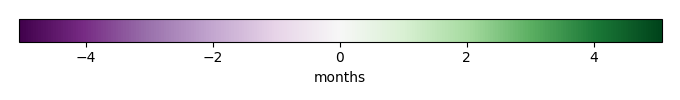
Phase Shift [months] |
Bias Score [1] |
RMSE Score [1] |
Seasonal Cycle Score [1] |
Spatial Distribution Score [1] |
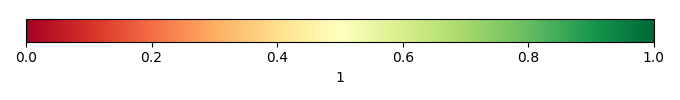
Overall Score [1] |
|||
|---|---|---|---|---|---|---|---|---|---|---|---|---|---|---|---|---|
| Benchmark | [-] | 70.8 | ||||||||||||||
| CON | [-] | 71.9 | 71.2 | 68.2 | 70.9 | 2.38 | -0.157 | 16.6 | 1.50 | 0.354 | 0.174 | 0.798 | 0.987 | 0.498 | ||
| OP | [-] | 71.1 | 70.4 | 67.6 | 70.9 | 2.38 | -0.990 | 16.5 | 1.49 | 0.376 | 0.175 | 0.800 | 0.984 | 0.502 |
Download Data |
Period Mean (original grids) [W/m2] |
Model Period Mean (intersection) [W/m2] |
Model Period Mean (complement) [W/m2] |
Benchmark Period Mean (intersection) [W/m2] |
Benchmark Period Mean (complement) [W/m2] |
Bias [W/m2] |
RMSE [W/m2] |
Phase Shift [months] |
Bias Score [1] |
RMSE Score [1] |
Seasonal Cycle Score [1] |
Spatial Distribution Score [1] |
Overall Score [1] |
|||
|---|---|---|---|---|---|---|---|---|---|---|---|---|---|---|---|---|
| Benchmark | [-] | 48.1 | ||||||||||||||
| CON | [-] | 45.8 | 46.3 | 45.9 | 48.1 | -2.07 | 23.3 | 1.48 | 0.672 | 0.463 | 0.706 | 0.916 | 0.644 | |||
| OP | [-] | 45.7 | 46.1 | 45.8 | 48.1 | -2.24 | 23.3 | 1.46 | 0.670 | 0.463 | 0.712 | 0.912 | 0.644 |
Download Data |
Period Mean (original grids) [W/m2] |
Model Period Mean (intersection) [W/m2] |
Model Period Mean (complement) [W/m2] |
Benchmark Period Mean (intersection) [W/m2] |
Benchmark Period Mean (complement) [W/m2] |
Bias [W/m2] |
RMSE [W/m2] |
Phase Shift [months] |
Bias Score [1] |
RMSE Score [1] |
Seasonal Cycle Score [1] |
Spatial Distribution Score [1] |
Overall Score [1] |
|||
|---|---|---|---|---|---|---|---|---|---|---|---|---|---|---|---|---|
| Benchmark | [-] | 52.1 | ||||||||||||||
| CON | [-] | 48.5 | 48.8 | 49.5 | 52.2 | 9.80 | -3.34 | 21.4 | 1.21 | 0.581 | 0.465 | 0.824 | 0.973 | 0.662 | ||
| OP | [-] | 48.4 | 48.6 | 49.3 | 52.2 | 9.80 | -3.54 | 21.4 | 1.25 | 0.582 | 0.465 | 0.813 | 0.972 | 0.659 |
Download Data |
Period Mean (original grids) [W/m2] |
Model Period Mean (intersection) [W/m2] |
Model Period Mean (complement) [W/m2] |
Benchmark Period Mean (intersection) [W/m2] |
Benchmark Period Mean (complement) [W/m2] |
Bias [W/m2] |
RMSE [W/m2] |
Phase Shift [months] |
Bias Score [1] |
RMSE Score [1] |
Seasonal Cycle Score [1] |
Spatial Distribution Score [1] |
Overall Score [1] |
|||
|---|---|---|---|---|---|---|---|---|---|---|---|---|---|---|---|---|
| Benchmark | [-] | 15.0 | ||||||||||||||
| CON | [-] | 16.2 | 16.5 | 13.6 | 15.0 | 3.54 | 0.989 | 12.7 | 0.203 | 0.846 | 0.603 | 1.00 | 0.771 | 0.765 | ||
| OP | [-] | 15.9 | 16.1 | 13.3 | 15.0 | 3.54 | 0.655 | 12.3 | 0.185 | 0.851 | 0.613 | 1.01 | 0.746 | 0.766 |
Download Data |
Period Mean (original grids) [W/m2] |
Model Period Mean (intersection) [W/m2] |
Model Period Mean (complement) [W/m2] |
Benchmark Period Mean (intersection) [W/m2] |
Benchmark Period Mean (complement) [W/m2] |
Bias [W/m2] |
RMSE [W/m2] |
Phase Shift [months] |
Bias Score [1] |
RMSE Score [1] |
Seasonal Cycle Score [1] |
Spatial Distribution Score [1] |
Overall Score [1] |
|||
|---|---|---|---|---|---|---|---|---|---|---|---|---|---|---|---|---|
| Benchmark | [-] | 77.7 | ||||||||||||||
| CON | [-] | 97.5 | 96.8 | 100. | 78.4 | 39.4 | 20.1 | 28.7 | 2.17 | 0.252 | 0.163 | 0.656 | 0.326 | 0.312 | ||
| OP | [-] | 96.0 | 95.2 | 98.9 | 78.4 | 39.4 | 18.7 | 28.3 | 2.19 | 0.253 | 0.170 | 0.651 | 0.329 | 0.314 |
Download Data |
Period Mean (original grids) [W/m2] |
Model Period Mean (intersection) [W/m2] |
Model Period Mean (complement) [W/m2] |
Benchmark Period Mean (intersection) [W/m2] |
Benchmark Period Mean (complement) [W/m2] |
Bias [W/m2] |
RMSE [W/m2] |
Phase Shift [months] |
Bias Score [1] |
RMSE Score [1] |
Seasonal Cycle Score [1] |
Spatial Distribution Score [1] |
Overall Score [1] |
|||
|---|---|---|---|---|---|---|---|---|---|---|---|---|---|---|---|---|
| Benchmark | [-] | 26.4 | ||||||||||||||
| CON | [-] | 25.6 | 25.7 | 26.3 | 26.5 | 0.519 | -0.744 | 10.7 | 0.329 | 0.890 | 0.711 | 0.978 | 0.990 | 0.856 | ||
| OP | [-] | 25.3 | 25.5 | 26.0 | 26.5 | 0.519 | -0.990 | 10.5 | 0.316 | 0.889 | 0.717 | 0.979 | 0.990 | 0.858 |
Download Data |
Period Mean (original grids) [W/m2] |
Model Period Mean (intersection) [W/m2] |
Model Period Mean (complement) [W/m2] |
Benchmark Period Mean (intersection) [W/m2] |
Benchmark Period Mean (complement) [W/m2] |
Bias [W/m2] |
RMSE [W/m2] |
Phase Shift [months] |
Bias Score [1] |
RMSE Score [1] |
Seasonal Cycle Score [1] |
Spatial Distribution Score [1] |
Overall Score [1] |
|||
|---|---|---|---|---|---|---|---|---|---|---|---|---|---|---|---|---|
| Benchmark | [-] | 28.1 | ||||||||||||||
| CON | [-] | 27.0 | 27.0 | 29.8 | 28.2 | 10.2 | -0.403 | 14.5 | 0.688 | 0.718 | 0.607 | 0.958 | 0.925 | 0.763 | ||
| OP | [-] | 26.7 | 26.7 | 29.6 | 28.2 | 10.2 | -0.705 | 14.4 | 0.695 | 0.712 | 0.610 | 0.955 | 0.916 | 0.761 |
Download Data |
Period Mean (original grids) [W/m2] |
Model Period Mean (intersection) [W/m2] |
Model Period Mean (complement) [W/m2] |
Benchmark Period Mean (intersection) [W/m2] |
Benchmark Period Mean (complement) [W/m2] |
Bias [W/m2] |
RMSE [W/m2] |
Phase Shift [months] |
Bias Score [1] |
RMSE Score [1] |
Seasonal Cycle Score [1] |
Spatial Distribution Score [1] |
Overall Score [1] |
|||
|---|---|---|---|---|---|---|---|---|---|---|---|---|---|---|---|---|
| Benchmark | [-] | 57.3 | ||||||||||||||
| CON | [-] | 57.8 | 56.0 | 71.9 | 57.3 | 37.9 | 2.20 | 27.1 | 1.87 | 0.559 | 0.358 | 0.717 | 0.962 | 0.591 | ||
| OP | [-] | 57.0 | 55.2 | 71.3 | 57.3 | 37.9 | 1.45 | 26.9 | 1.86 | 0.550 | 0.360 | 0.713 | 0.960 | 0.588 |
Download Data |
Period Mean (original grids) [W/m2] |
Model Period Mean (intersection) [W/m2] |
Model Period Mean (complement) [W/m2] |
Benchmark Period Mean (intersection) [W/m2] |
Benchmark Period Mean (complement) [W/m2] |
Bias [W/m2] |
RMSE [W/m2] |
Phase Shift [months] |
Bias Score [1] |
RMSE Score [1] |
Seasonal Cycle Score [1] |
Spatial Distribution Score [1] |
Overall Score [1] |
|||
|---|---|---|---|---|---|---|---|---|---|---|---|---|---|---|---|---|
| Benchmark | [-] | 15.7 | ||||||||||||||
| CON | [-] | 17.3 | 17.7 | 10.5 | 15.7 | -6.31 | 1.53 | 14.0 | 0.0780 | 0.906 | 0.565 | 1.01 | 0.762 | 0.761 | ||
| OP | [-] | 16.8 | 17.3 | 10.3 | 15.7 | -6.31 | 1.13 | 13.5 | 0.0894 | 0.911 | 0.575 | 1.01 | 0.745 | 0.763 |
Download Data |
Period Mean (original grids) [W/m2] |
Model Period Mean (intersection) [W/m2] |
Model Period Mean (complement) [W/m2] |
Benchmark Period Mean (intersection) [W/m2] |
Benchmark Period Mean (complement) [W/m2] |
Bias [W/m2] |
RMSE [W/m2] |
Phase Shift [months] |
Bias Score [1] |
RMSE Score [1] |
Seasonal Cycle Score [1] |
Spatial Distribution Score [1] |
Overall Score [1] |
|||
|---|---|---|---|---|---|---|---|---|---|---|---|---|---|---|---|---|
| Benchmark | [-] | 27.0 | ||||||||||||||
| CON | [-] | 32.8 | 31.6 | 49.8 | 27.0 | 15.0 | 6.59 | 17.0 | 0.706 | 0.647 | 0.416 | 0.932 | 0.937 | 0.670 | ||
| OP | [-] | 32.7 | 31.5 | 49.6 | 27.0 | 15.0 | 6.49 | 16.9 | 0.758 | 0.649 | 0.420 | 0.927 | 0.939 | 0.671 |
Download Data |
Period Mean (original grids) [W/m2] |
Model Period Mean (intersection) [W/m2] |
Model Period Mean (complement) [W/m2] |
Benchmark Period Mean (intersection) [W/m2] |
Benchmark Period Mean (complement) [W/m2] |
Bias [W/m2] |
RMSE [W/m2] |
Phase Shift [months] |
Bias Score [1] |
RMSE Score [1] |
Seasonal Cycle Score [1] |
Spatial Distribution Score [1] |
Overall Score [1] |
|||
|---|---|---|---|---|---|---|---|---|---|---|---|---|---|---|---|---|
| Benchmark | [-] | 31.4 | ||||||||||||||
| CON | [-] | 33.5 | 33.8 | 33.2 | 31.5 | 6.71 | 2.20 | 15.6 | 0.351 | 0.787 | 0.607 | 0.981 | 0.637 | 0.724 | ||
| OP | [-] | 33.0 | 33.3 | 32.9 | 31.5 | 6.71 | 1.81 | 15.2 | 0.381 | 0.783 | 0.620 | 0.978 | 0.634 | 0.727 |
Download Data |
Period Mean (original grids) [W/m2] |
Model Period Mean (intersection) [W/m2] |
Model Period Mean (complement) [W/m2] |
Benchmark Period Mean (intersection) [W/m2] |
Benchmark Period Mean (complement) [W/m2] |
Bias [W/m2] |
RMSE [W/m2] |
Phase Shift [months] |
Bias Score [1] |
RMSE Score [1] |
Seasonal Cycle Score [1] |
Spatial Distribution Score [1] |
Overall Score [1] |
|||
|---|---|---|---|---|---|---|---|---|---|---|---|---|---|---|---|---|
| Benchmark | [-] | 39.3 | ||||||||||||||
| CON | [-] | 34.4 | 40.6 | 12.0 | 39.4 | 17.5 | 2.03 | 16.9 | 0.915 | 0.606 | 0.429 | 0.848 | 0.970 | 0.657 | ||
| OP | [-] | 34.0 | 40.2 | 11.9 | 39.4 | 17.5 | 1.62 | 16.7 | 0.922 | 0.604 | 0.433 | 0.847 | 0.969 | 0.657 |
Download Data |
Period Mean (original grids) [W/m2] |
Model Period Mean (intersection) [W/m2] |
Model Period Mean (complement) [W/m2] |
Benchmark Period Mean (intersection) [W/m2] |
Benchmark Period Mean (complement) [W/m2] |
Bias [W/m2] |
RMSE [W/m2] |
Phase Shift [months] |
Bias Score [1] |
RMSE Score [1] |
Seasonal Cycle Score [1] |
Spatial Distribution Score [1] |
Overall Score [1] |
|||
|---|---|---|---|---|---|---|---|---|---|---|---|---|---|---|---|---|
| Benchmark | [-] | 8.49 | ||||||||||||||
| CON | [-] | 9.31 | 14.4 | 3.96 | 8.49 | 0.909 | 6.32 | 13.5 | 1.20 | 0.544 | 0.262 | 0.921 | 0.925 | 0.583 | ||
| OP | [-] | 9.26 | 14.3 | 3.95 | 8.49 | 0.909 | 6.24 | 13.3 | 1.21 | 0.547 | 0.268 | 0.921 | 0.925 | 0.586 |
Download Data |
Period Mean (original grids) [W/m2] |
Model Period Mean (intersection) [W/m2] |
Model Period Mean (complement) [W/m2] |
Benchmark Period Mean (intersection) [W/m2] |
Benchmark Period Mean (complement) [W/m2] |
Bias [W/m2] |
RMSE [W/m2] |
Phase Shift [months] |
Bias Score [1] |
RMSE Score [1] |
Seasonal Cycle Score [1] |
Spatial Distribution Score [1] |
Overall Score [1] |
|||
|---|---|---|---|---|---|---|---|---|---|---|---|---|---|---|---|---|
| Benchmark | [-] | 14.0 | ||||||||||||||
| CON | [-] | 16.4 | 17.1 | 9.04 | 14.1 | -3.72 | 2.26 | 13.3 | 0.296 | 0.831 | 0.539 | 0.990 | 0.872 | 0.754 | ||
| OP | [-] | 16.2 | 16.9 | 8.97 | 14.1 | -3.72 | 2.07 | 13.1 | 0.311 | 0.835 | 0.547 | 0.989 | 0.863 | 0.756 |
Download Data |
Period Mean (original grids) [W/m2] |
Model Period Mean (intersection) [W/m2] |
Model Period Mean (complement) [W/m2] |
Benchmark Period Mean (intersection) [W/m2] |
Benchmark Period Mean (complement) [W/m2] |
Bias [W/m2] |
RMSE [W/m2] |
Phase Shift [months] |
Bias Score [1] |
RMSE Score [1] |
Seasonal Cycle Score [1] |
Spatial Distribution Score [1] |
Overall Score [1] |
|||
|---|---|---|---|---|---|---|---|---|---|---|---|---|---|---|---|---|
| Benchmark | [-] | 50.4 | ||||||||||||||
| CON | [-] | 57.8 | 55.6 | 68.1 | 50.4 | 47.2 | 9.79 | 22.5 | 0.988 | 0.468 | 0.374 | 0.880 | 0.952 | 0.610 | ||
| OP | [-] | 57.5 | 55.3 | 67.7 | 50.4 | 47.2 | 9.42 | 22.3 | 1.04 | 0.472 | 0.378 | 0.873 | 0.954 | 0.611 |
Download Data |
Period Mean (original grids) [W/m2] |
Model Period Mean (intersection) [W/m2] |
Model Period Mean (complement) [W/m2] |
Benchmark Period Mean (intersection) [W/m2] |
Benchmark Period Mean (complement) [W/m2] |
Bias [W/m2] |
RMSE [W/m2] |
Phase Shift [months] |
Bias Score [1] |
RMSE Score [1] |
Seasonal Cycle Score [1] |
Spatial Distribution Score [1] |
Overall Score [1] |
|||
|---|---|---|---|---|---|---|---|---|---|---|---|---|---|---|---|---|
| Benchmark | [-] | 49.8 | ||||||||||||||
| CON | [-] | 50.8 | 50.1 | 58.9 | 49.8 | 23.1 | 1.24 | 15.6 | 0.460 | 0.824 | 0.703 | 0.964 | 0.827 | 0.804 | ||
| OP | [-] | 50.1 | 49.3 | 58.4 | 49.8 | 23.1 | 0.537 | 15.1 | 0.444 | 0.820 | 0.716 | 0.965 | 0.829 | 0.810 |
Download Data |
Period Mean (original grids) [W/m2] |
Model Period Mean (intersection) [W/m2] |
Model Period Mean (complement) [W/m2] |
Benchmark Period Mean (intersection) [W/m2] |
Benchmark Period Mean (complement) [W/m2] |
Bias [W/m2] |
RMSE [W/m2] |
Phase Shift [months] |
Bias Score [1] |
RMSE Score [1] |
Seasonal Cycle Score [1] |
Spatial Distribution Score [1] |
Overall Score [1] |
|||
|---|---|---|---|---|---|---|---|---|---|---|---|---|---|---|---|---|
| Benchmark | [-] | 25.3 | ||||||||||||||
| CON | [-] | 30.9 | 30.8 | 32.6 | 25.3 | 11.3 | 5.45 | 14.0 | 0.242 | 0.800 | 0.623 | 0.985 | 0.932 | 0.793 | ||
| OP | [-] | 30.7 | 30.5 | 32.4 | 25.3 | 11.3 | 5.17 | 13.7 | 0.237 | 0.805 | 0.630 | 0.986 | 0.931 | 0.796 |
Download Data |
Period Mean (original grids) [W/m2] |
Model Period Mean (intersection) [W/m2] |
Model Period Mean (complement) [W/m2] |
Benchmark Period Mean (intersection) [W/m2] |
Benchmark Period Mean (complement) [W/m2] |
Bias [W/m2] |
RMSE [W/m2] |
Phase Shift [months] |
Bias Score [1] |
RMSE Score [1] |
Seasonal Cycle Score [1] |
Spatial Distribution Score [1] |
Overall Score [1] |
|||
|---|---|---|---|---|---|---|---|---|---|---|---|---|---|---|---|---|
| Benchmark | [-] | 27.2 | ||||||||||||||
| CON | [-] | 26.7 | 26.5 | 33.5 | 27.2 | 10.8 | -0.496 | 13.8 | 0.690 | 0.710 | 0.532 | 0.942 | 0.977 | 0.738 | ||
| OP | [-] | 26.5 | 26.4 | 33.1 | 27.2 | 10.8 | -0.635 | 13.6 | 0.660 | 0.711 | 0.537 | 0.944 | 0.976 | 0.741 |
Download Data |
Period Mean (original grids) [W/m2] |
Model Period Mean (intersection) [W/m2] |
Model Period Mean (complement) [W/m2] |
Benchmark Period Mean (intersection) [W/m2] |
Benchmark Period Mean (complement) [W/m2] |
Bias [W/m2] |
RMSE [W/m2] |
Phase Shift [months] |
Bias Score [1] |
RMSE Score [1] |
Seasonal Cycle Score [1] |
Spatial Distribution Score [1] |
Overall Score [1] |
|||
|---|---|---|---|---|---|---|---|---|---|---|---|---|---|---|---|---|
| Benchmark | [-] | 90.1 | ||||||||||||||
| CON | [-] | 93.5 | 93.4 | 87.7 | 90.2 | 44.1 | 2.80 | 14.3 | 1.79 | 0.464 | 0.219 | 0.746 | 0.941 | 0.518 | ||
| OP | [-] | 92.1 | 92.0 | 87.0 | 90.2 | 44.1 | 1.40 | 14.2 | 1.76 | 0.446 | 0.221 | 0.754 | 0.931 | 0.514 |
Download Data |
Period Mean (original grids) [W/m2] |
Model Period Mean (intersection) [W/m2] |
Model Period Mean (complement) [W/m2] |
Benchmark Period Mean (intersection) [W/m2] |
Benchmark Period Mean (complement) [W/m2] |
Bias [W/m2] |
RMSE [W/m2] |
Phase Shift [months] |
Bias Score [1] |
RMSE Score [1] |
Seasonal Cycle Score [1] |
Spatial Distribution Score [1] |
Overall Score [1] |
|||
|---|---|---|---|---|---|---|---|---|---|---|---|---|---|---|---|---|
| Benchmark | [-] | 69.6 | ||||||||||||||
| CON | [-] | 66.3 | 65.9 | 66.3 | 69.7 | 37.5 | -3.63 | 19.8 | 0.960 | 0.653 | 0.481 | 0.904 | 0.990 | 0.702 | ||
| OP | [-] | 65.8 | 65.5 | 65.8 | 69.7 | 37.5 | -4.09 | 19.6 | 0.994 | 0.655 | 0.485 | 0.899 | 0.990 | 0.703 |
Download Data |
Period Mean (original grids) [W/m2] |
Model Period Mean (intersection) [W/m2] |
Model Period Mean (complement) [W/m2] |
Benchmark Period Mean (intersection) [W/m2] |
Benchmark Period Mean (complement) [W/m2] |
Bias [W/m2] |
RMSE [W/m2] |
Phase Shift [months] |
Bias Score [1] |
RMSE Score [1] |
Seasonal Cycle Score [1] |
Spatial Distribution Score [1] |
Overall Score [1] |
|||
|---|---|---|---|---|---|---|---|---|---|---|---|---|---|---|---|---|
| Benchmark | [-] | 22.7 | ||||||||||||||
| CON | [-] | 29.1 | 29.6 | 19.9 | 22.8 | 16.7 | 6.12 | 16.7 | 0.985 | 0.474 | 0.380 | 0.904 | 0.916 | 0.611 | ||
| OP | [-] | 29.0 | 29.4 | 19.8 | 22.8 | 16.7 | 5.98 | 16.5 | 0.971 | 0.475 | 0.382 | 0.906 | 0.920 | 0.613 |
Temporally integrated period mean