Mean State
Download Data |
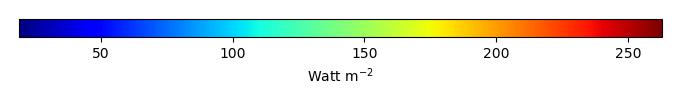
Period Mean (original grids) [Watt m-2] |
Model Period Mean (intersection) [Watt m-2] |
Model Period Mean (complement) [Watt m-2] |
Benchmark Period Mean (intersection) [Watt m-2] |
Benchmark Period Mean (complement) [Watt m-2] |
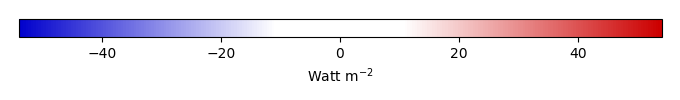
Bias [Watt m-2] |
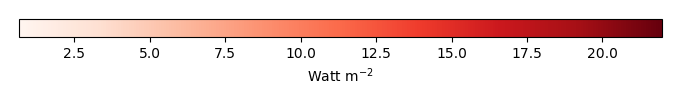
RMSE [Watt m-2] |
Phase Shift [months] |
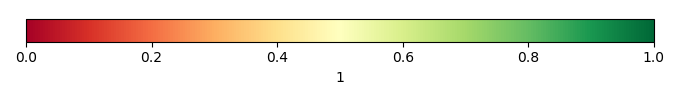
Bias Score [1] |
RMSE Score [1] |
Seasonal Cycle Score [1] |
Spatial Distribution Score [1] |
Interannual Variability Score [1] |
Overall Score [1] |
|||
|---|---|---|---|---|---|---|---|---|---|---|---|---|---|---|---|---|---|
| Benchmark | [-] | 179. | |||||||||||||||
| CON | [-] | 182. | 182. | 179. | 223. | 3.89 | 17.5 | 0.586 | 0.646 | 0.523 | 0.922 | 0.871 | 0.713 | 0.700 | |||
| OP | [-] | 178. | 178. | 179. | 223. | -0.483 | 16.7 | 0.575 | 0.709 | 0.523 | 0.923 | 0.934 | 0.703 | 0.719 |
Download Data |
Period Mean (original grids) [Watt m-2] |
Model Period Mean (intersection) [Watt m-2] |
Model Period Mean (complement) [Watt m-2] |
Benchmark Period Mean (intersection) [Watt m-2] |
Benchmark Period Mean (complement) [Watt m-2] |
Bias [Watt m-2] |
RMSE [Watt m-2] |
Phase Shift [months] |
Bias Score [1] |
RMSE Score [1] |
Seasonal Cycle Score [1] |
Spatial Distribution Score [1] |
Interannual Variability Score [1] |
Overall Score [1] |
|||
|---|---|---|---|---|---|---|---|---|---|---|---|---|---|---|---|---|---|
| Benchmark | [-] | 190. | |||||||||||||||
| CON | [-] | 196. | 195. | 190. | 214. | 5.16 | 16.3 | 0.581 | 0.703 | 0.537 | 0.929 | 0.972 | 0.795 | 0.745 | |||
| OP | [-] | 195. | 195. | 190. | 214. | 4.57 | 16.2 | 0.614 | 0.713 | 0.535 | 0.923 | 0.968 | 0.794 | 0.745 |
Download Data |
Period Mean (original grids) [Watt m-2] |
Model Period Mean (intersection) [Watt m-2] |
Model Period Mean (complement) [Watt m-2] |
Benchmark Period Mean (intersection) [Watt m-2] |
Benchmark Period Mean (complement) [Watt m-2] |
Bias [Watt m-2] |
RMSE [Watt m-2] |
Phase Shift [months] |
Bias Score [1] |
RMSE Score [1] |
Seasonal Cycle Score [1] |
Spatial Distribution Score [1] |
Interannual Variability Score [1] |
Overall Score [1] |
|||
|---|---|---|---|---|---|---|---|---|---|---|---|---|---|---|---|---|---|
| Benchmark | [-] | 195. | |||||||||||||||
| CON | [-] | 197. | 196. | 194. | 227. | 1.62 | 18.9 | 0.569 | 0.738 | 0.565 | 0.921 | 0.930 | 0.663 | 0.730 | |||
| OP | [-] | 194. | 194. | 194. | 227. | -0.517 | 18.5 | 0.586 | 0.767 | 0.565 | 0.919 | 0.930 | 0.660 | 0.734 |
Download Data |
Period Mean (original grids) [Watt m-2] |
Model Period Mean (intersection) [Watt m-2] |
Model Period Mean (complement) [Watt m-2] |
Benchmark Period Mean (intersection) [Watt m-2] |
Benchmark Period Mean (complement) [Watt m-2] |
Bias [Watt m-2] |
RMSE [Watt m-2] |
Phase Shift [months] |
Bias Score [1] |
RMSE Score [1] |
Seasonal Cycle Score [1] |
Spatial Distribution Score [1] |
Interannual Variability Score [1] |
Overall Score [1] |
|||
|---|---|---|---|---|---|---|---|---|---|---|---|---|---|---|---|---|---|
| Benchmark | [-] | 81.1 | |||||||||||||||
| CON | [-] | 72.4 | 72.8 | 80.8 | 86.0 | -8.88 | 20.1 | 0.260 | 0.872 | 0.756 | 0.983 | 0.932 | 0.677 | 0.829 | |||
| OP | [-] | 70.1 | 70.5 | 80.8 | 86.0 | -11.0 | 20.5 | 0.260 | 0.851 | 0.758 | 0.983 | 0.962 | 0.670 | 0.830 |
Download Data |
Period Mean (original grids) [Watt m-2] |
Model Period Mean (intersection) [Watt m-2] |
Model Period Mean (complement) [Watt m-2] |
Benchmark Period Mean (intersection) [Watt m-2] |
Benchmark Period Mean (complement) [Watt m-2] |
Bias [Watt m-2] |
RMSE [Watt m-2] |
Phase Shift [months] |
Bias Score [1] |
RMSE Score [1] |
Seasonal Cycle Score [1] |
Spatial Distribution Score [1] |
Interannual Variability Score [1] |
Overall Score [1] |
|||
|---|---|---|---|---|---|---|---|---|---|---|---|---|---|---|---|---|---|
| Benchmark | [-] | 188. | |||||||||||||||
| CON | [-] | 177. | 177. | 185. | 210. | -2.15 | 22.7 | 0.799 | 0.556 | 0.454 | 0.887 | 0.758 | 0.700 | 0.635 | |||
| OP | [-] | 171. | 170. | 185. | 210. | -8.69 | 23.3 | 0.799 | 0.606 | 0.456 | 0.887 | 0.788 | 0.685 | 0.646 |
Download Data |
Period Mean (original grids) [Watt m-2] |
Model Period Mean (intersection) [Watt m-2] |
Model Period Mean (complement) [Watt m-2] |
Benchmark Period Mean (intersection) [Watt m-2] |
Benchmark Period Mean (complement) [Watt m-2] |
Bias [Watt m-2] |
RMSE [Watt m-2] |
Phase Shift [months] |
Bias Score [1] |
RMSE Score [1] |
Seasonal Cycle Score [1] |
Spatial Distribution Score [1] |
Interannual Variability Score [1] |
Overall Score [1] |
|||
|---|---|---|---|---|---|---|---|---|---|---|---|---|---|---|---|---|---|
| Benchmark | [-] | 104. | |||||||||||||||
| CON | [-] | 101. | 101. | 104. | 115. | -2.94 | 16.1 | 0.137 | 0.935 | 0.802 | 0.991 | 0.995 | 0.635 | 0.860 | |||
| OP | [-] | 97.8 | 97.4 | 104. | 115. | -6.15 | 16.4 | 0.154 | 0.910 | 0.808 | 0.990 | 0.998 | 0.624 | 0.856 |
Download Data |
Period Mean (original grids) [Watt m-2] |
Model Period Mean (intersection) [Watt m-2] |
Model Period Mean (complement) [Watt m-2] |
Benchmark Period Mean (intersection) [Watt m-2] |
Benchmark Period Mean (complement) [Watt m-2] |
Bias [Watt m-2] |
RMSE [Watt m-2] |
Phase Shift [months] |
Bias Score [1] |
RMSE Score [1] |
Seasonal Cycle Score [1] |
Spatial Distribution Score [1] |
Interannual Variability Score [1] |
Overall Score [1] |
|||
|---|---|---|---|---|---|---|---|---|---|---|---|---|---|---|---|---|---|
| Benchmark | [-] | 139. | |||||||||||||||
| CON | [-] | 135. | 135. | 139. | 162. | -2.99 | 17.3 | 0.274 | 0.879 | 0.742 | 0.976 | 0.998 | 0.624 | 0.827 | |||
| OP | [-] | 133. | 134. | 139. | 162. | -4.59 | 17.3 | 0.263 | 0.881 | 0.745 | 0.977 | 0.998 | 0.621 | 0.828 |
Download Data |
Period Mean (original grids) [Watt m-2] |
Model Period Mean (intersection) [Watt m-2] |
Model Period Mean (complement) [Watt m-2] |
Benchmark Period Mean (intersection) [Watt m-2] |
Benchmark Period Mean (complement) [Watt m-2] |
Bias [Watt m-2] |
RMSE [Watt m-2] |
Phase Shift [months] |
Bias Score [1] |
RMSE Score [1] |
Seasonal Cycle Score [1] |
Spatial Distribution Score [1] |
Interannual Variability Score [1] |
Overall Score [1] |
|||
|---|---|---|---|---|---|---|---|---|---|---|---|---|---|---|---|---|---|
| Benchmark | [-] | 179. | |||||||||||||||
| CON | [-] | 175. | 175. | 178. | 214. | -0.712 | 20.3 | 0.271 | 0.765 | 0.612 | 0.981 | 0.913 | 0.629 | 0.752 | |||
| OP | [-] | 172. | 172. | 178. | 214. | -3.92 | 20.3 | 0.268 | 0.781 | 0.613 | 0.981 | 0.916 | 0.624 | 0.755 |
Download Data |
Period Mean (original grids) [Watt m-2] |
Model Period Mean (intersection) [Watt m-2] |
Model Period Mean (complement) [Watt m-2] |
Benchmark Period Mean (intersection) [Watt m-2] |
Benchmark Period Mean (complement) [Watt m-2] |
Bias [Watt m-2] |
RMSE [Watt m-2] |
Phase Shift [months] |
Bias Score [1] |
RMSE Score [1] |
Seasonal Cycle Score [1] |
Spatial Distribution Score [1] |
Interannual Variability Score [1] |
Overall Score [1] |
|||
|---|---|---|---|---|---|---|---|---|---|---|---|---|---|---|---|---|---|
| Benchmark | [-] | 74.2 | |||||||||||||||
| CON | [-] | 64.8 | 65.7 | 74.2 | 70.5 | -10.2 | 19.0 | 0.375 | 0.855 | 0.740 | 0.975 | 0.931 | 0.673 | 0.819 | |||
| OP | [-] | 62.8 | 63.8 | 74.2 | 70.5 | -12.0 | 18.9 | 0.389 | 0.834 | 0.744 | 0.974 | 0.953 | 0.665 | 0.819 |
Download Data |
Period Mean (original grids) [Watt m-2] |
Model Period Mean (intersection) [Watt m-2] |
Model Period Mean (complement) [Watt m-2] |
Benchmark Period Mean (intersection) [Watt m-2] |
Benchmark Period Mean (complement) [Watt m-2] |
Bias [Watt m-2] |
RMSE [Watt m-2] |
Phase Shift [months] |
Bias Score [1] |
RMSE Score [1] |
Seasonal Cycle Score [1] |
Spatial Distribution Score [1] |
Interannual Variability Score [1] |
Overall Score [1] |
|||
|---|---|---|---|---|---|---|---|---|---|---|---|---|---|---|---|---|---|
| Benchmark | [-] | 191. | |||||||||||||||
| CON | [-] | 192. | 192. | 191. | 201. | -0.244 | 19.0 | 0.222 | 0.824 | 0.699 | 0.983 | 0.997 | 0.616 | 0.803 | |||
| OP | [-] | 190. | 190. | 191. | 201. | -2.64 | 19.1 | 0.222 | 0.832 | 0.699 | 0.982 | 0.999 | 0.613 | 0.804 |
Download Data |
Period Mean (original grids) [Watt m-2] |
Model Period Mean (intersection) [Watt m-2] |
Model Period Mean (complement) [Watt m-2] |
Benchmark Period Mean (intersection) [Watt m-2] |
Benchmark Period Mean (complement) [Watt m-2] |
Bias [Watt m-2] |
RMSE [Watt m-2] |
Phase Shift [months] |
Bias Score [1] |
RMSE Score [1] |
Seasonal Cycle Score [1] |
Spatial Distribution Score [1] |
Interannual Variability Score [1] |
Overall Score [1] |
|||
|---|---|---|---|---|---|---|---|---|---|---|---|---|---|---|---|---|---|
| Benchmark | [-] | 121. | |||||||||||||||
| CON | [-] | 112. | 113. | 121. | 120. | -4.16 | 17.2 | 0.450 | 0.895 | 0.807 | 0.969 | 0.997 | 0.628 | 0.850 | |||
| OP | [-] | 110. | 110. | 121. | 120. | -6.72 | 17.6 | 0.369 | 0.883 | 0.809 | 0.974 | 0.997 | 0.620 | 0.849 |
Download Data |
Period Mean (original grids) [Watt m-2] |
Model Period Mean (intersection) [Watt m-2] |
Model Period Mean (complement) [Watt m-2] |
Benchmark Period Mean (intersection) [Watt m-2] |
Benchmark Period Mean (complement) [Watt m-2] |
Bias [Watt m-2] |
RMSE [Watt m-2] |
Phase Shift [months] |
Bias Score [1] |
RMSE Score [1] |
Seasonal Cycle Score [1] |
Spatial Distribution Score [1] |
Interannual Variability Score [1] |
Overall Score [1] |
|||
|---|---|---|---|---|---|---|---|---|---|---|---|---|---|---|---|---|---|
| Benchmark | [-] | 168. | |||||||||||||||
| CON | [-] | 136. | 136. | 146. | 180. | -7.50 | 20.5 | 0.327 | 0.765 | 0.670 | 0.967 | 0.975 | 0.624 | 0.778 | |||
| OP | [-] | 134. | 134. | 146. | 180. | -9.75 | 20.9 | 0.326 | 0.755 | 0.670 | 0.966 | 0.978 | 0.619 | 0.777 |
Download Data |
Period Mean (original grids) [Watt m-2] |
Model Period Mean (intersection) [Watt m-2] |
Model Period Mean (complement) [Watt m-2] |
Benchmark Period Mean (intersection) [Watt m-2] |
Benchmark Period Mean (complement) [Watt m-2] |
Bias [Watt m-2] |
RMSE [Watt m-2] |
Phase Shift [months] |
Bias Score [1] |
RMSE Score [1] |
Seasonal Cycle Score [1] |
Spatial Distribution Score [1] |
Interannual Variability Score [1] |
Overall Score [1] |
|||
|---|---|---|---|---|---|---|---|---|---|---|---|---|---|---|---|---|---|
| Benchmark | [-] | 177. | |||||||||||||||
| CON | [-] | 161. | 161. | 176. | 222. | -13.2 | 22.2 | 0.376 | 0.675 | 0.729 | 0.966 | 0.989 | 0.589 | 0.780 | |||
| OP | [-] | 161. | 160. | 176. | 222. | -13.5 | 22.2 | 0.370 | 0.675 | 0.730 | 0.966 | 0.989 | 0.589 | 0.780 |
Download Data |
Period Mean (original grids) [Watt m-2] |
Model Period Mean (intersection) [Watt m-2] |
Model Period Mean (complement) [Watt m-2] |
Benchmark Period Mean (intersection) [Watt m-2] |
Benchmark Period Mean (complement) [Watt m-2] |
Bias [Watt m-2] |
RMSE [Watt m-2] |
Phase Shift [months] |
Bias Score [1] |
RMSE Score [1] |
Seasonal Cycle Score [1] |
Spatial Distribution Score [1] |
Interannual Variability Score [1] |
Overall Score [1] |
|||
|---|---|---|---|---|---|---|---|---|---|---|---|---|---|---|---|---|---|
| Benchmark | [-] | 79.9 | |||||||||||||||
| CON | [-] | 70.4 | 70.3 | 79.8 | 86.5 | -11.2 | 19.9 | 0.0935 | 0.835 | 0.762 | 0.994 | 0.913 | 0.728 | 0.832 | |||
| OP | [-] | 68.9 | 68.8 | 79.8 | 86.5 | -12.6 | 20.3 | 0.0935 | 0.824 | 0.763 | 0.994 | 0.941 | 0.724 | 0.835 |
Download Data |
Period Mean (original grids) [Watt m-2] |
Model Period Mean (intersection) [Watt m-2] |
Model Period Mean (complement) [Watt m-2] |
Benchmark Period Mean (intersection) [Watt m-2] |
Benchmark Period Mean (complement) [Watt m-2] |
Bias [Watt m-2] |
RMSE [Watt m-2] |
Phase Shift [months] |
Bias Score [1] |
RMSE Score [1] |
Seasonal Cycle Score [1] |
Spatial Distribution Score [1] |
Interannual Variability Score [1] |
Overall Score [1] |
|||
|---|---|---|---|---|---|---|---|---|---|---|---|---|---|---|---|---|---|
| Benchmark | [-] | 206. | |||||||||||||||
| CON | [-] | 193. | 194. | 205. | 219. | -8.53 | 23.1 | 0.279 | 0.708 | 0.638 | 0.971 | 0.839 | 0.621 | 0.736 | |||
| OP | [-] | 190. | 190. | 205. | 219. | -12.0 | 24.2 | 0.346 | 0.688 | 0.638 | 0.960 | 0.845 | 0.616 | 0.731 |
Download Data |
Period Mean (original grids) [Watt m-2] |
Model Period Mean (intersection) [Watt m-2] |
Model Period Mean (complement) [Watt m-2] |
Benchmark Period Mean (intersection) [Watt m-2] |
Benchmark Period Mean (complement) [Watt m-2] |
Bias [Watt m-2] |
RMSE [Watt m-2] |
Phase Shift [months] |
Bias Score [1] |
RMSE Score [1] |
Seasonal Cycle Score [1] |
Spatial Distribution Score [1] |
Interannual Variability Score [1] |
Overall Score [1] |
|||
|---|---|---|---|---|---|---|---|---|---|---|---|---|---|---|---|---|---|
| Benchmark | [-] | 153. | |||||||||||||||
| CON | [-] | 144. | 144. | 153. | 189. | -6.26 | 17.1 | 0.237 | 0.890 | 0.764 | 0.984 | 0.999 | 0.617 | 0.837 | |||
| OP | [-] | 141. | 141. | 153. | 189. | -9.43 | 18.4 | 0.221 | 0.847 | 0.764 | 0.985 | 0.999 | 0.612 | 0.829 |
Download Data |
Period Mean (original grids) [Watt m-2] |
Model Period Mean (intersection) [Watt m-2] |
Model Period Mean (complement) [Watt m-2] |
Benchmark Period Mean (intersection) [Watt m-2] |
Benchmark Period Mean (complement) [Watt m-2] |
Bias [Watt m-2] |
RMSE [Watt m-2] |
Phase Shift [months] |
Bias Score [1] |
RMSE Score [1] |
Seasonal Cycle Score [1] |
Spatial Distribution Score [1] |
Interannual Variability Score [1] |
Overall Score [1] |
|||
|---|---|---|---|---|---|---|---|---|---|---|---|---|---|---|---|---|---|
| Benchmark | [-] | 115. | |||||||||||||||
| CON | [-] | 111. | 110. | 115. | 124. | -4.34 | 15.4 | 0.0859 | 0.915 | 0.823 | 0.994 | 0.999 | 0.648 | 0.867 | |||
| OP | [-] | 106. | 106. | 115. | 124. | -8.77 | 16.9 | 0.0926 | 0.876 | 0.824 | 0.994 | 0.990 | 0.634 | 0.857 |
Download Data |
Period Mean (original grids) [Watt m-2] |
Model Period Mean (intersection) [Watt m-2] |
Model Period Mean (complement) [Watt m-2] |
Benchmark Period Mean (intersection) [Watt m-2] |
Benchmark Period Mean (complement) [Watt m-2] |
Bias [Watt m-2] |
RMSE [Watt m-2] |
Phase Shift [months] |
Bias Score [1] |
RMSE Score [1] |
Seasonal Cycle Score [1] |
Spatial Distribution Score [1] |
Interannual Variability Score [1] |
Overall Score [1] |
|||
|---|---|---|---|---|---|---|---|---|---|---|---|---|---|---|---|---|---|
| Benchmark | [-] | 163. | |||||||||||||||
| CON | [-] | 158. | 158. | 162. | 197. | -4.30 | 16.1 | 0.162 | 0.914 | 0.806 | 0.989 | 0.999 | 0.663 | 0.863 | |||
| OP | [-] | 157. | 157. | 162. | 197. | -5.91 | 16.6 | 0.151 | 0.902 | 0.805 | 0.990 | 0.999 | 0.661 | 0.860 |
Download Data |
Period Mean (original grids) [Watt m-2] |
Model Period Mean (intersection) [Watt m-2] |
Model Period Mean (complement) [Watt m-2] |
Benchmark Period Mean (intersection) [Watt m-2] |
Benchmark Period Mean (complement) [Watt m-2] |
Bias [Watt m-2] |
RMSE [Watt m-2] |
Phase Shift [months] |
Bias Score [1] |
RMSE Score [1] |
Seasonal Cycle Score [1] |
Spatial Distribution Score [1] |
Interannual Variability Score [1] |
Overall Score [1] |
|||
|---|---|---|---|---|---|---|---|---|---|---|---|---|---|---|---|---|---|
| Benchmark | [-] | 177. | |||||||||||||||
| CON | [-] | 174. | 174. | 176. | 228. | -1.09 | 17.9 | 0.593 | 0.796 | 0.467 | 0.921 | 0.945 | 0.640 | 0.706 | |||
| OP | [-] | 168. | 168. | 176. | 228. | -7.39 | 19.4 | 0.574 | 0.654 | 0.469 | 0.924 | 0.971 | 0.628 | 0.686 |
Download Data |
Period Mean (original grids) [Watt m-2] |
Model Period Mean (intersection) [Watt m-2] |
Model Period Mean (complement) [Watt m-2] |
Benchmark Period Mean (intersection) [Watt m-2] |
Benchmark Period Mean (complement) [Watt m-2] |
Bias [Watt m-2] |
RMSE [Watt m-2] |
Phase Shift [months] |
Bias Score [1] |
RMSE Score [1] |
Seasonal Cycle Score [1] |
Spatial Distribution Score [1] |
Interannual Variability Score [1] |
Overall Score [1] |
|||
|---|---|---|---|---|---|---|---|---|---|---|---|---|---|---|---|---|---|
| Benchmark | [-] | 183. | |||||||||||||||
| CON | [-] | 181. | 181. | 183. | 194. | -1.99 | 19.7 | 0.374 | 0.855 | 0.574 | 0.959 | 0.997 | 0.605 | 0.761 | |||
| OP | [-] | 179. | 179. | 183. | 194. | -4.16 | 20.0 | 0.364 | 0.825 | 0.577 | 0.960 | 0.999 | 0.602 | 0.757 |
Download Data |
Period Mean (original grids) [Watt m-2] |
Model Period Mean (intersection) [Watt m-2] |
Model Period Mean (complement) [Watt m-2] |
Benchmark Period Mean (intersection) [Watt m-2] |
Benchmark Period Mean (complement) [Watt m-2] |
Bias [Watt m-2] |
RMSE [Watt m-2] |
Phase Shift [months] |
Bias Score [1] |
RMSE Score [1] |
Seasonal Cycle Score [1] |
Spatial Distribution Score [1] |
Interannual Variability Score [1] |
Overall Score [1] |
|||
|---|---|---|---|---|---|---|---|---|---|---|---|---|---|---|---|---|---|
| Benchmark | [-] | 176. | |||||||||||||||
| CON | [-] | 175. | 174. | 176. | 182. | -5.50 | 23.0 | 0.420 | 0.807 | 0.686 | 0.954 | 0.998 | 0.596 | 0.788 | |||
| OP | [-] | 173. | 171. | 176. | 182. | -7.88 | 23.7 | 0.407 | 0.794 | 0.686 | 0.955 | 0.998 | 0.593 | 0.785 |
Temporally integrated period mean