Mean State
Download Data |
Period Mean (original grids) [Watt m-2] |
Bias [Watt m-2] |
RMSE [Watt m-2] |
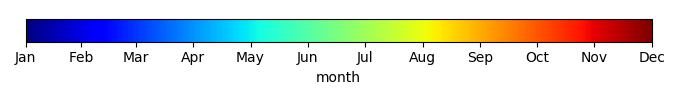
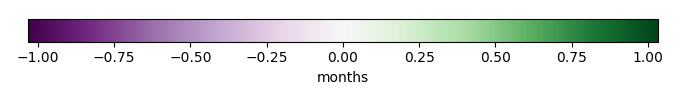
Phase Shift [months] |
Bias Score [1] |
RMSE Score [1] |
Seasonal Cycle Score [1] |
Interannual Variability Score [1] |
Overall Score [1] |
|||
|---|---|---|---|---|---|---|---|---|---|---|---|---|
| Benchmark | [-] | 202. | ||||||||||
| CON | [-] | 194. | 17.3 | 60.2 | 0.00 | 0.189 | 0.392 | 1.00 | 0.183 | 0.431 | ||
| OP | [-] | 193. | 15.0 | 59.5 | 0.00 | 0.196 | 0.392 | 1.00 | 0.182 | 0.432 |
Download Data |
Period Mean (original grids) [Watt m-2] |
Bias [Watt m-2] |
RMSE [Watt m-2] |
Phase Shift [months] |
Bias Score [1] |
RMSE Score [1] |
Seasonal Cycle Score [1] |
Interannual Variability Score [1] |
Overall Score [1] |
|||
|---|---|---|---|---|---|---|---|---|---|---|---|---|
| Benchmark | [-] | 69.4 | ||||||||||
| CON | [-] | 114. | 36.0 | 64.6 | 0.00 | 0.175 | 0.631 | 1.00 | 0.207 | 0.529 | ||
| OP | [-] | 112. | 33.0 | 62.3 | 0.00 | 0.182 | 0.635 | 1.00 | 0.211 | 0.533 |
Download Data |
Period Mean (original grids) [Watt m-2] |
Bias [Watt m-2] |
RMSE [Watt m-2] |
Phase Shift [months] |
Bias Score [1] |
RMSE Score [1] |
Seasonal Cycle Score [1] |
Interannual Variability Score [1] |
Overall Score [1] |
|||
|---|---|---|---|---|---|---|---|---|---|---|---|---|
| Benchmark | [-] | 108. | ||||||||||
| CON | [-] | 130. | 9.81 | 38.3 | 0.193 | 0.283 | 0.627 | 0.987 | 0.351 | 0.575 | ||
| OP | [-] | 128. | 7.97 | 37.7 | 0.256 | 0.289 | 0.624 | 0.983 | 0.357 | 0.576 |
Download Data |
Period Mean (original grids) [Watt m-2] |
Bias [Watt m-2] |
RMSE [Watt m-2] |
Phase Shift [months] |
Bias Score [1] |
RMSE Score [1] |
Seasonal Cycle Score [1] |
Interannual Variability Score [1] |
Overall Score [1] |
|||
|---|---|---|---|---|---|---|---|---|---|---|---|---|
| Benchmark | [-] | 176. | ||||||||||
| CON | [-] | 157. | -31.2 | 33.7 | 0.00 | 0.155 | 0.753 | 1.00 | 0.441 | 0.621 | ||
| OP | [-] | 157. | -31.2 | 33.7 | 0.00 | 0.155 | 0.753 | 1.00 | 0.441 | 0.621 |
Download Data |
Period Mean (original grids) [Watt m-2] |
Bias [Watt m-2] |
RMSE [Watt m-2] |
Phase Shift [months] |
Bias Score [1] |
RMSE Score [1] |
Seasonal Cycle Score [1] |
Interannual Variability Score [1] |
Overall Score [1] |
|||
|---|---|---|---|---|---|---|---|---|---|---|---|---|
| Benchmark | [-] | 62.8 | ||||||||||
| CON | [-] | 50.7 | -2.28 | 46.5 | 0.00 | 0.482 | 0.457 | 1.00 | 0.412 | 0.562 | ||
| OP | [-] | 50.5 | -2.82 | 45.0 | 0.00 | 0.478 | 0.465 | 1.00 | 0.415 | 0.565 |
Download Data |
Period Mean (original grids) [Watt m-2] |
Bias [Watt m-2] |
RMSE [Watt m-2] |
Phase Shift [months] |
Bias Score [1] |
RMSE Score [1] |
Seasonal Cycle Score [1] |
Interannual Variability Score [1] |
Overall Score [1] |
|||
|---|---|---|---|---|---|---|---|---|---|---|---|---|
| Benchmark | [-] | 135. | ||||||||||
| CON | [-] | 145. | 4.03 | 19.0 | 0.203 | 0.609 | 0.786 | 0.987 | 0.655 | 0.765 | ||
| OP | [-] | 142. | 1.27 | 18.4 | 0.407 | 0.634 | 0.775 | 0.973 | 0.637 | 0.759 |
Download Data |
Period Mean (original grids) [Watt m-2] |
Bias [Watt m-2] |
RMSE [Watt m-2] |
Phase Shift [months] |
Bias Score [1] |
RMSE Score [1] |
Seasonal Cycle Score [1] |
Interannual Variability Score [1] |
Overall Score [1] |
|||
|---|---|---|---|---|---|---|---|---|---|---|---|---|
| Benchmark | [-] | 151. | ||||||||||
| CON | [-] | 152. | 0.996 | 15.0 | 0.00 | 0.942 | 0.811 | 1.00 | 0.947 | 0.902 | ||
| OP | [-] | 150. | -0.679 | 15.2 | 0.00 | 0.941 | 0.808 | 1.00 | 0.936 | 0.899 |
Temporally integrated period mean