Mean State
Download Data |
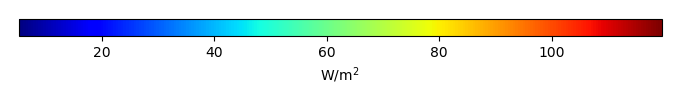
Period Mean (original grids) [W/m2] |
Model Period Mean (intersection) [W/m2] |
Model Period Mean (complement) [W/m2] |
Benchmark Period Mean (intersection) [W/m2] |
Benchmark Period Mean (complement) [W/m2] |
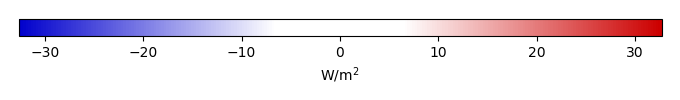
Bias [W/m2] |
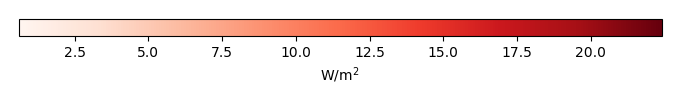
RMSE [W/m2] |
Phase Shift [months] |
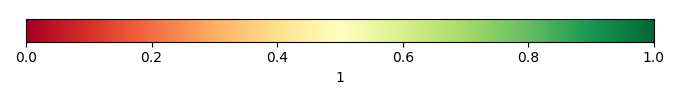
Bias Score [1] |
RMSE Score [1] |
Seasonal Cycle Score [1] |
Spatial Distribution Score [1] |
Interannual Variability Score [1] |
Overall Score [1] |
|||
|---|---|---|---|---|---|---|---|---|---|---|---|---|---|---|---|---|---|
| Benchmark | [-] | 31.3 | |||||||||||||||
| CON | [-] | 33.3 | 33.8 | 31.7 | 11.2 | 2.79 | 8.24 | 1.92 | 0.397 | 0.326 | 0.717 | 0.936 | 0.688 | 0.565 | |||
| OP | [-] | 37.7 | 38.3 | 31.7 | 11.2 | 7.13 | 11.4 | 1.91 | 0.207 | 0.299 | 0.718 | 0.877 | 0.744 | 0.524 |
Download Data |
Period Mean (original grids) [W/m2] |
Model Period Mean (intersection) [W/m2] |
Model Period Mean (complement) [W/m2] |
Benchmark Period Mean (intersection) [W/m2] |
Benchmark Period Mean (complement) [W/m2] |
Bias [W/m2] |
RMSE [W/m2] |
Phase Shift [months] |
Bias Score [1] |
RMSE Score [1] |
Seasonal Cycle Score [1] |
Spatial Distribution Score [1] |
Interannual Variability Score [1] |
Overall Score [1] |
|||
|---|---|---|---|---|---|---|---|---|---|---|---|---|---|---|---|---|---|
| Benchmark | [-] | 44.7 | |||||||||||||||
| CON | [-] | 45.2 | 45.5 | 44.7 | 13.0 | 0.588 | 9.35 | 0.918 | 0.517 | 0.340 | 0.889 | 0.968 | 0.708 | 0.627 | |||
| OP | [-] | 45.7 | 46.1 | 44.7 | 13.0 | 1.19 | 9.76 | 0.875 | 0.476 | 0.330 | 0.894 | 0.956 | 0.724 | 0.618 |
Download Data |
Period Mean (original grids) [W/m2] |
Model Period Mean (intersection) [W/m2] |
Model Period Mean (complement) [W/m2] |
Benchmark Period Mean (intersection) [W/m2] |
Benchmark Period Mean (complement) [W/m2] |
Bias [W/m2] |
RMSE [W/m2] |
Phase Shift [months] |
Bias Score [1] |
RMSE Score [1] |
Seasonal Cycle Score [1] |
Spatial Distribution Score [1] |
Interannual Variability Score [1] |
Overall Score [1] |
|||
|---|---|---|---|---|---|---|---|---|---|---|---|---|---|---|---|---|---|
| Benchmark | [-] | 33.4 | |||||||||||||||
| CON | [-] | 36.7 | 36.6 | 33.9 | 14.3 | 2.79 | 8.73 | 1.41 | 0.530 | 0.409 | 0.807 | 0.863 | 0.704 | 0.620 | |||
| OP | [-] | 38.9 | 38.8 | 33.9 | 14.3 | 4.90 | 9.46 | 1.35 | 0.460 | 0.407 | 0.816 | 0.826 | 0.720 | 0.606 |
Download Data |
Period Mean (original grids) [W/m2] |
Model Period Mean (intersection) [W/m2] |
Model Period Mean (complement) [W/m2] |
Benchmark Period Mean (intersection) [W/m2] |
Benchmark Period Mean (complement) [W/m2] |
Bias [W/m2] |
RMSE [W/m2] |
Phase Shift [months] |
Bias Score [1] |
RMSE Score [1] |
Seasonal Cycle Score [1] |
Spatial Distribution Score [1] |
Interannual Variability Score [1] |
Overall Score [1] |
|||
|---|---|---|---|---|---|---|---|---|---|---|---|---|---|---|---|---|---|
| Benchmark | [-] | 40.8 | |||||||||||||||
| CON | [-] | 33.8 | 33.7 | 41.0 | 36.3 | -6.67 | 23.8 | 0.228 | 0.809 | 0.636 | 0.985 | 0.929 | 0.648 | 0.774 | |||
| OP | [-] | 36.1 | 36.0 | 41.0 | 36.3 | -4.51 | 22.9 | 0.228 | 0.832 | 0.640 | 0.985 | 0.864 | 0.652 | 0.769 |
Download Data |
Period Mean (original grids) [W/m2] |
Model Period Mean (intersection) [W/m2] |
Model Period Mean (complement) [W/m2] |
Benchmark Period Mean (intersection) [W/m2] |
Benchmark Period Mean (complement) [W/m2] |
Bias [W/m2] |
RMSE [W/m2] |
Phase Shift [months] |
Bias Score [1] |
RMSE Score [1] |
Seasonal Cycle Score [1] |
Spatial Distribution Score [1] |
Interannual Variability Score [1] |
Overall Score [1] |
|||
|---|---|---|---|---|---|---|---|---|---|---|---|---|---|---|---|---|---|
| Benchmark | [-] | 17.7 | |||||||||||||||
| CON | [-] | 27.7 | 27.6 | 18.3 | 12.1 | 10.1 | 11.6 | 1.51 | 0.237 | 0.356 | 0.767 | 0.490 | 0.684 | 0.482 | |||
| OP | [-] | 34.3 | 34.3 | 18.3 | 12.1 | 16.6 | 17.3 | 1.50 | 0.0631 | 0.322 | 0.769 | 0.549 | 0.691 | 0.453 |
Download Data |
Period Mean (original grids) [W/m2] |
Model Period Mean (intersection) [W/m2] |
Model Period Mean (complement) [W/m2] |
Benchmark Period Mean (intersection) [W/m2] |
Benchmark Period Mean (complement) [W/m2] |
Bias [W/m2] |
RMSE [W/m2] |
Phase Shift [months] |
Bias Score [1] |
RMSE Score [1] |
Seasonal Cycle Score [1] |
Spatial Distribution Score [1] |
Interannual Variability Score [1] |
Overall Score [1] |
|||
|---|---|---|---|---|---|---|---|---|---|---|---|---|---|---|---|---|---|
| Benchmark | [-] | 28.1 | |||||||||||||||
| CON | [-] | 25.1 | 24.8 | 28.1 | 26.9 | -3.24 | 11.6 | 0.245 | 0.788 | 0.625 | 0.984 | 0.958 | 0.671 | 0.775 | |||
| OP | [-] | 28.3 | 28.0 | 28.1 | 26.9 | 0.0328 | 11.6 | 0.418 | 0.837 | 0.613 | 0.954 | 0.852 | 0.672 | 0.757 |
Download Data |
Period Mean (original grids) [W/m2] |
Model Period Mean (intersection) [W/m2] |
Model Period Mean (complement) [W/m2] |
Benchmark Period Mean (intersection) [W/m2] |
Benchmark Period Mean (complement) [W/m2] |
Bias [W/m2] |
RMSE [W/m2] |
Phase Shift [months] |
Bias Score [1] |
RMSE Score [1] |
Seasonal Cycle Score [1] |
Spatial Distribution Score [1] |
Interannual Variability Score [1] |
Overall Score [1] |
|||
|---|---|---|---|---|---|---|---|---|---|---|---|---|---|---|---|---|---|
| Benchmark | [-] | 35.8 | |||||||||||||||
| CON | [-] | 35.3 | 35.2 | 36.1 | 8.36 | -1.58 | 10.9 | 0.892 | 0.680 | 0.542 | 0.886 | 0.897 | 0.685 | 0.705 | |||
| OP | [-] | 36.7 | 36.6 | 36.1 | 8.36 | 0.0298 | 11.8 | 0.880 | 0.615 | 0.533 | 0.891 | 0.796 | 0.697 | 0.678 |
Download Data |
Period Mean (original grids) [W/m2] |
Model Period Mean (intersection) [W/m2] |
Model Period Mean (complement) [W/m2] |
Benchmark Period Mean (intersection) [W/m2] |
Benchmark Period Mean (complement) [W/m2] |
Bias [W/m2] |
RMSE [W/m2] |
Phase Shift [months] |
Bias Score [1] |
RMSE Score [1] |
Seasonal Cycle Score [1] |
Spatial Distribution Score [1] |
Interannual Variability Score [1] |
Overall Score [1] |
|||
|---|---|---|---|---|---|---|---|---|---|---|---|---|---|---|---|---|---|
| Benchmark | [-] | 29.2 | |||||||||||||||
| CON | [-] | 33.0 | 33.2 | 29.6 | 12.0 | 3.03 | 9.95 | 1.10 | 0.512 | 0.422 | 0.871 | 0.800 | 0.661 | 0.615 | |||
| OP | [-] | 36.0 | 36.2 | 29.6 | 12.0 | 6.24 | 11.6 | 0.923 | 0.405 | 0.404 | 0.891 | 0.697 | 0.682 | 0.580 |
Download Data |
Period Mean (original grids) [W/m2] |
Model Period Mean (intersection) [W/m2] |
Model Period Mean (complement) [W/m2] |
Benchmark Period Mean (intersection) [W/m2] |
Benchmark Period Mean (complement) [W/m2] |
Bias [W/m2] |
RMSE [W/m2] |
Phase Shift [months] |
Bias Score [1] |
RMSE Score [1] |
Seasonal Cycle Score [1] |
Spatial Distribution Score [1] |
Interannual Variability Score [1] |
Overall Score [1] |
|||
|---|---|---|---|---|---|---|---|---|---|---|---|---|---|---|---|---|---|
| Benchmark | [-] | 36.1 | |||||||||||||||
| CON | [-] | 30.3 | 30.0 | 36.0 | 42.5 | -5.22 | 21.3 | 0.189 | 0.854 | 0.659 | 0.987 | 0.849 | 0.675 | 0.781 | |||
| OP | [-] | 32.3 | 32.1 | 36.0 | 42.5 | -3.35 | 20.7 | 0.190 | 0.869 | 0.661 | 0.987 | 0.769 | 0.677 | 0.771 |
Download Data |
Period Mean (original grids) [W/m2] |
Model Period Mean (intersection) [W/m2] |
Model Period Mean (complement) [W/m2] |
Benchmark Period Mean (intersection) [W/m2] |
Benchmark Period Mean (complement) [W/m2] |
Bias [W/m2] |
RMSE [W/m2] |
Phase Shift [months] |
Bias Score [1] |
RMSE Score [1] |
Seasonal Cycle Score [1] |
Spatial Distribution Score [1] |
Interannual Variability Score [1] |
Overall Score [1] |
|||
|---|---|---|---|---|---|---|---|---|---|---|---|---|---|---|---|---|---|
| Benchmark | [-] | 36.6 | |||||||||||||||
| CON | [-] | 39.2 | 39.3 | 37.5 | 12.9 | 0.490 | 9.73 | 0.674 | 0.579 | 0.547 | 0.936 | 0.745 | 0.684 | 0.673 | |||
| OP | [-] | 41.5 | 41.5 | 37.5 | 12.9 | 2.87 | 9.95 | 0.663 | 0.596 | 0.538 | 0.937 | 0.686 | 0.695 | 0.665 |
Download Data |
Period Mean (original grids) [W/m2] |
Model Period Mean (intersection) [W/m2] |
Model Period Mean (complement) [W/m2] |
Benchmark Period Mean (intersection) [W/m2] |
Benchmark Period Mean (complement) [W/m2] |
Bias [W/m2] |
RMSE [W/m2] |
Phase Shift [months] |
Bias Score [1] |
RMSE Score [1] |
Seasonal Cycle Score [1] |
Spatial Distribution Score [1] |
Interannual Variability Score [1] |
Overall Score [1] |
|||
|---|---|---|---|---|---|---|---|---|---|---|---|---|---|---|---|---|---|
| Benchmark | [-] | 19.6 | |||||||||||||||
| CON | [-] | 22.4 | 22.5 | 19.8 | 7.93 | 2.79 | 9.57 | 0.916 | 0.650 | 0.532 | 0.883 | 0.835 | 0.665 | 0.683 | |||
| OP | [-] | 24.9 | 24.9 | 19.8 | 7.93 | 5.37 | 10.5 | 0.629 | 0.610 | 0.522 | 0.929 | 0.752 | 0.669 | 0.667 |
Download Data |
Period Mean (original grids) [W/m2] |
Model Period Mean (intersection) [W/m2] |
Model Period Mean (complement) [W/m2] |
Benchmark Period Mean (intersection) [W/m2] |
Benchmark Period Mean (complement) [W/m2] |
Bias [W/m2] |
RMSE [W/m2] |
Phase Shift [months] |
Bias Score [1] |
RMSE Score [1] |
Seasonal Cycle Score [1] |
Spatial Distribution Score [1] |
Interannual Variability Score [1] |
Overall Score [1] |
|||
|---|---|---|---|---|---|---|---|---|---|---|---|---|---|---|---|---|---|
| Benchmark | [-] | 24.0 | |||||||||||||||
| CON | [-] | 45.1 | 45.1 | 42.6 | 13.7 | 0.956 | 13.9 | 0.777 | 0.603 | 0.520 | 0.904 | 0.986 | 0.665 | 0.700 | |||
| OP | [-] | 47.3 | 47.3 | 42.6 | 13.7 | 3.21 | 14.7 | 0.747 | 0.568 | 0.513 | 0.909 | 0.981 | 0.673 | 0.693 |
Download Data |
Period Mean (original grids) [W/m2] |
Model Period Mean (intersection) [W/m2] |
Model Period Mean (complement) [W/m2] |
Benchmark Period Mean (intersection) [W/m2] |
Benchmark Period Mean (complement) [W/m2] |
Bias [W/m2] |
RMSE [W/m2] |
Phase Shift [months] |
Bias Score [1] |
RMSE Score [1] |
Seasonal Cycle Score [1] |
Spatial Distribution Score [1] |
Interannual Variability Score [1] |
Overall Score [1] |
|||
|---|---|---|---|---|---|---|---|---|---|---|---|---|---|---|---|---|---|
| Benchmark | [-] | 72.5 | |||||||||||||||
| CON | [-] | 78.8 | 79.3 | 73.0 | 12.5 | 3.74 | 16.1 | 0.764 | 0.546 | 0.535 | 0.921 | 0.975 | 0.700 | 0.702 | |||
| OP | [-] | 79.1 | 79.6 | 73.0 | 12.5 | 4.08 | 16.2 | 0.740 | 0.548 | 0.535 | 0.923 | 0.972 | 0.700 | 0.702 |
Download Data |
Period Mean (original grids) [W/m2] |
Model Period Mean (intersection) [W/m2] |
Model Period Mean (complement) [W/m2] |
Benchmark Period Mean (intersection) [W/m2] |
Benchmark Period Mean (complement) [W/m2] |
Bias [W/m2] |
RMSE [W/m2] |
Phase Shift [months] |
Bias Score [1] |
RMSE Score [1] |
Seasonal Cycle Score [1] |
Spatial Distribution Score [1] |
Interannual Variability Score [1] |
Overall Score [1] |
|||
|---|---|---|---|---|---|---|---|---|---|---|---|---|---|---|---|---|---|
| Benchmark | [-] | 46.1 | |||||||||||||||
| CON | [-] | 37.7 | 37.6 | 46.2 | 38.9 | -7.45 | 23.5 | 0.205 | 0.828 | 0.662 | 0.984 | 0.937 | 0.676 | 0.791 | |||
| OP | [-] | 39.2 | 39.2 | 46.2 | 38.9 | -6.09 | 23.1 | 0.206 | 0.842 | 0.662 | 0.984 | 0.884 | 0.678 | 0.785 |
Download Data |
Period Mean (original grids) [W/m2] |
Model Period Mean (intersection) [W/m2] |
Model Period Mean (complement) [W/m2] |
Benchmark Period Mean (intersection) [W/m2] |
Benchmark Period Mean (complement) [W/m2] |
Bias [W/m2] |
RMSE [W/m2] |
Phase Shift [months] |
Bias Score [1] |
RMSE Score [1] |
Seasonal Cycle Score [1] |
Spatial Distribution Score [1] |
Interannual Variability Score [1] |
Overall Score [1] |
|||
|---|---|---|---|---|---|---|---|---|---|---|---|---|---|---|---|---|---|
| Benchmark | [-] | 26.3 | |||||||||||||||
| CON | [-] | 33.1 | 33.1 | 27.0 | 12.8 | 6.03 | 12.1 | 0.802 | 0.370 | 0.456 | 0.899 | 0.400 | 0.663 | 0.541 | |||
| OP | [-] | 36.4 | 36.5 | 27.0 | 12.8 | 9.46 | 13.9 | 0.769 | 0.330 | 0.440 | 0.906 | 0.363 | 0.664 | 0.524 |
Download Data |
Period Mean (original grids) [W/m2] |
Model Period Mean (intersection) [W/m2] |
Model Period Mean (complement) [W/m2] |
Benchmark Period Mean (intersection) [W/m2] |
Benchmark Period Mean (complement) [W/m2] |
Bias [W/m2] |
RMSE [W/m2] |
Phase Shift [months] |
Bias Score [1] |
RMSE Score [1] |
Seasonal Cycle Score [1] |
Spatial Distribution Score [1] |
Interannual Variability Score [1] |
Overall Score [1] |
|||
|---|---|---|---|---|---|---|---|---|---|---|---|---|---|---|---|---|---|
| Benchmark | [-] | 26.9 | |||||||||||||||
| CON | [-] | 27.4 | 27.6 | 27.1 | 12.9 | 0.210 | 8.41 | 1.11 | 0.686 | 0.540 | 0.835 | 0.739 | 0.671 | 0.668 | |||
| OP | [-] | 30.6 | 30.7 | 27.1 | 12.9 | 3.35 | 8.20 | 0.787 | 0.688 | 0.574 | 0.888 | 0.587 | 0.683 | 0.665 |
Download Data |
Period Mean (original grids) [W/m2] |
Model Period Mean (intersection) [W/m2] |
Model Period Mean (complement) [W/m2] |
Benchmark Period Mean (intersection) [W/m2] |
Benchmark Period Mean (complement) [W/m2] |
Bias [W/m2] |
RMSE [W/m2] |
Phase Shift [months] |
Bias Score [1] |
RMSE Score [1] |
Seasonal Cycle Score [1] |
Spatial Distribution Score [1] |
Interannual Variability Score [1] |
Overall Score [1] |
|||
|---|---|---|---|---|---|---|---|---|---|---|---|---|---|---|---|---|---|
| Benchmark | [-] | 26.3 | |||||||||||||||
| CON | [-] | 24.6 | 24.8 | 26.6 | 10.0 | -2.18 | 11.6 | 0.379 | 0.739 | 0.582 | 0.956 | 0.962 | 0.631 | 0.742 | |||
| OP | [-] | 29.0 | 29.1 | 26.6 | 10.0 | 2.27 | 12.1 | 0.563 | 0.758 | 0.567 | 0.931 | 0.852 | 0.630 | 0.718 |
Download Data |
Period Mean (original grids) [W/m2] |
Model Period Mean (intersection) [W/m2] |
Model Period Mean (complement) [W/m2] |
Benchmark Period Mean (intersection) [W/m2] |
Benchmark Period Mean (complement) [W/m2] |
Bias [W/m2] |
RMSE [W/m2] |
Phase Shift [months] |
Bias Score [1] |
RMSE Score [1] |
Seasonal Cycle Score [1] |
Spatial Distribution Score [1] |
Interannual Variability Score [1] |
Overall Score [1] |
|||
|---|---|---|---|---|---|---|---|---|---|---|---|---|---|---|---|---|---|
| Benchmark | [-] | 38.3 | |||||||||||||||
| CON | [-] | 35.3 | 35.3 | 38.4 | 14.1 | -3.67 | 10.4 | 1.04 | 0.686 | 0.570 | 0.849 | 0.975 | 0.744 | 0.732 | |||
| OP | [-] | 36.7 | 36.6 | 38.4 | 14.1 | -2.09 | 10.2 | 0.991 | 0.702 | 0.571 | 0.853 | 0.930 | 0.750 | 0.730 |
Download Data |
Period Mean (original grids) [W/m2] |
Model Period Mean (intersection) [W/m2] |
Model Period Mean (complement) [W/m2] |
Benchmark Period Mean (intersection) [W/m2] |
Benchmark Period Mean (complement) [W/m2] |
Bias [W/m2] |
RMSE [W/m2] |
Phase Shift [months] |
Bias Score [1] |
RMSE Score [1] |
Seasonal Cycle Score [1] |
Spatial Distribution Score [1] |
Interannual Variability Score [1] |
Overall Score [1] |
|||
|---|---|---|---|---|---|---|---|---|---|---|---|---|---|---|---|---|---|
| Benchmark | [-] | 27.6 | |||||||||||||||
| CON | [-] | 27.1 | 27.1 | 27.8 | 11.2 | -0.431 | 5.34 | 1.19 | 0.540 | 0.443 | 0.851 | 0.815 | 0.625 | 0.620 | |||
| OP | [-] | 33.5 | 33.5 | 27.8 | 11.2 | 5.86 | 7.56 | 1.16 | 0.323 | 0.437 | 0.855 | 0.748 | 0.698 | 0.583 |
Download Data |
Period Mean (original grids) [W/m2] |
Model Period Mean (intersection) [W/m2] |
Model Period Mean (complement) [W/m2] |
Benchmark Period Mean (intersection) [W/m2] |
Benchmark Period Mean (complement) [W/m2] |
Bias [W/m2] |
RMSE [W/m2] |
Phase Shift [months] |
Bias Score [1] |
RMSE Score [1] |
Seasonal Cycle Score [1] |
Spatial Distribution Score [1] |
Interannual Variability Score [1] |
Overall Score [1] |
|||
|---|---|---|---|---|---|---|---|---|---|---|---|---|---|---|---|---|---|
| Benchmark | [-] | 31.2 | |||||||||||||||
| CON | [-] | 31.3 | 31.2 | 31.4 | 11.1 | -0.192 | 6.83 | 1.05 | 0.650 | 0.489 | 0.859 | 0.671 | 0.707 | 0.644 | |||
| OP | [-] | 33.5 | 33.4 | 31.4 | 11.1 | 1.99 | 6.80 | 1.01 | 0.644 | 0.509 | 0.872 | 0.551 | 0.727 | 0.635 |
Download Data |
Period Mean (original grids) [W/m2] |
Model Period Mean (intersection) [W/m2] |
Model Period Mean (complement) [W/m2] |
Benchmark Period Mean (intersection) [W/m2] |
Benchmark Period Mean (complement) [W/m2] |
Bias [W/m2] |
RMSE [W/m2] |
Phase Shift [months] |
Bias Score [1] |
RMSE Score [1] |
Seasonal Cycle Score [1] |
Spatial Distribution Score [1] |
Interannual Variability Score [1] |
Overall Score [1] |
|||
|---|---|---|---|---|---|---|---|---|---|---|---|---|---|---|---|---|---|
| Benchmark | [-] | 30.1 | |||||||||||||||
| CON | [-] | 33.5 | 33.5 | 30.9 | 12.2 | 1.83 | 10.7 | 0.857 | 0.523 | 0.507 | 0.897 | 0.966 | 0.681 | 0.680 | |||
| OP | [-] | 36.0 | 36.0 | 30.9 | 12.2 | 4.26 | 11.6 | 0.880 | 0.492 | 0.485 | 0.895 | 0.957 | 0.698 | 0.669 |
Temporally integrated period mean