Mean State
Download Data |
Period Mean (original grids) [Pg] |
Model Period Mean (intersection) [Pg] |
Model Period Mean (complement) [Pg] |
Benchmark Period Mean (intersection) [Pg] |
Benchmark Period Mean (complement) [Pg] |
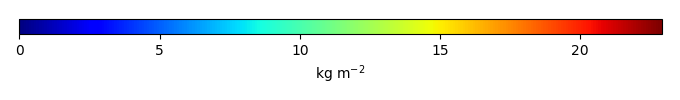
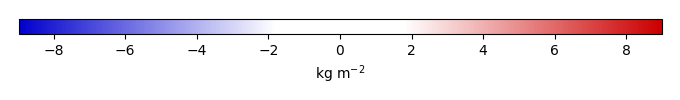
Bias [kg m-2] |
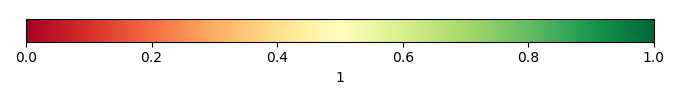
Bias Score [1] |
Spatial Distribution Score [1] |
Overall Score [1] |
|||
|---|---|---|---|---|---|---|---|---|---|---|---|---|
| Benchmark | [-] | 38.7 | ||||||||||
| Control | [-] | 40.5 | 38.1 | 0.651 | 38.7 | 0.000568 | 0.380 | 0.744 | 0.928 | 0.836 | ||
| LMBIRCH | [-] | 40.4 | 38.0 | 0.649 | 38.7 | 0.000568 | 0.358 | 0.744 | 0.929 | 0.836 | ||
| LMBIRCH2 | [-] | 44.9 | 41.7 | 0.686 | 38.7 | 0.000568 | 1.23 | 0.731 | 0.923 | 0.827 | ||
| LUNA3 | [-] | 40.4 | 38.0 | 0.649 | 38.7 | 0.000568 | 0.358 | 0.744 | 0.929 | 0.836 |
Download Data |
Period Mean (original grids) [Pg] |
Model Period Mean (intersection) [Pg] |
Model Period Mean (complement) [Pg] |
Benchmark Period Mean (intersection) [Pg] |
Benchmark Period Mean (complement) [Pg] |
Bias [kg m-2] |
Bias Score [1] |
Spatial Distribution Score [1] |
Overall Score [1] |
|||
|---|---|---|---|---|---|---|---|---|---|---|---|---|
| Benchmark | [-] | 11.9 | ||||||||||
| Control | [-] | 2.32 | 3.28 | 0.0818 | 11.9 | 0.000887 | -1.26 | 0.457 | 0.717 | 0.587 | ||
| LMBIRCH | [-] | 2.08 | 3.06 | 0.0812 | 11.9 | 0.000887 | -1.30 | 0.449 | 0.698 | 0.573 | ||
| LMBIRCH2 | [-] | 2.95 | 4.34 | 0.0874 | 11.9 | 0.000887 | -1.10 | 0.482 | 0.793 | 0.637 | ||
| LUNA3 | [-] | 2.08 | 3.06 | 0.0813 | 11.9 | 0.000887 | -1.30 | 0.449 | 0.698 | 0.573 |
Download Data |
Period Mean (original grids) [Pg] |
Model Period Mean (intersection) [Pg] |
Model Period Mean (complement) [Pg] |
Benchmark Period Mean (intersection) [Pg] |
Benchmark Period Mean (complement) [Pg] |
Bias [kg m-2] |
Bias Score [1] |
Spatial Distribution Score [1] |
Overall Score [1] |
|||
|---|---|---|---|---|---|---|---|---|---|---|---|---|
| Benchmark | [-] | 24.6 | ||||||||||
| Control | [-] | 14.0 | 13.4 | 0.752 | 24.5 | 0.0133 | -0.920 | 0.524 | 0.785 | 0.654 | ||
| LMBIRCH | [-] | 13.7 | 13.1 | 0.745 | 24.5 | 0.0133 | -0.955 | 0.520 | 0.789 | 0.655 | ||
| LMBIRCH2 | [-] | 14.7 | 14.3 | 0.790 | 24.5 | 0.0133 | -0.809 | 0.532 | 0.772 | 0.652 | ||
| LUNA3 | [-] | 13.7 | 13.0 | 0.744 | 24.5 | 0.0133 | -0.957 | 0.520 | 0.789 | 0.654 |
Download Data |
Period Mean (original grids) [Pg] |
Model Period Mean (intersection) [Pg] |
Model Period Mean (complement) [Pg] |
Benchmark Period Mean (intersection) [Pg] |
Benchmark Period Mean (complement) [Pg] |
Bias [kg m-2] |
Bias Score [1] |
Spatial Distribution Score [1] |
Overall Score [1] |
|||
|---|---|---|---|---|---|---|---|---|---|---|---|---|
| Benchmark | [-] | 36.8 | ||||||||||
| Control | [-] | 40.5 | 35.5 | 3.70 | 36.4 | 0.356 | 6.33 | 0.694 | 0.902 | 0.798 | ||
| LMBIRCH | [-] | 40.4 | 35.4 | 3.69 | 36.4 | 0.356 | 6.28 | 0.695 | 0.901 | 0.798 | ||
| LMBIRCH2 | [-] | 42.8 | 37.5 | 3.90 | 36.4 | 0.356 | 7.22 | 0.671 | 0.915 | 0.793 | ||
| LUNA3 | [-] | 40.4 | 35.4 | 3.69 | 36.4 | 0.356 | 6.28 | 0.695 | 0.901 | 0.798 |
Download Data |
Period Mean (original grids) [Pg] |
Model Period Mean (intersection) [Pg] |
Model Period Mean (complement) [Pg] |
Benchmark Period Mean (intersection) [Pg] |
Benchmark Period Mean (complement) [Pg] |
Bias [kg m-2] |
Bias Score [1] |
Spatial Distribution Score [1] |
Overall Score [1] |
|||
|---|---|---|---|---|---|---|---|---|---|---|---|---|
| Benchmark | [-] | 38.4 | ||||||||||
| Control | [-] | 35.2 | 24.9 | 10.6 | 38.3 | 0.0457 | -1.08 | 0.600 | 0.796 | 0.698 | ||
| LMBIRCH | [-] | 35.0 | 25.2 | 10.3 | 38.3 | 0.0457 | -1.06 | 0.605 | 0.811 | 0.708 | ||
| LMBIRCH2 | [-] | 41.6 | 29.7 | 12.5 | 38.3 | 0.0457 | -0.346 | 0.581 | 0.693 | 0.637 | ||
| LUNA3 | [-] | 30.1 | 22.8 | 7.73 | 38.3 | 0.0457 | -1.43 | 0.606 | 0.847 | 0.726 |
Download Data |
Period Mean (original grids) [Pg] |
Model Period Mean (intersection) [Pg] |
Model Period Mean (complement) [Pg] |
Benchmark Period Mean (intersection) [Pg] |
Benchmark Period Mean (complement) [Pg] |
Bias [kg m-2] |
Bias Score [1] |
Spatial Distribution Score [1] |
Overall Score [1] |
|||
|---|---|---|---|---|---|---|---|---|---|---|---|---|
| Benchmark | [-] | 43.7 | ||||||||||
| Control | [-] | 27.2 | 23.9 | 1.37 | 43.7 | 0.0383 | -1.48 | 0.613 | 0.887 | 0.750 | ||
| LMBIRCH | [-] | 26.5 | 23.3 | 1.35 | 43.7 | 0.0383 | -1.57 | 0.609 | 0.888 | 0.748 | ||
| LMBIRCH2 | [-] | 30.0 | 26.3 | 1.45 | 43.7 | 0.0383 | -1.08 | 0.630 | 0.883 | 0.756 | ||
| LUNA3 | [-] | 26.2 | 23.0 | 1.35 | 43.7 | 0.0383 | -1.61 | 0.607 | 0.886 | 0.747 |
Download Data |
Period Mean (original grids) [Pg] |
Model Period Mean (intersection) [Pg] |
Model Period Mean (complement) [Pg] |
Benchmark Period Mean (intersection) [Pg] |
Benchmark Period Mean (complement) [Pg] |
Bias [kg m-2] |
Bias Score [1] |
Spatial Distribution Score [1] |
Overall Score [1] |
|||
|---|---|---|---|---|---|---|---|---|---|---|---|---|
| Benchmark | [-] | 13.7 | ||||||||||
| Control | [-] | 11.6 | 3.80 | 7.13 | 13.6 | 0.0402 | -1.33 | 0.446 | 0.655 | 0.550 | ||
| LMBIRCH | [-] | 11.6 | 3.75 | 7.21 | 13.6 | 0.0402 | -1.34 | 0.444 | 0.645 | 0.545 | ||
| LMBIRCH2 | [-] | 12.8 | 4.41 | 7.72 | 13.6 | 0.0402 | -1.20 | 0.463 | 0.642 | 0.553 | ||
| LUNA3 | [-] | 11.2 | 3.70 | 6.94 | 13.6 | 0.0402 | -1.35 | 0.443 | 0.647 | 0.545 |
Download Data |
Period Mean (original grids) [Pg] |
Model Period Mean (intersection) [Pg] |
Model Period Mean (complement) [Pg] |
Benchmark Period Mean (intersection) [Pg] |
Benchmark Period Mean (complement) [Pg] |
Bias [kg m-2] |
Bias Score [1] |
Spatial Distribution Score [1] |
Overall Score [1] |
|||
|---|---|---|---|---|---|---|---|---|---|---|---|---|
| Benchmark | [-] | 352. | ||||||||||
| Control | [-] | 519. | 318. | 202. | 349. | 2.09 | 0.510 | 0.629 | 0.835 | 0.732 | ||
| LMBIRCH | [-] | 459. | 315. | 143. | 349. | 2.09 | 0.464 | 0.630 | 0.839 | 0.735 | ||
| LMBIRCH2 | [-] | 549. | 346. | 202. | 349. | 2.09 | 0.984 | 0.618 | 0.807 | 0.712 | ||
| LUNA3 | [-] | 413. | 310. | 102. | 349. | 2.09 | 0.380 | 0.630 | 0.840 | 0.735 |
Download Data |
Period Mean (original grids) [Pg] |
Model Period Mean (intersection) [Pg] |
Model Period Mean (complement) [Pg] |
Benchmark Period Mean (intersection) [Pg] |
Benchmark Period Mean (complement) [Pg] |
Bias [kg m-2] |
Bias Score [1] |
Spatial Distribution Score [1] |
Overall Score [1] |
|||
|---|---|---|---|---|---|---|---|---|---|---|---|---|
| Benchmark | [-] | 2.53 | ||||||||||
| Control | [-] | 1.95 | 0.247 | 1.60 | 2.53 | 5.07e-05 | -0.977 | 0.397 | 0.0251 | 0.211 | ||
| LMBIRCH | [-] | 2.21 | 0.243 | 1.87 | 2.53 | 5.07e-05 | -0.980 | 0.396 | 0.0238 | 0.210 | ||
| LMBIRCH2 | [-] | 2.28 | 0.255 | 1.91 | 2.53 | 5.07e-05 | -0.973 | 0.398 | 0.0234 | 0.211 | ||
| LUNA3 | [-] | 1.90 | 0.243 | 1.57 | 2.53 | 5.07e-05 | -0.980 | 0.396 | 0.0237 | 0.210 |
Download Data |
Period Mean (original grids) [Pg] |
Model Period Mean (intersection) [Pg] |
Model Period Mean (complement) [Pg] |
Benchmark Period Mean (intersection) [Pg] |
Benchmark Period Mean (complement) [Pg] |
Bias [kg m-2] |
Bias Score [1] |
Spatial Distribution Score [1] |
Overall Score [1] |
|||
|---|---|---|---|---|---|---|---|---|---|---|---|---|
| Benchmark | [-] | 11.1 | ||||||||||
| Control | [-] | 10.6 | 8.71 | 1.21 | 11.0 | 0.0920 | 1.08 | 0.616 | 0.819 | 0.717 | ||
| LMBIRCH | [-] | 10.5 | 8.67 | 1.19 | 11.0 | 0.0920 | 1.04 | 0.615 | 0.824 | 0.720 | ||
| LMBIRCH2 | [-] | 11.1 | 9.07 | 1.27 | 11.0 | 0.0920 | 1.28 | 0.612 | 0.796 | 0.704 | ||
| LUNA3 | [-] | 10.4 | 8.56 | 1.19 | 11.0 | 0.0920 | 1.01 | 0.615 | 0.822 | 0.719 |
Download Data |
Period Mean (original grids) [Pg] |
Model Period Mean (intersection) [Pg] |
Model Period Mean (complement) [Pg] |
Benchmark Period Mean (intersection) [Pg] |
Benchmark Period Mean (complement) [Pg] |
Bias [kg m-2] |
Bias Score [1] |
Spatial Distribution Score [1] |
Overall Score [1] |
|||
|---|---|---|---|---|---|---|---|---|---|---|---|---|
| Benchmark | [-] | 1.55 | ||||||||||
| Control | [-] | 13.4 | 1.48 | 11.7 | 1.54 | 0.00901 | 0.919 | 0.589 | 0.689 | 0.639 | ||
| LMBIRCH | [-] | 14.6 | 1.42 | 12.9 | 1.54 | 0.00901 | 0.754 | 0.638 | 0.774 | 0.706 | ||
| LMBIRCH2 | [-] | 19.7 | 2.75 | 16.6 | 1.54 | 0.00901 | 2.79 | 0.561 | 0.657 | 0.609 | ||
| LUNA3 | [-] | 9.60 | 1.03 | 8.37 | 1.54 | 0.00901 | 0.215 | 0.583 | 0.745 | 0.664 |
Download Data |
Period Mean (original grids) [Pg] |
Model Period Mean (intersection) [Pg] |
Model Period Mean (complement) [Pg] |
Benchmark Period Mean (intersection) [Pg] |
Benchmark Period Mean (complement) [Pg] |
Bias [kg m-2] |
Bias Score [1] |
Spatial Distribution Score [1] |
Overall Score [1] |
|||
|---|---|---|---|---|---|---|---|---|---|---|---|---|
| Benchmark | [-] | 0.219 | ||||||||||
| Control | [-] | 3.43 | 0.102 | 3.51 | 0.219 | -0.350 | 0.479 | 0.137 | 0.308 | |||
| LMBIRCH | [-] | 2.88 | 0.116 | 2.90 | 0.219 | -0.303 | 0.501 | 0.130 | 0.315 | |||
| LMBIRCH2 | [-] | 3.52 | 0.129 | 3.63 | 0.219 | -0.264 | 0.513 | 0.204 | 0.358 | |||
| LUNA3 | [-] | 2.31 | 0.0952 | 2.38 | 0.219 | -0.372 | 0.474 | 0.114 | 0.294 |
Download Data |
Period Mean (original grids) [Pg] |
Model Period Mean (intersection) [Pg] |
Model Period Mean (complement) [Pg] |
Benchmark Period Mean (intersection) [Pg] |
Benchmark Period Mean (complement) [Pg] |
Bias [kg m-2] |
Bias Score [1] |
Spatial Distribution Score [1] |
Overall Score [1] |
|||
|---|---|---|---|---|---|---|---|---|---|---|---|---|
| Benchmark | [-] | 100. | ||||||||||
| Control | [-] | 132. | 131. | 0.898 | 100. | 0.0486 | 4.18 | 0.690 | 0.915 | 0.802 | ||
| LMBIRCH | [-] | 131. | 130. | 0.894 | 100. | 0.0486 | 4.12 | 0.692 | 0.915 | 0.804 | ||
| LMBIRCH2 | [-] | 140. | 139. | 0.952 | 100. | 0.0486 | 5.12 | 0.660 | 0.900 | 0.780 | ||
| LUNA3 | [-] | 131. | 130. | 0.894 | 100. | 0.0486 | 4.12 | 0.692 | 0.915 | 0.804 |
Download Data |
Period Mean (original grids) [Pg] |
Model Period Mean (intersection) [Pg] |
Model Period Mean (complement) [Pg] |
Benchmark Period Mean (intersection) [Pg] |
Benchmark Period Mean (complement) [Pg] |
Bias [kg m-2] |
Bias Score [1] |
Spatial Distribution Score [1] |
Overall Score [1] |
|||
|---|---|---|---|---|---|---|---|---|---|---|---|---|
| Benchmark | [-] | 18.4 | ||||||||||
| Control | [-] | 25.1 | 24.1 | 0.431 | 18.4 | 0.0435 | 1.14 | 0.507 | 0.580 | 0.544 | ||
| LMBIRCH | [-] | 24.5 | 23.6 | 0.420 | 18.4 | 0.0435 | 1.05 | 0.520 | 0.597 | 0.559 | ||
| LMBIRCH2 | [-] | 27.6 | 26.8 | 0.461 | 18.4 | 0.0435 | 1.56 | 0.515 | 0.570 | 0.543 | ||
| LUNA3 | [-] | 23.9 | 23.0 | 0.418 | 18.4 | 0.0435 | 0.970 | 0.522 | 0.598 | 0.560 |
Download Data |
Period Mean (original grids) [Pg] |
Model Period Mean (intersection) [Pg] |
Model Period Mean (complement) [Pg] |
Benchmark Period Mean (intersection) [Pg] |
Benchmark Period Mean (complement) [Pg] |
Bias [kg m-2] |
Bias Score [1] |
Spatial Distribution Score [1] |
Overall Score [1] |
|||
|---|---|---|---|---|---|---|---|---|---|---|---|---|
| Benchmark | [-] | 7.28 | ||||||||||
| Control | [-] | 8.21 | 7.41 | 0.169 | 7.14 | 0.137 | 0.837 | 0.537 | 0.546 | 0.542 | ||
| LMBIRCH | [-] | 8.29 | 7.53 | 0.164 | 7.14 | 0.137 | 0.749 | 0.555 | 0.605 | 0.580 | ||
| LMBIRCH2 | [-] | 9.59 | 8.73 | 0.190 | 7.14 | 0.137 | 1.35 | 0.509 | 0.481 | 0.495 | ||
| LUNA3 | [-] | 7.14 | 6.40 | 0.137 | 7.14 | 0.137 | 0.262 | 0.572 | 0.644 | 0.608 |
Temporally integrated period mean