Mean State
Download Data |
Period Mean (original grids) [Pg yr-1] |
Model Period Mean (intersection) [Pg yr-1] |
Model Period Mean (complement) [Pg yr-1] |
Benchmark Period Mean (intersection) [Pg yr-1] |
Benchmark Period Mean (complement) [Pg yr-1] |
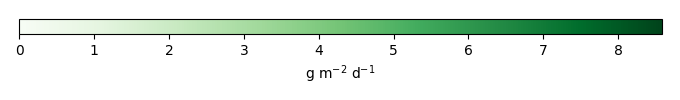
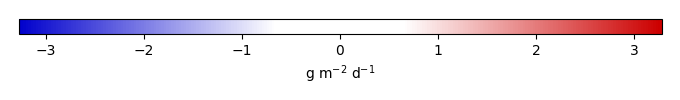
Bias [g m-2 d-1] |
RMSE [g m-2 d-1] |
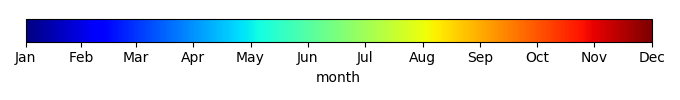
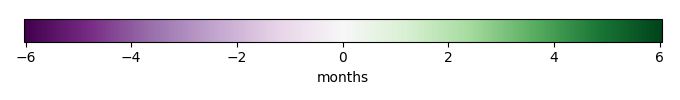
Phase Shift [months] |
Bias Score [1] |
RMSE Score [1] |
Seasonal Cycle Score [1] |
Spatial Distribution Score [1] |
Overall Score [1] |
|||
|---|---|---|---|---|---|---|---|---|---|---|---|---|---|---|---|---|
| Benchmark | [-] | 8.19 | ||||||||||||||
| Control | [-] | 7.87 | 6.82 | 0.362 | 8.19 | 0.000184 | -0.566 | 1.67 | 2.20 | 0.327 | 0.271 | 0.587 | 0.969 | 0.485 | ||
| LMBIRCH | [-] | 7.86 | 6.82 | 0.362 | 8.19 | 0.000184 | -0.567 | 1.66 | 2.20 | 0.327 | 0.272 | 0.587 | 0.969 | 0.485 | ||
| LMBIRCH2 | [-] | 8.35 | 7.21 | 0.368 | 8.19 | 0.000184 | -0.308 | 1.65 | 2.14 | 0.363 | 0.254 | 0.604 | 0.980 | 0.491 | ||
| LUNA3 | [-] | 7.86 | 6.82 | 0.362 | 8.19 | 0.000184 | -0.567 | 1.66 | 2.20 | 0.327 | 0.272 | 0.587 | 0.969 | 0.485 |
Download Data |
Period Mean (original grids) [Pg yr-1] |
Model Period Mean (intersection) [Pg yr-1] |
Model Period Mean (complement) [Pg yr-1] |
Benchmark Period Mean (intersection) [Pg yr-1] |
Benchmark Period Mean (complement) [Pg yr-1] |
Bias [g m-2 d-1] |
RMSE [g m-2 d-1] |
Phase Shift [months] |
Bias Score [1] |
RMSE Score [1] |
Seasonal Cycle Score [1] |
Spatial Distribution Score [1] |
Overall Score [1] |
|||
|---|---|---|---|---|---|---|---|---|---|---|---|---|---|---|---|---|
| Benchmark | [-] | 5.55 | ||||||||||||||
| Control | [-] | 4.50 | 4.92 | 0.0552 | 5.55 | -0.217 | 1.77 | 1.60 | 0.561 | 0.414 | 0.725 | 0.819 | 0.586 | |||
| LMBIRCH | [-] | 4.60 | 5.02 | 0.0550 | 5.55 | -0.178 | 1.74 | 1.64 | 0.577 | 0.417 | 0.716 | 0.827 | 0.591 | |||
| LMBIRCH2 | [-] | 4.17 | 4.62 | 0.0565 | 5.55 | -0.334 | 1.93 | 1.59 | 0.488 | 0.406 | 0.726 | 0.879 | 0.581 | |||
| LUNA3 | [-] | 4.60 | 5.02 | 0.0550 | 5.55 | -0.178 | 1.74 | 1.64 | 0.577 | 0.417 | 0.716 | 0.827 | 0.591 |
Download Data |
Period Mean (original grids) [Pg yr-1] |
Model Period Mean (intersection) [Pg yr-1] |
Model Period Mean (complement) [Pg yr-1] |
Benchmark Period Mean (intersection) [Pg yr-1] |
Benchmark Period Mean (complement) [Pg yr-1] |
Bias [g m-2 d-1] |
RMSE [g m-2 d-1] |
Phase Shift [months] |
Bias Score [1] |
RMSE Score [1] |
Seasonal Cycle Score [1] |
Spatial Distribution Score [1] |
Overall Score [1] |
|||
|---|---|---|---|---|---|---|---|---|---|---|---|---|---|---|---|---|
| Benchmark | [-] | 9.94 | ||||||||||||||
| Control | [-] | 6.87 | 6.38 | 0.493 | 9.93 | 0.00241 | -0.821 | 2.14 | 1.38 | 0.373 | 0.372 | 0.827 | 0.907 | 0.570 | ||
| LMBIRCH | [-] | 6.83 | 6.35 | 0.480 | 9.93 | 0.00241 | -0.834 | 2.14 | 1.38 | 0.374 | 0.373 | 0.831 | 0.907 | 0.572 | ||
| LMBIRCH2 | [-] | 7.36 | 6.88 | 0.517 | 9.93 | 0.00241 | -0.660 | 2.09 | 1.64 | 0.389 | 0.365 | 0.764 | 0.908 | 0.558 | ||
| LUNA3 | [-] | 6.82 | 6.34 | 0.480 | 9.93 | 0.00241 | -0.835 | 2.14 | 1.38 | 0.374 | 0.373 | 0.831 | 0.907 | 0.572 |
Download Data |
Period Mean (original grids) [Pg yr-1] |
Model Period Mean (intersection) [Pg yr-1] |
Model Period Mean (complement) [Pg yr-1] |
Benchmark Period Mean (intersection) [Pg yr-1] |
Benchmark Period Mean (complement) [Pg yr-1] |
Bias [g m-2 d-1] |
RMSE [g m-2 d-1] |
Phase Shift [months] |
Bias Score [1] |
RMSE Score [1] |
Seasonal Cycle Score [1] |
Spatial Distribution Score [1] |
Overall Score [1] |
|||
|---|---|---|---|---|---|---|---|---|---|---|---|---|---|---|---|---|
| Benchmark | [-] | 1.03 | ||||||||||||||
| Control | [-] | 1.65 | 1.54 | 0.0907 | 1.03 | 0.00177 | 0.586 | 2.01 | 0.160 | 0.555 | 0.369 | 0.990 | 0.549 | 0.566 | ||
| LMBIRCH | [-] | 0.344 | 0.330 | 0.0203 | 1.03 | 0.00177 | -0.562 | 1.06 | 0.220 | 0.625 | 0.509 | 0.979 | 0.704 | 0.666 | ||
| LMBIRCH2 | [-] | 0.730 | 0.684 | 0.0526 | 1.03 | 0.00177 | -0.200 | 1.14 | 0.142 | 0.670 | 0.500 | 0.987 | 0.772 | 0.686 | ||
| LUNA3 | [-] | 0.702 | 0.665 | 0.0332 | 1.03 | 0.00177 | -0.257 | 1.02 | 0.753 | 0.696 | 0.530 | 0.907 | 0.876 | 0.708 |
Download Data |
Period Mean (original grids) [Pg yr-1] |
Model Period Mean (intersection) [Pg yr-1] |
Model Period Mean (complement) [Pg yr-1] |
Benchmark Period Mean (intersection) [Pg yr-1] |
Benchmark Period Mean (complement) [Pg yr-1] |
Bias [g m-2 d-1] |
RMSE [g m-2 d-1] |
Phase Shift [months] |
Bias Score [1] |
RMSE Score [1] |
Seasonal Cycle Score [1] |
Spatial Distribution Score [1] |
Overall Score [1] |
|||
|---|---|---|---|---|---|---|---|---|---|---|---|---|---|---|---|---|
| Benchmark | [-] | 7.13 | ||||||||||||||
| Control | [-] | 6.32 | 4.81 | 1.26 | 7.07 | 0.0686 | 0.502 | 2.27 | 1.86 | 0.114 | 0.180 | 0.748 | 0.211 | 0.287 | ||
| LMBIRCH | [-] | 6.31 | 4.80 | 1.26 | 7.07 | 0.0686 | 0.494 | 2.27 | 1.88 | 0.113 | 0.181 | 0.743 | 0.211 | 0.286 | ||
| LMBIRCH2 | [-] | 6.49 | 4.95 | 1.29 | 7.07 | 0.0686 | 0.687 | 2.25 | 1.90 | 0.130 | 0.173 | 0.740 | 0.230 | 0.289 | ||
| LUNA3 | [-] | 6.31 | 4.80 | 1.26 | 7.07 | 0.0686 | 0.494 | 2.27 | 1.88 | 0.113 | 0.181 | 0.743 | 0.211 | 0.286 |
Download Data |
Period Mean (original grids) [Pg yr-1] |
Model Period Mean (intersection) [Pg yr-1] |
Model Period Mean (complement) [Pg yr-1] |
Benchmark Period Mean (intersection) [Pg yr-1] |
Benchmark Period Mean (complement) [Pg yr-1] |
Bias [g m-2 d-1] |
RMSE [g m-2 d-1] |
Phase Shift [months] |
Bias Score [1] |
RMSE Score [1] |
Seasonal Cycle Score [1] |
Spatial Distribution Score [1] |
Overall Score [1] |
|||
|---|---|---|---|---|---|---|---|---|---|---|---|---|---|---|---|---|
| Benchmark | [-] | 6.86 | ||||||||||||||
| Control | [-] | 7.78 | 7.47 | 0.123 | 6.85 | 0.00298 | 0.237 | 1.42 | 0.488 | 0.779 | 0.649 | 0.966 | 0.818 | 0.772 | ||
| LMBIRCH | [-] | 5.56 | 5.33 | 0.0864 | 6.85 | 0.00298 | -0.428 | 1.30 | 0.553 | 0.770 | 0.663 | 0.963 | 0.960 | 0.804 | ||
| LMBIRCH2 | [-] | 7.69 | 7.37 | 0.130 | 6.85 | 0.00298 | 0.211 | 1.40 | 0.731 | 0.788 | 0.650 | 0.952 | 0.862 | 0.780 | ||
| LUNA3 | [-] | 4.16 | 3.97 | 0.0643 | 6.85 | 0.00298 | -0.851 | 1.67 | 0.251 | 0.691 | 0.594 | 0.981 | 0.945 | 0.761 |
Download Data |
Period Mean (original grids) [Pg yr-1] |
Model Period Mean (intersection) [Pg yr-1] |
Model Period Mean (complement) [Pg yr-1] |
Benchmark Period Mean (intersection) [Pg yr-1] |
Benchmark Period Mean (complement) [Pg yr-1] |
Bias [g m-2 d-1] |
RMSE [g m-2 d-1] |
Phase Shift [months] |
Bias Score [1] |
RMSE Score [1] |
Seasonal Cycle Score [1] |
Spatial Distribution Score [1] |
Overall Score [1] |
|||
|---|---|---|---|---|---|---|---|---|---|---|---|---|---|---|---|---|
| Benchmark | [-] | 10.1 | ||||||||||||||
| Control | [-] | 11.1 | 10.7 | 0.474 | 10.1 | 0.00384 | 0.232 | 1.27 | 1.05 | 0.717 | 0.549 | 0.929 | 0.954 | 0.740 | ||
| LMBIRCH | [-] | 10.3 | 9.97 | 0.444 | 10.1 | 0.00384 | 0.104 | 1.21 | 1.07 | 0.707 | 0.544 | 0.927 | 0.950 | 0.734 | ||
| LMBIRCH2 | [-] | 12.0 | 11.6 | 0.524 | 10.1 | 0.00384 | 0.372 | 1.34 | 1.08 | 0.736 | 0.526 | 0.924 | 0.958 | 0.734 | ||
| LUNA3 | [-] | 10.1 | 9.76 | 0.420 | 10.1 | 0.00384 | 0.0623 | 1.22 | 1.06 | 0.689 | 0.557 | 0.928 | 0.931 | 0.732 |
Download Data |
Period Mean (original grids) [Pg yr-1] |
Model Period Mean (intersection) [Pg yr-1] |
Model Period Mean (complement) [Pg yr-1] |
Benchmark Period Mean (intersection) [Pg yr-1] |
Benchmark Period Mean (complement) [Pg yr-1] |
Bias [g m-2 d-1] |
RMSE [g m-2 d-1] |
Phase Shift [months] |
Bias Score [1] |
RMSE Score [1] |
Seasonal Cycle Score [1] |
Spatial Distribution Score [1] |
Overall Score [1] |
|||
|---|---|---|---|---|---|---|---|---|---|---|---|---|---|---|---|---|
| Benchmark | [-] | 8.37 | ||||||||||||||
| Control | [-] | 7.28 | 6.23 | 0.685 | 8.36 | 0.00440 | -0.185 | 2.10 | 2.93 | 0.467 | 0.363 | 0.543 | 0.948 | 0.537 | ||
| LMBIRCH | [-] | 7.19 | 6.15 | 0.678 | 8.36 | 0.00440 | -0.220 | 2.08 | 2.94 | 0.464 | 0.362 | 0.543 | 0.948 | 0.536 | ||
| LMBIRCH2 | [-] | 7.60 | 6.49 | 0.707 | 8.36 | 0.00440 | -0.0654 | 2.15 | 2.97 | 0.480 | 0.351 | 0.546 | 0.949 | 0.535 | ||
| LUNA3 | [-] | 7.16 | 6.12 | 0.678 | 8.36 | 0.00440 | -0.230 | 2.08 | 2.90 | 0.461 | 0.366 | 0.549 | 0.948 | 0.538 |
Download Data |
Period Mean (original grids) [Pg yr-1] |
Model Period Mean (intersection) [Pg yr-1] |
Model Period Mean (complement) [Pg yr-1] |
Benchmark Period Mean (intersection) [Pg yr-1] |
Benchmark Period Mean (complement) [Pg yr-1] |
Bias [g m-2 d-1] |
RMSE [g m-2 d-1] |
Phase Shift [months] |
Bias Score [1] |
RMSE Score [1] |
Seasonal Cycle Score [1] |
Spatial Distribution Score [1] |
Overall Score [1] |
|||
|---|---|---|---|---|---|---|---|---|---|---|---|---|---|---|---|---|
| Benchmark | [-] | 1.28 | ||||||||||||||
| Control | [-] | 2.12 | 2.19 | 0.0550 | 1.28 | 0.000152 | 0.777 | 2.05 | 0.175 | 0.640 | 0.383 | 0.993 | 0.865 | 0.653 | ||
| LMBIRCH | [-] | 0.529 | 0.584 | 0.00944 | 1.28 | 0.000152 | -0.541 | 1.01 | 0.173 | 0.685 | 0.576 | 0.991 | 0.900 | 0.745 | ||
| LMBIRCH2 | [-] | 1.15 | 1.22 | 0.0295 | 1.28 | 0.000152 | -0.0164 | 1.10 | 0.159 | 0.749 | 0.537 | 0.991 | 0.786 | 0.720 | ||
| LUNA3 | [-] | 0.654 | 0.687 | 0.0125 | 1.28 | 0.000152 | -0.458 | 1.05 | 0.552 | 0.689 | 0.551 | 0.965 | 0.758 | 0.703 |
Download Data |
Period Mean (original grids) [Pg yr-1] |
Model Period Mean (intersection) [Pg yr-1] |
Model Period Mean (complement) [Pg yr-1] |
Benchmark Period Mean (intersection) [Pg yr-1] |
Benchmark Period Mean (complement) [Pg yr-1] |
Bias [g m-2 d-1] |
RMSE [g m-2 d-1] |
Phase Shift [months] |
Bias Score [1] |
RMSE Score [1] |
Seasonal Cycle Score [1] |
Spatial Distribution Score [1] |
Overall Score [1] |
|||
|---|---|---|---|---|---|---|---|---|---|---|---|---|---|---|---|---|
| Benchmark | [-] | 3.53 | ||||||||||||||
| Control | [-] | 4.96 | 4.21 | 0.622 | 3.51 | 0.0139 | 0.613 | 1.32 | 2.06 | 0.438 | 0.249 | 0.820 | 0.810 | 0.513 | ||
| LMBIRCH | [-] | 4.78 | 4.11 | 0.563 | 3.51 | 0.0139 | 0.555 | 1.28 | 2.09 | 0.444 | 0.263 | 0.820 | 0.847 | 0.528 | ||
| LMBIRCH2 | [-] | 4.97 | 4.20 | 0.638 | 3.51 | 0.0139 | 0.615 | 1.32 | 2.08 | 0.430 | 0.249 | 0.823 | 0.790 | 0.508 | ||
| LUNA3 | [-] | 4.75 | 4.07 | 0.557 | 3.51 | 0.0139 | 0.542 | 1.28 | 2.08 | 0.444 | 0.266 | 0.821 | 0.849 | 0.529 |
Download Data |
Period Mean (original grids) [Pg yr-1] |
Model Period Mean (intersection) [Pg yr-1] |
Model Period Mean (complement) [Pg yr-1] |
Benchmark Period Mean (intersection) [Pg yr-1] |
Benchmark Period Mean (complement) [Pg yr-1] |
Bias [g m-2 d-1] |
RMSE [g m-2 d-1] |
Phase Shift [months] |
Bias Score [1] |
RMSE Score [1] |
Seasonal Cycle Score [1] |
Spatial Distribution Score [1] |
Overall Score [1] |
|||
|---|---|---|---|---|---|---|---|---|---|---|---|---|---|---|---|---|
| Benchmark | [-] | 5.29 | ||||||||||||||
| Control | [-] | 5.10 | 4.72 | 0.352 | 5.28 | 0.00340 | 0.244 | 1.80 | 0.330 | 0.725 | 0.575 | 0.980 | 0.769 | 0.725 | ||
| LMBIRCH | [-] | 3.58 | 3.33 | 0.251 | 5.28 | 0.00340 | -0.609 | 1.63 | 0.365 | 0.651 | 0.603 | 0.979 | 0.791 | 0.725 | ||
| LMBIRCH2 | [-] | 5.07 | 4.71 | 0.346 | 5.28 | 0.00340 | 0.228 | 1.68 | 0.387 | 0.755 | 0.577 | 0.977 | 0.915 | 0.760 | ||
| LUNA3 | [-] | 3.22 | 3.00 | 0.232 | 5.28 | 0.00340 | -0.803 | 1.74 | 0.318 | 0.609 | 0.591 | 0.981 | 0.770 | 0.708 |
Download Data |
Period Mean (original grids) [Pg yr-1] |
Model Period Mean (intersection) [Pg yr-1] |
Model Period Mean (complement) [Pg yr-1] |
Benchmark Period Mean (intersection) [Pg yr-1] |
Benchmark Period Mean (complement) [Pg yr-1] |
Bias [g m-2 d-1] |
RMSE [g m-2 d-1] |
Phase Shift [months] |
Bias Score [1] |
RMSE Score [1] |
Seasonal Cycle Score [1] |
Spatial Distribution Score [1] |
Overall Score [1] |
|||
|---|---|---|---|---|---|---|---|---|---|---|---|---|---|---|---|---|
| Benchmark | [-] | 119. | ||||||||||||||
| Control | [-] | 120. | 110. | 9.41 | 118. | 0.413 | 0.139 | 1.66 | 1.35 | 0.435 | 0.383 | 0.783 | 0.938 | 0.584 | ||
| LMBIRCH | [-] | 107. | 98.8 | 8.63 | 118. | 0.413 | -0.138 | 1.48 | 1.38 | 0.437 | 0.397 | 0.782 | 0.949 | 0.592 | ||
| LMBIRCH2 | [-] | 122. | 112. | 9.68 | 118. | 0.413 | 0.177 | 1.61 | 1.41 | 0.447 | 0.376 | 0.776 | 0.951 | 0.585 | ||
| LUNA3 | [-] | 104. | 95.7 | 8.48 | 118. | 0.413 | -0.212 | 1.51 | 1.42 | 0.426 | 0.394 | 0.782 | 0.946 | 0.588 |
Download Data |
Period Mean (original grids) [Pg yr-1] |
Model Period Mean (intersection) [Pg yr-1] |
Model Period Mean (complement) [Pg yr-1] |
Benchmark Period Mean (intersection) [Pg yr-1] |
Benchmark Period Mean (complement) [Pg yr-1] |
Bias [g m-2 d-1] |
RMSE [g m-2 d-1] |
Phase Shift [months] |
Bias Score [1] |
RMSE Score [1] |
Seasonal Cycle Score [1] |
Spatial Distribution Score [1] |
Overall Score [1] |
|||
|---|---|---|---|---|---|---|---|---|---|---|---|---|---|---|---|---|
| Benchmark | [-] | 0.864 | ||||||||||||||
| Control | [-] | 1.81 | 1.53 | 0.170 | 0.864 | 0.000161 | 0.309 | 0.729 | 2.31 | 0.431 | 0.237 | 0.868 | 0.825 | 0.519 | ||
| LMBIRCH | [-] | 1.58 | 1.33 | 0.150 | 0.864 | 0.000161 | 0.233 | 0.641 | 2.32 | 0.445 | 0.277 | 0.867 | 0.848 | 0.543 | ||
| LMBIRCH2 | [-] | 1.99 | 1.68 | 0.190 | 0.864 | 0.000161 | 0.365 | 0.799 | 2.33 | 0.411 | 0.217 | 0.862 | 0.791 | 0.500 | ||
| LUNA3 | [-] | 1.56 | 1.31 | 0.148 | 0.864 | 0.000161 | 0.226 | 0.640 | 2.31 | 0.442 | 0.278 | 0.867 | 0.847 | 0.542 |
Download Data |
Period Mean (original grids) [Pg yr-1] |
Model Period Mean (intersection) [Pg yr-1] |
Model Period Mean (complement) [Pg yr-1] |
Benchmark Period Mean (intersection) [Pg yr-1] |
Benchmark Period Mean (complement) [Pg yr-1] |
Bias [g m-2 d-1] |
RMSE [g m-2 d-1] |
Phase Shift [months] |
Bias Score [1] |
RMSE Score [1] |
Seasonal Cycle Score [1] |
Spatial Distribution Score [1] |
Overall Score [1] |
|||
|---|---|---|---|---|---|---|---|---|---|---|---|---|---|---|---|---|
| Benchmark | [-] | 1.56 | ||||||||||||||
| Control | [-] | 3.13 | 2.94 | 0.122 | 1.56 | 0.000579 | 0.683 | 1.61 | 0.496 | 0.455 | 0.301 | 0.977 | 0.535 | 0.514 | ||
| LMBIRCH | [-] | 1.17 | 1.09 | 0.0384 | 1.56 | 0.000579 | -0.154 | 0.528 | 0.663 | 0.730 | 0.612 | 0.973 | 0.936 | 0.773 | ||
| LMBIRCH2 | [-] | 2.42 | 2.25 | 0.0966 | 1.56 | 0.000579 | 0.395 | 1.12 | 0.632 | 0.548 | 0.383 | 0.974 | 0.596 | 0.577 | ||
| LUNA3 | [-] | 1.15 | 1.08 | 0.0280 | 1.56 | 0.000579 | -0.173 | 0.622 | 1.68 | 0.699 | 0.560 | 0.924 | 0.922 | 0.733 |
Download Data |
Period Mean (original grids) [Pg yr-1] |
Model Period Mean (intersection) [Pg yr-1] |
Model Period Mean (complement) [Pg yr-1] |
Benchmark Period Mean (intersection) [Pg yr-1] |
Benchmark Period Mean (complement) [Pg yr-1] |
Bias [g m-2 d-1] |
RMSE [g m-2 d-1] |
Phase Shift [months] |
Bias Score [1] |
RMSE Score [1] |
Seasonal Cycle Score [1] |
Spatial Distribution Score [1] |
Overall Score [1] |
|||
|---|---|---|---|---|---|---|---|---|---|---|---|---|---|---|---|---|
| Benchmark | [-] | 3.62 | ||||||||||||||
| Control | [-] | 3.23 | 2.43 | 0.621 | 3.60 | 0.0206 | 0.103 | 1.97 | 1.72 | 0.354 | 0.342 | 0.769 | 0.940 | 0.549 | ||
| LMBIRCH | [-] | 3.22 | 2.43 | 0.620 | 3.60 | 0.0206 | 0.0990 | 1.94 | 1.73 | 0.355 | 0.346 | 0.771 | 0.942 | 0.552 | ||
| LMBIRCH2 | [-] | 3.37 | 2.55 | 0.641 | 3.60 | 0.0206 | 0.242 | 1.97 | 1.62 | 0.369 | 0.335 | 0.779 | 0.940 | 0.552 | ||
| LUNA3 | [-] | 3.21 | 2.42 | 0.620 | 3.60 | 0.0206 | 0.0861 | 1.95 | 1.73 | 0.352 | 0.345 | 0.771 | 0.941 | 0.551 |
Download Data |
Period Mean (original grids) [Pg yr-1] |
Model Period Mean (intersection) [Pg yr-1] |
Model Period Mean (complement) [Pg yr-1] |
Benchmark Period Mean (intersection) [Pg yr-1] |
Benchmark Period Mean (complement) [Pg yr-1] |
Bias [g m-2 d-1] |
RMSE [g m-2 d-1] |
Phase Shift [months] |
Bias Score [1] |
RMSE Score [1] |
Seasonal Cycle Score [1] |
Spatial Distribution Score [1] |
Overall Score [1] |
|||
|---|---|---|---|---|---|---|---|---|---|---|---|---|---|---|---|---|
| Benchmark | [-] | 5.09 | ||||||||||||||
| Control | [-] | 4.79 | 4.55 | 0.219 | 5.09 | 0.00139 | -0.0919 | 1.79 | 0.675 | 0.741 | 0.622 | 0.942 | 0.916 | 0.768 | ||
| LMBIRCH | [-] | 4.64 | 4.42 | 0.196 | 5.09 | 0.00139 | -0.207 | 1.85 | 0.670 | 0.727 | 0.605 | 0.942 | 0.888 | 0.753 | ||
| LMBIRCH2 | [-] | 5.60 | 5.31 | 0.249 | 5.09 | 0.00139 | 0.466 | 1.85 | 0.680 | 0.799 | 0.585 | 0.942 | 0.960 | 0.774 | ||
| LUNA3 | [-] | 4.15 | 3.95 | 0.184 | 5.09 | 0.00139 | -0.541 | 1.93 | 0.621 | 0.669 | 0.615 | 0.945 | 0.890 | 0.747 |
Download Data |
Period Mean (original grids) [Pg yr-1] |
Model Period Mean (intersection) [Pg yr-1] |
Model Period Mean (complement) [Pg yr-1] |
Benchmark Period Mean (intersection) [Pg yr-1] |
Benchmark Period Mean (complement) [Pg yr-1] |
Bias [g m-2 d-1] |
RMSE [g m-2 d-1] |
Phase Shift [months] |
Bias Score [1] |
RMSE Score [1] |
Seasonal Cycle Score [1] |
Spatial Distribution Score [1] |
Overall Score [1] |
|||
|---|---|---|---|---|---|---|---|---|---|---|---|---|---|---|---|---|
| Benchmark | [-] | 3.36 | ||||||||||||||
| Control | [-] | 5.20 | 5.13 | 0.121 | 3.35 | 0.00765 | 1.11 | 1.90 | 0.483 | 0.590 | 0.524 | 0.968 | 0.937 | 0.709 | ||
| LMBIRCH | [-] | 3.84 | 3.78 | 0.0914 | 3.35 | 0.00765 | 0.358 | 1.26 | 0.502 | 0.690 | 0.624 | 0.968 | 0.954 | 0.772 | ||
| LMBIRCH2 | [-] | 5.31 | 5.22 | 0.135 | 3.35 | 0.00765 | 1.18 | 1.95 | 0.636 | 0.581 | 0.515 | 0.957 | 0.927 | 0.699 | ||
| LUNA3 | [-] | 2.91 | 2.87 | 0.0721 | 3.35 | 0.00765 | -0.142 | 1.18 | 0.288 | 0.701 | 0.627 | 0.981 | 0.946 | 0.776 |
Download Data |
Period Mean (original grids) [Pg yr-1] |
Model Period Mean (intersection) [Pg yr-1] |
Model Period Mean (complement) [Pg yr-1] |
Benchmark Period Mean (intersection) [Pg yr-1] |
Benchmark Period Mean (complement) [Pg yr-1] |
Bias [g m-2 d-1] |
RMSE [g m-2 d-1] |
Phase Shift [months] |
Bias Score [1] |
RMSE Score [1] |
Seasonal Cycle Score [1] |
Spatial Distribution Score [1] |
Overall Score [1] |
|||
|---|---|---|---|---|---|---|---|---|---|---|---|---|---|---|---|---|
| Benchmark | [-] | 1.79 | ||||||||||||||
| Control | [-] | 1.91 | 1.85 | 0.0257 | 1.79 | 0.000356 | 0.131 | 1.25 | 0.907 | 0.535 | 0.412 | 0.922 | 0.916 | 0.639 | ||
| LMBIRCH | [-] | 1.73 | 1.67 | 0.0204 | 1.79 | 0.000356 | -0.0121 | 1.18 | 0.924 | 0.512 | 0.436 | 0.921 | 0.883 | 0.638 | ||
| LMBIRCH2 | [-] | 1.96 | 1.90 | 0.0270 | 1.79 | 0.000356 | 0.173 | 1.28 | 0.956 | 0.530 | 0.410 | 0.917 | 0.911 | 0.636 | ||
| LUNA3 | [-] | 1.68 | 1.62 | 0.0215 | 1.79 | 0.000356 | -0.0430 | 1.21 | 0.921 | 0.501 | 0.425 | 0.921 | 0.881 | 0.631 |
Download Data |
Period Mean (original grids) [Pg yr-1] |
Model Period Mean (intersection) [Pg yr-1] |
Model Period Mean (complement) [Pg yr-1] |
Benchmark Period Mean (intersection) [Pg yr-1] |
Benchmark Period Mean (complement) [Pg yr-1] |
Bias [g m-2 d-1] |
RMSE [g m-2 d-1] |
Phase Shift [months] |
Bias Score [1] |
RMSE Score [1] |
Seasonal Cycle Score [1] |
Spatial Distribution Score [1] |
Overall Score [1] |
|||
|---|---|---|---|---|---|---|---|---|---|---|---|---|---|---|---|---|
| Benchmark | [-] | 23.2 | ||||||||||||||
| Control | [-] | 20.0 | 19.6 | 0.308 | 23.2 | 0.0155 | -0.849 | 2.01 | 2.50 | 0.128 | 0.228 | 0.610 | 0.896 | 0.418 | ||
| LMBIRCH | [-] | 20.0 | 19.6 | 0.308 | 23.2 | 0.0155 | -0.866 | 2.01 | 2.50 | 0.126 | 0.229 | 0.611 | 0.893 | 0.417 | ||
| LMBIRCH2 | [-] | 20.7 | 20.3 | 0.316 | 23.2 | 0.0155 | -0.631 | 1.91 | 2.53 | 0.146 | 0.216 | 0.605 | 0.913 | 0.419 | ||
| LUNA3 | [-] | 20.0 | 19.6 | 0.308 | 23.2 | 0.0155 | -0.866 | 2.01 | 2.50 | 0.126 | 0.229 | 0.611 | 0.893 | 0.417 |
Download Data |
Period Mean (original grids) [Pg yr-1] |
Model Period Mean (intersection) [Pg yr-1] |
Model Period Mean (complement) [Pg yr-1] |
Benchmark Period Mean (intersection) [Pg yr-1] |
Benchmark Period Mean (complement) [Pg yr-1] |
Bias [g m-2 d-1] |
RMSE [g m-2 d-1] |
Phase Shift [months] |
Bias Score [1] |
RMSE Score [1] |
Seasonal Cycle Score [1] |
Spatial Distribution Score [1] |
Overall Score [1] |
|||
|---|---|---|---|---|---|---|---|---|---|---|---|---|---|---|---|---|
| Benchmark | [-] | 10.4 | ||||||||||||||
| Control | [-] | 11.0 | 10.5 | 0.411 | 10.4 | 0.0104 | 0.257 | 2.08 | 1.09 | 0.524 | 0.453 | 0.898 | 0.835 | 0.632 | ||
| LMBIRCH | [-] | 10.5 | 10.1 | 0.359 | 10.4 | 0.0104 | 0.0588 | 2.04 | 1.12 | 0.515 | 0.462 | 0.896 | 0.841 | 0.635 | ||
| LMBIRCH2 | [-] | 11.2 | 10.8 | 0.428 | 10.4 | 0.0104 | 0.348 | 2.20 | 1.08 | 0.493 | 0.445 | 0.900 | 0.802 | 0.617 | ||
| LUNA3 | [-] | 10.4 | 10.0 | 0.358 | 10.4 | 0.0104 | 0.0276 | 2.04 | 1.12 | 0.512 | 0.464 | 0.894 | 0.836 | 0.634 |
Download Data |
Period Mean (original grids) [Pg yr-1] |
Model Period Mean (intersection) [Pg yr-1] |
Model Period Mean (complement) [Pg yr-1] |
Benchmark Period Mean (intersection) [Pg yr-1] |
Benchmark Period Mean (complement) [Pg yr-1] |
Bias [g m-2 d-1] |
RMSE [g m-2 d-1] |
Phase Shift [months] |
Bias Score [1] |
RMSE Score [1] |
Seasonal Cycle Score [1] |
Spatial Distribution Score [1] |
Overall Score [1] |
|||
|---|---|---|---|---|---|---|---|---|---|---|---|---|---|---|---|---|
| Benchmark | [-] | 1.16 | ||||||||||||||
| Control | [-] | 1.82 | 1.62 | 0.106 | 1.14 | 0.0186 | 0.706 | 1.40 | 1.49 | 0.399 | 0.379 | 0.892 | 0.880 | 0.586 | ||
| LMBIRCH | [-] | 1.67 | 1.48 | 0.0935 | 1.14 | 0.0186 | 0.545 | 1.19 | 1.41 | 0.412 | 0.432 | 0.899 | 0.888 | 0.613 | ||
| LMBIRCH2 | [-] | 2.02 | 1.81 | 0.116 | 1.14 | 0.0186 | 0.922 | 1.62 | 1.47 | 0.366 | 0.339 | 0.891 | 0.846 | 0.556 | ||
| LUNA3 | [-] | 1.59 | 1.41 | 0.0886 | 1.14 | 0.0186 | 0.452 | 1.16 | 1.43 | 0.413 | 0.436 | 0.898 | 0.883 | 0.613 |
Temporally integrated period mean