Mean State
Download Data |
Period Mean (original grids) [1] |
Model Period Mean (intersection) [1] |
Model Period Mean (complement) [1] |
Benchmark Period Mean (intersection) [1] |
Benchmark Period Mean (complement) [1] |
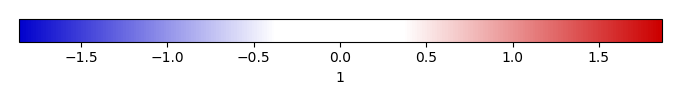
Bias [1] |
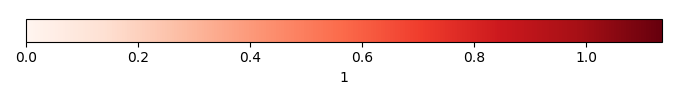
RMSE [1] |
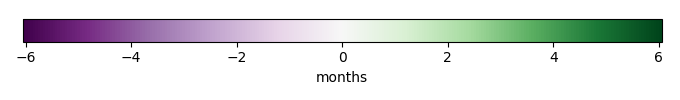
Phase Shift [months] |
Bias Score [1] |
RMSE Score [1] |
Seasonal Cycle Score [1] |
Spatial Distribution Score [1] |
Interannual Variability Score [1] |
Overall Score [1] |
|||
|---|---|---|---|---|---|---|---|---|---|---|---|---|---|---|---|---|---|
| Benchmark | [-] | 2.66 | |||||||||||||||
| Control | [-] | 2.72 | 2.71 | 2.63 | 2.66 | 0.248 | 0.0591 | 1.17 | 2.52 | 0.420 | 0.303 | 0.559 | 0.953 | 0.669 | 0.535 | ||
| LMBIRCH | [-] | 2.71 | 2.70 | 2.62 | 2.66 | 0.248 | 0.0515 | 1.17 | 2.52 | 0.420 | 0.304 | 0.559 | 0.954 | 0.671 | 0.535 | ||
| LMBIRCH2 | [-] | 3.03 | 2.99 | 2.74 | 2.66 | 0.248 | 0.332 | 1.21 | 2.48 | 0.430 | 0.287 | 0.575 | 0.946 | 0.665 | 0.532 | ||
| LUNA3 | [-] | 2.71 | 2.70 | 2.63 | 2.66 | 0.248 | 0.0517 | 1.17 | 2.52 | 0.420 | 0.304 | 0.559 | 0.954 | 0.671 | 0.535 |
Download Data |
Period Mean (original grids) [1] |
Model Period Mean (intersection) [1] |
Model Period Mean (complement) [1] |
Benchmark Period Mean (intersection) [1] |
Benchmark Period Mean (complement) [1] |
Bias [1] |
RMSE [1] |
Phase Shift [months] |
Bias Score [1] |
RMSE Score [1] |
Seasonal Cycle Score [1] |
Spatial Distribution Score [1] |
Interannual Variability Score [1] |
Overall Score [1] |
|||
|---|---|---|---|---|---|---|---|---|---|---|---|---|---|---|---|---|---|
| Benchmark | [-] | 1.13 | |||||||||||||||
| Control | [-] | 0.556 | 0.606 | 0.574 | 1.13 | 1.30 | -0.514 | 0.897 | 2.01 | 0.316 | 0.371 | 0.574 | 0.803 | 0.632 | 0.511 | ||
| LMBIRCH | [-] | 0.552 | 0.602 | 0.569 | 1.13 | 1.30 | -0.517 | 0.894 | 1.95 | 0.315 | 0.375 | 0.604 | 0.790 | 0.647 | 0.518 | ||
| LMBIRCH2 | [-] | 0.621 | 0.690 | 0.590 | 1.13 | 1.30 | -0.430 | 0.920 | 2.19 | 0.322 | 0.347 | 0.521 | 0.894 | 0.545 | 0.496 | ||
| LUNA3 | [-] | 0.552 | 0.603 | 0.571 | 1.13 | 1.30 | -0.517 | 0.894 | 1.95 | 0.315 | 0.375 | 0.604 | 0.791 | 0.648 | 0.518 |
Download Data |
Period Mean (original grids) [1] |
Model Period Mean (intersection) [1] |
Model Period Mean (complement) [1] |
Benchmark Period Mean (intersection) [1] |
Benchmark Period Mean (complement) [1] |
Bias [1] |
RMSE [1] |
Phase Shift [months] |
Bias Score [1] |
RMSE Score [1] |
Seasonal Cycle Score [1] |
Spatial Distribution Score [1] |
Interannual Variability Score [1] |
Overall Score [1] |
|||
|---|---|---|---|---|---|---|---|---|---|---|---|---|---|---|---|---|---|
| Benchmark | [-] | 1.47 | |||||||||||||||
| Control | [-] | 1.04 | 1.04 | 1.33 | 1.48 | 1.13 | -0.360 | 1.06 | 2.84 | 0.268 | 0.305 | 0.465 | 0.788 | 0.487 | 0.436 | ||
| LMBIRCH | [-] | 1.01 | 1.02 | 1.28 | 1.48 | 1.13 | -0.386 | 1.05 | 2.78 | 0.270 | 0.308 | 0.474 | 0.807 | 0.489 | 0.443 | ||
| LMBIRCH2 | [-] | 1.17 | 1.18 | 1.43 | 1.48 | 1.13 | -0.219 | 1.07 | 3.05 | 0.269 | 0.288 | 0.422 | 0.727 | 0.492 | 0.415 | ||
| LUNA3 | [-] | 1.01 | 1.02 | 1.28 | 1.48 | 1.13 | -0.388 | 1.05 | 2.78 | 0.270 | 0.308 | 0.474 | 0.807 | 0.488 | 0.443 |
Download Data |
Period Mean (original grids) [1] |
Model Period Mean (intersection) [1] |
Model Period Mean (complement) [1] |
Benchmark Period Mean (intersection) [1] |
Benchmark Period Mean (complement) [1] |
Bias [1] |
RMSE [1] |
Phase Shift [months] |
Bias Score [1] |
RMSE Score [1] |
Seasonal Cycle Score [1] |
Spatial Distribution Score [1] |
Interannual Variability Score [1] |
Overall Score [1] |
|||
|---|---|---|---|---|---|---|---|---|---|---|---|---|---|---|---|---|---|
| Benchmark | [-] | 0.882 | |||||||||||||||
| Control | [-] | 1.04 | 1.04 | 1.03 | 0.883 | 0.614 | 0.149 | 1.95 | 1.17 | 0.361 | 0.156 | 0.854 | 0.477 | 0.454 | 0.410 | ||
| LMBIRCH | [-] | 0.145 | 0.148 | 0.170 | 0.883 | 0.614 | -0.727 | 0.734 | 1.26 | 0.211 | 0.424 | 0.848 | 0.507 | 0.468 | 0.481 | ||
| LMBIRCH2 | [-] | 0.261 | 0.263 | 0.332 | 0.883 | 0.614 | -0.603 | 0.658 | 1.17 | 0.277 | 0.382 | 0.861 | 0.829 | 0.554 | 0.548 | ||
| LUNA3 | [-] | 0.394 | 0.398 | 0.299 | 0.883 | 0.614 | -0.495 | 0.828 | 1.47 | 0.348 | 0.282 | 0.827 | 0.860 | 0.596 | 0.533 |
Download Data |
Period Mean (original grids) [1] |
Model Period Mean (intersection) [1] |
Model Period Mean (complement) [1] |
Benchmark Period Mean (intersection) [1] |
Benchmark Period Mean (complement) [1] |
Bias [1] |
RMSE [1] |
Phase Shift [months] |
Bias Score [1] |
RMSE Score [1] |
Seasonal Cycle Score [1] |
Spatial Distribution Score [1] |
Interannual Variability Score [1] |
Overall Score [1] |
|||
|---|---|---|---|---|---|---|---|---|---|---|---|---|---|---|---|---|---|
| Benchmark | [-] | 3.82 | |||||||||||||||
| Control | [-] | 4.51 | 4.55 | 4.37 | 3.83 | 3.32 | 0.690 | 1.24 | 3.67 | 0.401 | 0.320 | 0.394 | 0.988 | 0.596 | 0.503 | ||
| LMBIRCH | [-] | 4.50 | 4.54 | 4.36 | 3.83 | 3.32 | 0.678 | 1.23 | 3.67 | 0.403 | 0.320 | 0.394 | 0.987 | 0.595 | 0.503 | ||
| LMBIRCH2 | [-] | 4.75 | 4.79 | 4.59 | 3.83 | 3.32 | 0.923 | 1.38 | 3.70 | 0.352 | 0.316 | 0.388 | 0.982 | 0.603 | 0.493 | ||
| LUNA3 | [-] | 4.50 | 4.54 | 4.36 | 3.83 | 3.32 | 0.678 | 1.23 | 3.67 | 0.403 | 0.320 | 0.394 | 0.987 | 0.595 | 0.503 |
Download Data |
Period Mean (original grids) [1] |
Model Period Mean (intersection) [1] |
Model Period Mean (complement) [1] |
Benchmark Period Mean (intersection) [1] |
Benchmark Period Mean (complement) [1] |
Bias [1] |
RMSE [1] |
Phase Shift [months] |
Bias Score [1] |
RMSE Score [1] |
Seasonal Cycle Score [1] |
Spatial Distribution Score [1] |
Interannual Variability Score [1] |
Overall Score [1] |
|||
|---|---|---|---|---|---|---|---|---|---|---|---|---|---|---|---|---|---|
| Benchmark | [-] | 1.28 | |||||||||||||||
| Control | [-] | 2.10 | 2.13 | 3.14 | 1.28 | 1.54 | 0.861 | 1.62 | 0.926 | 0.409 | 0.449 | 0.885 | 0.198 | 0.629 | 0.503 | ||
| LMBIRCH | [-] | 1.46 | 1.47 | 2.17 | 1.28 | 1.54 | 0.209 | 1.14 | 0.642 | 0.567 | 0.511 | 0.945 | 0.311 | 0.630 | 0.579 | ||
| LMBIRCH2 | [-] | 1.96 | 1.99 | 3.00 | 1.28 | 1.54 | 0.733 | 1.43 | 0.590 | 0.427 | 0.508 | 0.952 | 0.211 | 0.641 | 0.541 | ||
| LUNA3 | [-] | 0.939 | 0.944 | 1.34 | 1.28 | 1.54 | -0.323 | 1.03 | 0.842 | 0.666 | 0.474 | 0.900 | 0.658 | 0.608 | 0.630 |
Download Data |
Period Mean (original grids) [1] |
Model Period Mean (intersection) [1] |
Model Period Mean (complement) [1] |
Benchmark Period Mean (intersection) [1] |
Benchmark Period Mean (complement) [1] |
Bias [1] |
RMSE [1] |
Phase Shift [months] |
Bias Score [1] |
RMSE Score [1] |
Seasonal Cycle Score [1] |
Spatial Distribution Score [1] |
Interannual Variability Score [1] |
Overall Score [1] |
|||
|---|---|---|---|---|---|---|---|---|---|---|---|---|---|---|---|---|---|
| Benchmark | [-] | 0.905 | |||||||||||||||
| Control | [-] | 1.26 | 1.41 | 0.385 | 0.904 | 1.70 | 0.581 | 1.07 | 1.44 | 0.471 | 0.374 | 0.795 | 0.691 | 0.474 | 0.530 | ||
| LMBIRCH | [-] | 1.15 | 1.29 | 0.314 | 0.904 | 1.70 | 0.457 | 0.937 | 1.43 | 0.500 | 0.381 | 0.794 | 0.727 | 0.528 | 0.552 | ||
| LMBIRCH2 | [-] | 1.30 | 1.45 | 0.380 | 0.904 | 1.70 | 0.650 | 1.08 | 1.43 | 0.395 | 0.369 | 0.793 | 0.573 | 0.496 | 0.499 | ||
| LUNA3 | [-] | 1.12 | 1.25 | 0.322 | 0.904 | 1.70 | 0.405 | 0.945 | 1.45 | 0.551 | 0.387 | 0.793 | 0.782 | 0.511 | 0.568 |
Download Data |
Period Mean (original grids) [1] |
Model Period Mean (intersection) [1] |
Model Period Mean (complement) [1] |
Benchmark Period Mean (intersection) [1] |
Benchmark Period Mean (complement) [1] |
Bias [1] |
RMSE [1] |
Phase Shift [months] |
Bias Score [1] |
RMSE Score [1] |
Seasonal Cycle Score [1] |
Spatial Distribution Score [1] |
Interannual Variability Score [1] |
Overall Score [1] |
|||
|---|---|---|---|---|---|---|---|---|---|---|---|---|---|---|---|---|---|
| Benchmark | [-] | 1.81 | |||||||||||||||
| Control | [-] | 1.84 | 1.81 | 1.39 | 1.80 | 2.04 | 0.185 | 1.14 | 3.26 | 0.420 | 0.333 | 0.460 | 0.864 | 0.555 | 0.494 | ||
| LMBIRCH | [-] | 1.76 | 1.74 | 1.28 | 1.80 | 2.04 | 0.123 | 1.09 | 3.23 | 0.425 | 0.335 | 0.465 | 0.885 | 0.559 | 0.501 | ||
| LMBIRCH2 | [-] | 1.98 | 1.95 | 1.36 | 1.80 | 2.04 | 0.328 | 1.19 | 3.31 | 0.400 | 0.330 | 0.459 | 0.824 | 0.573 | 0.486 | ||
| LUNA3 | [-] | 1.76 | 1.73 | 1.33 | 1.80 | 2.04 | 0.112 | 1.09 | 3.23 | 0.431 | 0.335 | 0.462 | 0.888 | 0.559 | 0.502 |
Download Data |
Period Mean (original grids) [1] |
Model Period Mean (intersection) [1] |
Model Period Mean (complement) [1] |
Benchmark Period Mean (intersection) [1] |
Benchmark Period Mean (complement) [1] |
Bias [1] |
RMSE [1] |
Phase Shift [months] |
Bias Score [1] |
RMSE Score [1] |
Seasonal Cycle Score [1] |
Spatial Distribution Score [1] |
Interannual Variability Score [1] |
Overall Score [1] |
|||
|---|---|---|---|---|---|---|---|---|---|---|---|---|---|---|---|---|---|
| Benchmark | [-] | 0.849 | |||||||||||||||
| Control | [-] | 1.29 | 1.34 | 0.877 | 0.850 | 0.467 | 0.452 | 2.13 | 1.01 | 0.401 | 0.111 | 0.894 | 0.489 | 0.528 | 0.423 | ||
| LMBIRCH | [-] | 0.278 | 0.318 | 0.199 | 0.850 | 0.467 | -0.547 | 0.676 | 0.847 | 0.303 | 0.446 | 0.927 | 0.763 | 0.471 | 0.559 | ||
| LMBIRCH2 | [-] | 0.454 | 0.505 | 0.364 | 0.850 | 0.467 | -0.366 | 0.654 | 0.718 | 0.336 | 0.405 | 0.942 | 0.589 | 0.558 | 0.539 | ||
| LUNA3 | [-] | 0.324 | 0.341 | 0.180 | 0.850 | 0.467 | -0.524 | 0.701 | 1.10 | 0.363 | 0.338 | 0.898 | 0.796 | 0.572 | 0.551 |
Download Data |
Period Mean (original grids) [1] |
Model Period Mean (intersection) [1] |
Model Period Mean (complement) [1] |
Benchmark Period Mean (intersection) [1] |
Benchmark Period Mean (complement) [1] |
Bias [1] |
RMSE [1] |
Phase Shift [months] |
Bias Score [1] |
RMSE Score [1] |
Seasonal Cycle Score [1] |
Spatial Distribution Score [1] |
Interannual Variability Score [1] |
Overall Score [1] |
|||
|---|---|---|---|---|---|---|---|---|---|---|---|---|---|---|---|---|---|
| Benchmark | [-] | 0.851 | |||||||||||||||
| Control | [-] | 0.961 | 0.861 | 2.74 | 0.843 | 1.73 | 0.274 | 0.735 | 2.27 | 0.302 | 0.184 | 0.668 | 0.722 | 0.370 | 0.405 | ||
| LMBIRCH | [-] | 0.899 | 0.811 | 2.48 | 0.843 | 1.73 | 0.189 | 0.661 | 2.28 | 0.334 | 0.198 | 0.668 | 0.835 | 0.406 | 0.440 | ||
| LMBIRCH2 | [-] | 1.01 | 0.902 | 2.92 | 0.843 | 1.73 | 0.333 | 0.772 | 2.29 | 0.296 | 0.178 | 0.649 | 0.662 | 0.366 | 0.388 | ||
| LUNA3 | [-] | 0.884 | 0.797 | 2.44 | 0.843 | 1.73 | 0.172 | 0.651 | 2.22 | 0.342 | 0.204 | 0.695 | 0.849 | 0.409 | 0.450 |
Download Data |
Period Mean (original grids) [1] |
Model Period Mean (intersection) [1] |
Model Period Mean (complement) [1] |
Benchmark Period Mean (intersection) [1] |
Benchmark Period Mean (complement) [1] |
Bias [1] |
RMSE [1] |
Phase Shift [months] |
Bias Score [1] |
RMSE Score [1] |
Seasonal Cycle Score [1] |
Spatial Distribution Score [1] |
Interannual Variability Score [1] |
Overall Score [1] |
|||
|---|---|---|---|---|---|---|---|---|---|---|---|---|---|---|---|---|---|
| Benchmark | [-] | 1.41 | |||||||||||||||
| Control | [-] | 2.36 | 2.36 | 2.35 | 1.41 | 1.11 | 0.962 | 1.48 | 0.882 | 0.404 | 0.352 | 0.911 | 0.586 | 0.556 | 0.527 | ||
| LMBIRCH | [-] | 1.48 | 1.49 | 1.55 | 1.41 | 1.11 | 0.0924 | 0.922 | 0.721 | 0.565 | 0.414 | 0.933 | 0.838 | 0.613 | 0.630 | ||
| LMBIRCH2 | [-] | 2.24 | 2.25 | 2.26 | 1.41 | 1.11 | 0.855 | 1.35 | 0.807 | 0.386 | 0.359 | 0.913 | 0.601 | 0.526 | 0.524 | ||
| LUNA3 | [-] | 1.24 | 1.24 | 1.35 | 1.41 | 1.11 | -0.139 | 0.862 | 0.695 | 0.575 | 0.431 | 0.936 | 0.919 | 0.623 | 0.652 |
Download Data |
Period Mean (original grids) [1] |
Model Period Mean (intersection) [1] |
Model Period Mean (complement) [1] |
Benchmark Period Mean (intersection) [1] |
Benchmark Period Mean (complement) [1] |
Bias [1] |
RMSE [1] |
Phase Shift [months] |
Bias Score [1] |
RMSE Score [1] |
Seasonal Cycle Score [1] |
Spatial Distribution Score [1] |
Interannual Variability Score [1] |
Overall Score [1] |
|||
|---|---|---|---|---|---|---|---|---|---|---|---|---|---|---|---|---|---|
| Benchmark | [-] | 1.50 | |||||||||||||||
| Control | [-] | 1.45 | 1.80 | 0.374 | 1.49 | 1.99 | 0.398 | 1.25 | 1.96 | 0.395 | 0.327 | 0.674 | 0.849 | 0.552 | 0.521 | ||
| LMBIRCH | [-] | 1.24 | 1.54 | 0.321 | 1.49 | 1.99 | 0.129 | 0.973 | 1.91 | 0.427 | 0.354 | 0.683 | 0.882 | 0.565 | 0.544 | ||
| LMBIRCH2 | [-] | 1.48 | 1.83 | 0.381 | 1.49 | 1.99 | 0.437 | 1.15 | 1.94 | 0.369 | 0.337 | 0.674 | 0.803 | 0.554 | 0.512 | ||
| LUNA3 | [-] | 1.15 | 1.42 | 0.311 | 1.49 | 1.99 | 0.0163 | 0.948 | 1.95 | 0.451 | 0.348 | 0.680 | 0.907 | 0.569 | 0.551 |
Download Data |
Period Mean (original grids) [1] |
Model Period Mean (intersection) [1] |
Model Period Mean (complement) [1] |
Benchmark Period Mean (intersection) [1] |
Benchmark Period Mean (complement) [1] |
Bias [1] |
RMSE [1] |
Phase Shift [months] |
Bias Score [1] |
RMSE Score [1] |
Seasonal Cycle Score [1] |
Spatial Distribution Score [1] |
Interannual Variability Score [1] |
Overall Score [1] |
|||
|---|---|---|---|---|---|---|---|---|---|---|---|---|---|---|---|---|---|
| Benchmark | [-] | 0.369 | |||||||||||||||
| Control | [-] | 0.208 | 0.552 | 0.0479 | 0.369 | 0.362 | 0.220 | 0.662 | 2.35 | 0.293 | 0.167 | 0.781 | 0.791 | 0.302 | 0.416 | ||
| LMBIRCH | [-] | 0.176 | 0.460 | 0.0415 | 0.369 | 0.362 | 0.122 | 0.559 | 2.41 | 0.318 | 0.202 | 0.771 | 0.847 | 0.378 | 0.453 | ||
| LMBIRCH2 | [-] | 0.234 | 0.616 | 0.0560 | 0.369 | 0.362 | 0.283 | 0.725 | 2.33 | 0.280 | 0.149 | 0.778 | 0.736 | 0.286 | 0.397 | ||
| LUNA3 | [-] | 0.171 | 0.446 | 0.0409 | 0.369 | 0.362 | 0.109 | 0.562 | 2.41 | 0.302 | 0.207 | 0.771 | 0.846 | 0.372 | 0.451 |
Download Data |
Period Mean (original grids) [1] |
Model Period Mean (intersection) [1] |
Model Period Mean (complement) [1] |
Benchmark Period Mean (intersection) [1] |
Benchmark Period Mean (complement) [1] |
Bias [1] |
RMSE [1] |
Phase Shift [months] |
Bias Score [1] |
RMSE Score [1] |
Seasonal Cycle Score [1] |
Spatial Distribution Score [1] |
Interannual Variability Score [1] |
Overall Score [1] |
|||
|---|---|---|---|---|---|---|---|---|---|---|---|---|---|---|---|---|---|
| Benchmark | [-] | 0.597 | |||||||||||||||
| Control | [-] | 1.24 | 1.32 | 0.569 | 0.597 | 0.491 | 0.654 | 1.65 | 2.15 | 0.217 | 0.165 | 0.740 | 0.276 | 0.439 | 0.334 | ||
| LMBIRCH | [-] | 0.498 | 0.521 | 0.230 | 0.597 | 0.491 | -0.0971 | 0.492 | 1.93 | 0.416 | 0.443 | 0.829 | 0.646 | 0.501 | 0.546 | ||
| LMBIRCH2 | [-] | 0.745 | 0.773 | 0.367 | 0.597 | 0.491 | 0.153 | 0.653 | 1.88 | 0.378 | 0.396 | 0.839 | 0.462 | 0.618 | 0.515 | ||
| LUNA3 | [-] | 0.370 | 0.388 | 0.155 | 0.597 | 0.491 | -0.237 | 0.556 | 2.21 | 0.453 | 0.353 | 0.786 | 0.867 | 0.580 | 0.565 |
Download Data |
Period Mean (original grids) [1] |
Model Period Mean (intersection) [1] |
Model Period Mean (complement) [1] |
Benchmark Period Mean (intersection) [1] |
Benchmark Period Mean (complement) [1] |
Bias [1] |
RMSE [1] |
Phase Shift [months] |
Bias Score [1] |
RMSE Score [1] |
Seasonal Cycle Score [1] |
Spatial Distribution Score [1] |
Interannual Variability Score [1] |
Overall Score [1] |
|||
|---|---|---|---|---|---|---|---|---|---|---|---|---|---|---|---|---|---|
| Benchmark | [-] | 1.98 | |||||||||||||||
| Control | [-] | 1.82 | 1.74 | 2.29 | 1.98 | 2.06 | -0.0449 | 1.07 | 2.49 | 0.356 | 0.303 | 0.577 | 0.948 | 0.578 | 0.511 | ||
| LMBIRCH | [-] | 1.79 | 1.71 | 2.25 | 1.98 | 2.06 | -0.0763 | 1.06 | 2.49 | 0.354 | 0.308 | 0.578 | 0.950 | 0.583 | 0.513 | ||
| LMBIRCH2 | [-] | 1.95 | 1.86 | 2.44 | 1.98 | 2.06 | 0.0833 | 1.11 | 2.38 | 0.351 | 0.295 | 0.589 | 0.936 | 0.564 | 0.505 | ||
| LUNA3 | [-] | 1.77 | 1.69 | 2.24 | 1.98 | 2.06 | -0.0913 | 1.06 | 2.48 | 0.352 | 0.307 | 0.581 | 0.950 | 0.579 | 0.513 |
Download Data |
Period Mean (original grids) [1] |
Model Period Mean (intersection) [1] |
Model Period Mean (complement) [1] |
Benchmark Period Mean (intersection) [1] |
Benchmark Period Mean (complement) [1] |
Bias [1] |
RMSE [1] |
Phase Shift [months] |
Bias Score [1] |
RMSE Score [1] |
Seasonal Cycle Score [1] |
Spatial Distribution Score [1] |
Interannual Variability Score [1] |
Overall Score [1] |
|||
|---|---|---|---|---|---|---|---|---|---|---|---|---|---|---|---|---|---|
| Benchmark | [-] | 1.79 | |||||||||||||||
| Control | [-] | 2.10 | 2.06 | 2.17 | 1.79 | 1.37 | 0.328 | 1.12 | 0.866 | 0.579 | 0.479 | 0.919 | 0.937 | 0.525 | 0.653 | ||
| LMBIRCH | [-] | 2.01 | 1.98 | 1.84 | 1.79 | 1.37 | 0.232 | 1.09 | 0.859 | 0.587 | 0.466 | 0.920 | 0.935 | 0.542 | 0.653 | ||
| LMBIRCH2 | [-] | 2.82 | 2.77 | 2.73 | 1.79 | 1.37 | 1.05 | 1.52 | 1.00 | 0.404 | 0.427 | 0.891 | 0.809 | 0.463 | 0.570 | ||
| LUNA3 | [-] | 1.62 | 1.59 | 1.63 | 1.79 | 1.37 | -0.156 | 1.02 | 0.877 | 0.613 | 0.491 | 0.917 | 0.952 | 0.585 | 0.675 |
Download Data |
Period Mean (original grids) [1] |
Model Period Mean (intersection) [1] |
Model Period Mean (complement) [1] |
Benchmark Period Mean (intersection) [1] |
Benchmark Period Mean (complement) [1] |
Bias [1] |
RMSE [1] |
Phase Shift [months] |
Bias Score [1] |
RMSE Score [1] |
Seasonal Cycle Score [1] |
Spatial Distribution Score [1] |
Interannual Variability Score [1] |
Overall Score [1] |
|||
|---|---|---|---|---|---|---|---|---|---|---|---|---|---|---|---|---|---|
| Benchmark | [-] | 1.27 | |||||||||||||||
| Control | [-] | 2.90 | 2.89 | 2.39 | 1.27 | 1.14 | 1.65 | 2.01 | 1.29 | 0.276 | 0.415 | 0.837 | 0.444 | 0.636 | 0.504 | ||
| LMBIRCH | [-] | 2.20 | 2.20 | 1.71 | 1.27 | 1.14 | 0.934 | 1.43 | 1.27 | 0.434 | 0.440 | 0.831 | 0.565 | 0.603 | 0.552 | ||
| LMBIRCH2 | [-] | 2.99 | 2.98 | 2.55 | 1.27 | 1.14 | 1.76 | 2.04 | 1.17 | 0.243 | 0.444 | 0.849 | 0.438 | 0.660 | 0.513 | ||
| LUNA3 | [-] | 1.37 | 1.36 | 1.20 | 1.27 | 1.14 | 0.111 | 0.997 | 1.28 | 0.619 | 0.426 | 0.833 | 0.838 | 0.578 | 0.620 |
Download Data |
Period Mean (original grids) [1] |
Model Period Mean (intersection) [1] |
Model Period Mean (complement) [1] |
Benchmark Period Mean (intersection) [1] |
Benchmark Period Mean (complement) [1] |
Bias [1] |
RMSE [1] |
Phase Shift [months] |
Bias Score [1] |
RMSE Score [1] |
Seasonal Cycle Score [1] |
Spatial Distribution Score [1] |
Interannual Variability Score [1] |
Overall Score [1] |
|||
|---|---|---|---|---|---|---|---|---|---|---|---|---|---|---|---|---|---|
| Benchmark | [-] | 0.744 | |||||||||||||||
| Control | [-] | 0.840 | 0.841 | 3.26 | 0.744 | 0.739 | 0.164 | 0.770 | 1.31 | 0.384 | 0.275 | 0.839 | 0.865 | 0.367 | 0.501 | ||
| LMBIRCH | [-] | 0.717 | 0.715 | 2.53 | 0.744 | 0.739 | 0.0200 | 0.683 | 1.36 | 0.394 | 0.304 | 0.833 | 0.899 | 0.369 | 0.517 | ||
| LMBIRCH2 | [-] | 0.857 | 0.861 | 3.61 | 0.744 | 0.739 | 0.191 | 0.792 | 1.34 | 0.365 | 0.272 | 0.791 | 0.841 | 0.375 | 0.486 | ||
| LUNA3 | [-] | 0.678 | 0.677 | 2.54 | 0.744 | 0.739 | -0.0181 | 0.694 | 1.39 | 0.382 | 0.301 | 0.826 | 0.890 | 0.361 | 0.510 |
Download Data |
Period Mean (original grids) [1] |
Model Period Mean (intersection) [1] |
Model Period Mean (complement) [1] |
Benchmark Period Mean (intersection) [1] |
Benchmark Period Mean (complement) [1] |
Bias [1] |
RMSE [1] |
Phase Shift [months] |
Bias Score [1] |
RMSE Score [1] |
Seasonal Cycle Score [1] |
Spatial Distribution Score [1] |
Interannual Variability Score [1] |
Overall Score [1] |
|||
|---|---|---|---|---|---|---|---|---|---|---|---|---|---|---|---|---|---|
| Benchmark | [-] | 3.93 | |||||||||||||||
| Control | [-] | 4.29 | 4.32 | 3.84 | 3.93 | 2.63 | 0.360 | 1.26 | 1.99 | 0.522 | 0.349 | 0.739 | 0.983 | 0.601 | 0.590 | ||
| LMBIRCH | [-] | 4.27 | 4.30 | 3.82 | 3.93 | 2.63 | 0.338 | 1.25 | 1.98 | 0.522 | 0.349 | 0.739 | 0.983 | 0.601 | 0.591 | ||
| LMBIRCH2 | [-] | 4.58 | 4.60 | 4.11 | 3.93 | 2.63 | 0.644 | 1.37 | 1.97 | 0.489 | 0.346 | 0.744 | 0.976 | 0.614 | 0.586 | ||
| LUNA3 | [-] | 4.27 | 4.30 | 3.82 | 3.93 | 2.63 | 0.338 | 1.25 | 1.98 | 0.522 | 0.349 | 0.739 | 0.983 | 0.601 | 0.591 |
Download Data |
Period Mean (original grids) [1] |
Model Period Mean (intersection) [1] |
Model Period Mean (complement) [1] |
Benchmark Period Mean (intersection) [1] |
Benchmark Period Mean (complement) [1] |
Bias [1] |
RMSE [1] |
Phase Shift [months] |
Bias Score [1] |
RMSE Score [1] |
Seasonal Cycle Score [1] |
Spatial Distribution Score [1] |
Interannual Variability Score [1] |
Overall Score [1] |
|||
|---|---|---|---|---|---|---|---|---|---|---|---|---|---|---|---|---|---|
| Benchmark | [-] | 1.97 | |||||||||||||||
| Control | [-] | 2.33 | 2.28 | 2.95 | 1.97 | 3.20 | 0.359 | 1.37 | 2.51 | 0.261 | 0.279 | 0.599 | 0.666 | 0.532 | 0.436 | ||
| LMBIRCH | [-] | 2.12 | 2.08 | 2.28 | 1.97 | 3.20 | 0.135 | 1.19 | 2.46 | 0.316 | 0.302 | 0.606 | 0.736 | 0.573 | 0.472 | ||
| LMBIRCH2 | [-] | 2.57 | 2.53 | 3.19 | 1.97 | 3.20 | 0.604 | 1.51 | 2.57 | 0.231 | 0.267 | 0.590 | 0.609 | 0.497 | 0.410 | ||
| LUNA3 | [-] | 2.08 | 2.04 | 2.27 | 1.97 | 3.20 | 0.104 | 1.18 | 2.45 | 0.316 | 0.304 | 0.608 | 0.737 | 0.573 | 0.473 |
Download Data |
Period Mean (original grids) [1] |
Model Period Mean (intersection) [1] |
Model Period Mean (complement) [1] |
Benchmark Period Mean (intersection) [1] |
Benchmark Period Mean (complement) [1] |
Bias [1] |
RMSE [1] |
Phase Shift [months] |
Bias Score [1] |
RMSE Score [1] |
Seasonal Cycle Score [1] |
Spatial Distribution Score [1] |
Interannual Variability Score [1] |
Overall Score [1] |
|||
|---|---|---|---|---|---|---|---|---|---|---|---|---|---|---|---|---|---|
| Benchmark | [-] | 0.781 | |||||||||||||||
| Control | [-] | 1.46 | 1.51 | 0.912 | 0.764 | 2.21 | 0.867 | 1.32 | 2.52 | 0.222 | 0.233 | 0.681 | 0.625 | 0.452 | 0.408 | ||
| LMBIRCH | [-] | 1.32 | 1.36 | 0.769 | 0.764 | 2.21 | 0.689 | 1.09 | 2.69 | 0.255 | 0.241 | 0.627 | 0.680 | 0.452 | 0.416 | ||
| LMBIRCH2 | [-] | 1.53 | 1.59 | 0.747 | 0.764 | 2.21 | 0.968 | 1.39 | 2.60 | 0.167 | 0.200 | 0.636 | 0.549 | 0.413 | 0.361 | ||
| LUNA3 | [-] | 1.26 | 1.28 | 0.818 | 0.764 | 2.21 | 0.572 | 1.01 | 2.51 | 0.313 | 0.274 | 0.679 | 0.741 | 0.472 | 0.459 |
Temporally integrated period mean