Mean State
Download Data |
Period Mean (original grids) [Pg] |
Model Period Mean (intersection) [Pg] |
Model Period Mean (complement) [Pg] |
Benchmark Period Mean (intersection) [Pg] |
Benchmark Period Mean (complement) [Pg] |
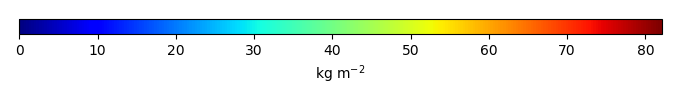
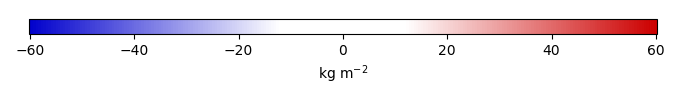
Bias [kg m-2] |
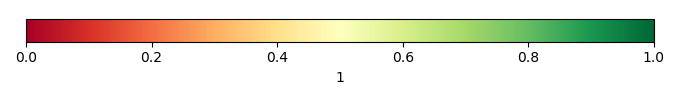
Bias Score [1] |
Spatial Distribution Score [1] |
Overall Score [1] |
|||
|---|---|---|---|---|---|---|---|---|---|---|---|---|
| Benchmark | [-] | 76.5 | ||||||||||
| Control | [-] | 110. | 94.4 | 13.2 | 76.3 | 0.132 | 8.97 | 0.504 | 0.236 | 0.370 | ||
| LMBIRCH | [-] | 13.6 | 12.2 | 1.40 | 76.3 | 0.132 | -22.4 | 0.439 | 0.431 | 0.435 | ||
| LMBIRCH2 | [-] | 31.4 | 27.1 | 3.97 | 76.3 | 0.132 | -16.6 | 0.507 | 0.824 | 0.665 | ||
| LUNA3 | [-] | 30.3 | 25.9 | 3.69 | 76.3 | 0.132 | -17.2 | 0.507 | 0.814 | 0.661 |
Download Data |
Period Mean (original grids) [Pg] |
Model Period Mean (intersection) [Pg] |
Model Period Mean (complement) [Pg] |
Benchmark Period Mean (intersection) [Pg] |
Benchmark Period Mean (complement) [Pg] |
Bias [kg m-2] |
Bias Score [1] |
Spatial Distribution Score [1] |
Overall Score [1] |
|||
|---|---|---|---|---|---|---|---|---|---|---|---|---|
| Benchmark | [-] | 113. | ||||||||||
| Control | [-] | 147. | 80.2 | 62.3 | 113. | -6.67 | 0.551 | 0.818 | 0.684 | |||
| LMBIRCH | [-] | 85.1 | 47.1 | 35.4 | 113. | -13.6 | 0.536 | 0.645 | 0.591 | |||
| LMBIRCH2 | [-] | 152. | 87.4 | 59.4 | 113. | -5.18 | 0.555 | 0.814 | 0.685 | |||
| LUNA3 | [-] | 58.1 | 31.2 | 24.7 | 113. | -16.9 | 0.486 | 0.340 | 0.413 |
Download Data |
Period Mean (original grids) [Pg] |
Model Period Mean (intersection) [Pg] |
Model Period Mean (complement) [Pg] |
Benchmark Period Mean (intersection) [Pg] |
Benchmark Period Mean (complement) [Pg] |
Bias [kg m-2] |
Bias Score [1] |
Spatial Distribution Score [1] |
Overall Score [1] |
|||
|---|---|---|---|---|---|---|---|---|---|---|---|---|
| Benchmark | [-] | 12.2 | ||||||||||
| Control | [-] | 99.8 | 5.78 | 95.9 | 12.2 | -6.54 | 0.561 | 0.812 | 0.686 | |||
| LMBIRCH | [-] | 79.4 | 3.10 | 77.7 | 12.2 | -9.22 | 0.473 | 0.434 | 0.454 | |||
| LMBIRCH2 | [-] | 113. | 5.57 | 110. | 12.2 | -6.77 | 0.545 | 0.838 | 0.691 | |||
| LUNA3 | [-] | 78.9 | 3.94 | 76.4 | 12.2 | -8.38 | 0.508 | 0.324 | 0.416 |
Download Data |
Period Mean (original grids) [Pg] |
Model Period Mean (intersection) [Pg] |
Model Period Mean (complement) [Pg] |
Benchmark Period Mean (intersection) [Pg] |
Benchmark Period Mean (complement) [Pg] |
Bias [kg m-2] |
Bias Score [1] |
Spatial Distribution Score [1] |
Overall Score [1] |
|||
|---|---|---|---|---|---|---|---|---|---|---|---|---|
| Benchmark | [-] | 97.3 | ||||||||||
| Control | [-] | 128. | 119. | 13.4 | 97.2 | 0.0316 | 7.58 | 0.550 | 0.372 | 0.461 | ||
| LMBIRCH | [-] | 19.6 | 19.0 | 1.79 | 97.2 | 0.0316 | -24.8 | 0.455 | 0.500 | 0.478 | ||
| LMBIRCH2 | [-] | 49.1 | 47.2 | 4.88 | 97.2 | 0.0316 | -15.7 | 0.597 | 0.897 | 0.747 | ||
| LUNA3 | [-] | 30.0 | 28.4 | 2.74 | 97.2 | 0.0316 | -21.8 | 0.502 | 0.799 | 0.650 |
Download Data |
Period Mean (original grids) [Pg] |
Model Period Mean (intersection) [Pg] |
Model Period Mean (complement) [Pg] |
Benchmark Period Mean (intersection) [Pg] |
Benchmark Period Mean (complement) [Pg] |
Bias [kg m-2] |
Bias Score [1] |
Spatial Distribution Score [1] |
Overall Score [1] |
|||
|---|---|---|---|---|---|---|---|---|---|---|---|---|
| Benchmark | [-] | 5.12 | ||||||||||
| Control | [-] | 46.2 | 3.44 | 42.4 | 5.12 | -6.04 | 0.650 | 0.712 | 0.681 | |||
| LMBIRCH | [-] | 24.6 | 0.882 | 23.8 | 5.12 | -15.7 | 0.438 | 0.133 | 0.286 | |||
| LMBIRCH2 | [-] | 44.8 | 2.23 | 42.4 | 5.12 | -10.6 | 0.558 | 0.536 | 0.547 | |||
| LUNA3 | [-] | 21.2 | 0.576 | 20.7 | 5.12 | -16.9 | 0.413 | 0.0496 | 0.231 |
Download Data |
Period Mean (original grids) [Pg] |
Model Period Mean (intersection) [Pg] |
Model Period Mean (complement) [Pg] |
Benchmark Period Mean (intersection) [Pg] |
Benchmark Period Mean (complement) [Pg] |
Bias [kg m-2] |
Bias Score [1] |
Spatial Distribution Score [1] |
Overall Score [1] |
|||
|---|---|---|---|---|---|---|---|---|---|---|---|---|
| Benchmark | [-] | 475. | ||||||||||
| Control | [-] | 1.14e+03 | 459. | 678. | 475. | 0.691 | 0.124 | 0.532 | 0.609 | 0.570 | ||
| LMBIRCH | [-] | 667. | 123. | 544. | 475. | 0.691 | -15.4 | 0.474 | 0.351 | 0.412 | ||
| LMBIRCH2 | [-] | 980. | 266. | 715. | 475. | 0.691 | -8.74 | 0.540 | 0.736 | 0.638 | ||
| LUNA3 | [-] | 640. | 124. | 516. | 475. | 0.691 | -15.3 | 0.476 | 0.488 | 0.482 |
Download Data |
Period Mean (original grids) [Pg] |
Model Period Mean (intersection) [Pg] |
Model Period Mean (complement) [Pg] |
Benchmark Period Mean (intersection) [Pg] |
Benchmark Period Mean (complement) [Pg] |
Bias [kg m-2] |
Bias Score [1] |
Spatial Distribution Score [1] |
Overall Score [1] |
|||
|---|---|---|---|---|---|---|---|---|---|---|---|---|
| Benchmark | [-] | 116. | ||||||||||
| Control | [-] | 129. | 118. | 9.40 | 116. | 0.0985 | 1.48 | 0.505 | 0.635 | 0.570 | ||
| LMBIRCH | [-] | 21.5 | 19.7 | 1.28 | 116. | 0.0985 | -15.8 | 0.439 | 0.182 | 0.311 | ||
| LMBIRCH2 | [-] | 58.8 | 53.5 | 3.86 | 116. | 0.0985 | -9.83 | 0.492 | 0.673 | 0.583 | ||
| LUNA3 | [-] | 23.6 | 22.2 | 1.05 | 116. | 0.0985 | -15.4 | 0.436 | 0.336 | 0.386 |
Download Data |
Period Mean (original grids) [Pg] |
Model Period Mean (intersection) [Pg] |
Model Period Mean (complement) [Pg] |
Benchmark Period Mean (intersection) [Pg] |
Benchmark Period Mean (complement) [Pg] |
Bias [kg m-2] |
Bias Score [1] |
Spatial Distribution Score [1] |
Overall Score [1] |
|||
|---|---|---|---|---|---|---|---|---|---|---|---|---|
| Benchmark | [-] | 0.0131 | ||||||||||
| Control | [-] | 32.3 | 0.0204 | 32.2 | 0.0131 | 4.15 | 0.495 | 5.51e-23 | 0.248 | |||
| LMBIRCH | [-] | 31.4 | 0.0189 | 31.3 | 0.0131 | 3.36 | 0.566 | 2.53e-21 | 0.283 | |||
| LMBIRCH2 | [-] | 41.9 | 0.0261 | 41.7 | 0.0131 | 6.91 | 0.310 | 1.97e-22 | 0.155 | |||
| LUNA3 | [-] | 24.7 | 0.0117 | 24.7 | 0.0131 | -0.119 | 0.961 | 7.02e-23 | 0.480 |
Download Data |
Period Mean (original grids) [Pg] |
Model Period Mean (intersection) [Pg] |
Model Period Mean (complement) [Pg] |
Benchmark Period Mean (intersection) [Pg] |
Benchmark Period Mean (complement) [Pg] |
Bias [kg m-2] |
Bias Score [1] |
Spatial Distribution Score [1] |
Overall Score [1] |
|||
|---|---|---|---|---|---|---|---|---|---|---|---|---|
| Benchmark | [-] | 46.1 | ||||||||||
| Control | [-] | 77.7 | 36.9 | 41.5 | 46.1 | -4.21 | 0.565 | 0.594 | 0.579 | |||
| LMBIRCH | [-] | 47.4 | 20.2 | 27.7 | 46.1 | -12.3 | 0.528 | 0.307 | 0.418 | |||
| LMBIRCH2 | [-] | 80.5 | 36.7 | 44.6 | 46.1 | -4.29 | 0.589 | 0.627 | 0.608 | |||
| LUNA3 | [-] | 31.7 | 11.6 | 20.4 | 46.1 | -16.4 | 0.464 | 0.125 | 0.294 |
Download Data |
Period Mean (original grids) [Pg] |
Model Period Mean (intersection) [Pg] |
Model Period Mean (complement) [Pg] |
Benchmark Period Mean (intersection) [Pg] |
Benchmark Period Mean (complement) [Pg] |
Bias [kg m-2] |
Bias Score [1] |
Spatial Distribution Score [1] |
Overall Score [1] |
|||
|---|---|---|---|---|---|---|---|---|---|---|---|---|
| Benchmark | [-] | 0.232 | ||||||||||
| Control | [-] | 13.9 | 0.260 | 13.3 | 0.232 | 0.398 | 0.594 | 0.682 | 0.638 | |||
| LMBIRCH | [-] | 11.2 | 0.161 | 10.7 | 0.232 | -1.38 | 0.615 | 0.237 | 0.426 | |||
| LMBIRCH2 | [-] | 14.8 | 0.199 | 14.2 | 0.232 | -0.652 | 0.642 | 0.368 | 0.505 | |||
| LUNA3 | [-] | 10.9 | 0.138 | 10.5 | 0.232 | -1.78 | 0.571 | 0.306 | 0.438 |
Temporally integrated period mean