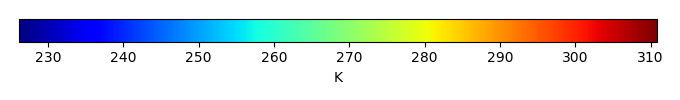
Mean State
Download Data |
Period Mean (original grids) [K] |
Model Period Mean (intersection) [K] |
Model Period Mean (complement) [K] |
Benchmark Period Mean (intersection) [K] |
Benchmark Period Mean (complement) [K] |
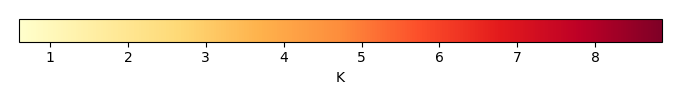
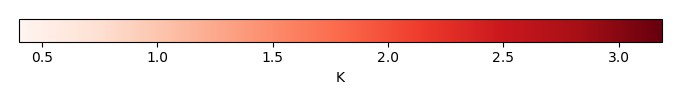
Bias [K] |
RMSE [K] |
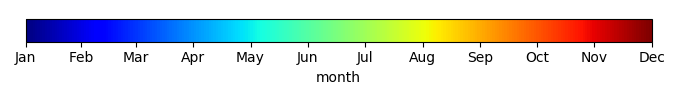
Phase Shift [months] |
Bias Score [1] |
RMSE Score [1] |
Seasonal Cycle Score [1] |
Spatial Distribution Score [1] |
Interannual Variability Score [1] |
Overall Score [1] |
|||
|---|---|---|---|---|---|---|---|---|---|---|---|---|---|---|---|---|---|
| Benchmark | [-] | 304. | |||||||||||||||
| Control | [-] | 305. | 306. | 304. | 304. | 305. | 1.71 | 2.21 | 0.396 | 0.290 | 0.631 | 0.951 | 0.997 | 0.801 | 0.717 | ||
| LMBIRCH | [-] | 305. | 306. | 304. | 304. | 305. | 1.71 | 2.21 | 0.396 | 0.290 | 0.631 | 0.951 | 0.997 | 0.801 | 0.717 | ||
| LMBIRCH2 | [-] | 305. | 306. | 304. | 304. | 305. | 1.70 | 2.21 | 0.396 | 0.290 | 0.631 | 0.951 | 0.997 | 0.801 | 0.717 | ||
| LUNA3 | [-] | 305. | 306. | 304. | 304. | 305. | 1.71 | 2.21 | 0.396 | 0.290 | 0.631 | 0.951 | 0.997 | 0.801 | 0.717 |
Download Data |
Period Mean (original grids) [K] |
Model Period Mean (intersection) [K] |
Model Period Mean (complement) [K] |
Benchmark Period Mean (intersection) [K] |
Benchmark Period Mean (complement) [K] |
Bias [K] |
RMSE [K] |
Phase Shift [months] |
Bias Score [1] |
RMSE Score [1] |
Seasonal Cycle Score [1] |
Spatial Distribution Score [1] |
Interannual Variability Score [1] |
Overall Score [1] |
|||
|---|---|---|---|---|---|---|---|---|---|---|---|---|---|---|---|---|---|
| Benchmark | [-] | 307. | |||||||||||||||
| Control | [-] | 309. | 309. | 304. | 307. | 306. | 1.97 | 2.37 | 0.235 | 0.485 | 0.742 | 0.981 | 0.999 | 0.878 | 0.804 | ||
| LMBIRCH | [-] | 309. | 309. | 304. | 307. | 306. | 1.97 | 2.37 | 0.236 | 0.485 | 0.742 | 0.981 | 0.999 | 0.878 | 0.804 | ||
| LMBIRCH2 | [-] | 309. | 309. | 304. | 307. | 306. | 1.97 | 2.38 | 0.235 | 0.483 | 0.742 | 0.981 | 0.998 | 0.878 | 0.804 | ||
| LUNA3 | [-] | 309. | 309. | 304. | 307. | 306. | 1.97 | 2.37 | 0.236 | 0.485 | 0.742 | 0.981 | 0.999 | 0.878 | 0.804 |
Download Data |
Period Mean (original grids) [K] |
Model Period Mean (intersection) [K] |
Model Period Mean (complement) [K] |
Benchmark Period Mean (intersection) [K] |
Benchmark Period Mean (complement) [K] |
Bias [K] |
RMSE [K] |
Phase Shift [months] |
Bias Score [1] |
RMSE Score [1] |
Seasonal Cycle Score [1] |
Spatial Distribution Score [1] |
Interannual Variability Score [1] |
Overall Score [1] |
|||
|---|---|---|---|---|---|---|---|---|---|---|---|---|---|---|---|---|---|
| Benchmark | [-] | 301. | |||||||||||||||
| Control | [-] | 303. | 303. | 301. | 301. | 299. | 1.73 | 2.25 | 0.426 | 0.429 | 0.714 | 0.946 | 0.996 | 0.823 | 0.770 | ||
| LMBIRCH | [-] | 303. | 303. | 301. | 301. | 299. | 1.73 | 2.25 | 0.426 | 0.429 | 0.714 | 0.946 | 0.996 | 0.823 | 0.770 | ||
| LMBIRCH2 | [-] | 303. | 303. | 301. | 301. | 299. | 1.72 | 2.25 | 0.426 | 0.430 | 0.714 | 0.946 | 0.996 | 0.824 | 0.771 | ||
| LUNA3 | [-] | 303. | 303. | 301. | 301. | 299. | 1.73 | 2.25 | 0.426 | 0.429 | 0.714 | 0.946 | 0.996 | 0.823 | 0.770 |
Download Data |
Period Mean (original grids) [K] |
Model Period Mean (intersection) [K] |
Model Period Mean (complement) [K] |
Benchmark Period Mean (intersection) [K] |
Benchmark Period Mean (complement) [K] |
Bias [K] |
RMSE [K] |
Phase Shift [months] |
Bias Score [1] |
RMSE Score [1] |
Seasonal Cycle Score [1] |
Spatial Distribution Score [1] |
Interannual Variability Score [1] |
Overall Score [1] |
|||
|---|---|---|---|---|---|---|---|---|---|---|---|---|---|---|---|---|---|
| Benchmark | [-] | 266. | |||||||||||||||
| Control | [-] | 266. | 266. | 269. | 266. | 270. | 0.747 | 2.18 | 0.0589 | 0.926 | 0.899 | 0.996 | 1.00 | 0.897 | 0.936 | ||
| LMBIRCH | [-] | 266. | 266. | 269. | 266. | 270. | 0.686 | 2.18 | 0.0589 | 0.928 | 0.898 | 0.996 | 1.00 | 0.896 | 0.936 | ||
| LMBIRCH2 | [-] | 266. | 266. | 269. | 266. | 270. | 0.717 | 2.18 | 0.0578 | 0.927 | 0.898 | 0.996 | 1.00 | 0.896 | 0.936 | ||
| LUNA3 | [-] | 266. | 266. | 269. | 266. | 270. | 0.718 | 2.18 | 0.0589 | 0.927 | 0.898 | 0.996 | 1.00 | 0.897 | 0.936 |
Download Data |
Period Mean (original grids) [K] |
Model Period Mean (intersection) [K] |
Model Period Mean (complement) [K] |
Benchmark Period Mean (intersection) [K] |
Benchmark Period Mean (complement) [K] |
Bias [K] |
RMSE [K] |
Phase Shift [months] |
Bias Score [1] |
RMSE Score [1] |
Seasonal Cycle Score [1] |
Spatial Distribution Score [1] |
Interannual Variability Score [1] |
Overall Score [1] |
|||
|---|---|---|---|---|---|---|---|---|---|---|---|---|---|---|---|---|---|
| Benchmark | [-] | 304. | |||||||||||||||
| Control | [-] | 305. | 305. | 304. | 304. | 303. | 1.02 | 1.84 | 1.09 | 0.186 | 0.498 | 0.835 | 0.823 | 0.795 | 0.606 | ||
| LMBIRCH | [-] | 305. | 305. | 304. | 304. | 303. | 1.02 | 1.84 | 1.09 | 0.186 | 0.498 | 0.835 | 0.823 | 0.795 | 0.606 | ||
| LMBIRCH2 | [-] | 305. | 305. | 304. | 304. | 303. | 1.01 | 1.84 | 1.09 | 0.187 | 0.497 | 0.835 | 0.823 | 0.795 | 0.606 | ||
| LUNA3 | [-] | 305. | 305. | 304. | 304. | 303. | 1.02 | 1.84 | 1.09 | 0.186 | 0.498 | 0.835 | 0.823 | 0.795 | 0.606 |
Download Data |
Period Mean (original grids) [K] |
Model Period Mean (intersection) [K] |
Model Period Mean (complement) [K] |
Benchmark Period Mean (intersection) [K] |
Benchmark Period Mean (complement) [K] |
Bias [K] |
RMSE [K] |
Phase Shift [months] |
Bias Score [1] |
RMSE Score [1] |
Seasonal Cycle Score [1] |
Spatial Distribution Score [1] |
Interannual Variability Score [1] |
Overall Score [1] |
|||
|---|---|---|---|---|---|---|---|---|---|---|---|---|---|---|---|---|---|
| Benchmark | [-] | 276. | |||||||||||||||
| Control | [-] | 276. | 276. | 278. | 276. | 277. | 0.286 | 1.24 | 0.00998 | 0.952 | 0.941 | 0.999 | 1.00 | 0.970 | 0.967 | ||
| LMBIRCH | [-] | 276. | 276. | 278. | 276. | 277. | 0.271 | 1.26 | 0.00998 | 0.952 | 0.939 | 0.999 | 1.00 | 0.970 | 0.967 | ||
| LMBIRCH2 | [-] | 276. | 276. | 278. | 276. | 277. | 0.292 | 1.24 | 0.00998 | 0.952 | 0.941 | 0.999 | 1.00 | 0.970 | 0.967 | ||
| LUNA3 | [-] | 276. | 276. | 278. | 276. | 277. | 0.228 | 1.28 | 0.00998 | 0.952 | 0.937 | 0.999 | 1.00 | 0.970 | 0.966 |
Download Data |
Period Mean (original grids) [K] |
Model Period Mean (intersection) [K] |
Model Period Mean (complement) [K] |
Benchmark Period Mean (intersection) [K] |
Benchmark Period Mean (complement) [K] |
Bias [K] |
RMSE [K] |
Phase Shift [months] |
Bias Score [1] |
RMSE Score [1] |
Seasonal Cycle Score [1] |
Spatial Distribution Score [1] |
Interannual Variability Score [1] |
Overall Score [1] |
|||
|---|---|---|---|---|---|---|---|---|---|---|---|---|---|---|---|---|---|
| Benchmark | [-] | 286. | |||||||||||||||
| Control | [-] | 287. | 287. | 290. | 286. | 291. | 1.01 | 2.01 | 0.0808 | 0.850 | 0.916 | 0.994 | 1.00 | 0.937 | 0.936 | ||
| LMBIRCH | [-] | 287. | 287. | 290. | 286. | 291. | 1.00 | 2.01 | 0.0758 | 0.850 | 0.916 | 0.994 | 1.00 | 0.939 | 0.936 | ||
| LMBIRCH2 | [-] | 287. | 287. | 290. | 286. | 291. | 0.998 | 2.01 | 0.0830 | 0.851 | 0.916 | 0.993 | 1.00 | 0.938 | 0.936 | ||
| LUNA3 | [-] | 287. | 287. | 290. | 286. | 291. | 1.01 | 2.01 | 0.0758 | 0.850 | 0.916 | 0.994 | 1.00 | 0.938 | 0.936 |
Download Data |
Period Mean (original grids) [K] |
Model Period Mean (intersection) [K] |
Model Period Mean (complement) [K] |
Benchmark Period Mean (intersection) [K] |
Benchmark Period Mean (complement) [K] |
Bias [K] |
RMSE [K] |
Phase Shift [months] |
Bias Score [1] |
RMSE Score [1] |
Seasonal Cycle Score [1] |
Spatial Distribution Score [1] |
Interannual Variability Score [1] |
Overall Score [1] |
|||
|---|---|---|---|---|---|---|---|---|---|---|---|---|---|---|---|---|---|
| Benchmark | [-] | 302. | |||||||||||||||
| Control | [-] | 303. | 303. | 304. | 302. | 303. | 1.10 | 2.25 | 0.247 | 0.579 | 0.782 | 0.974 | 0.998 | 0.913 | 0.838 | ||
| LMBIRCH | [-] | 303. | 303. | 304. | 302. | 303. | 1.10 | 2.25 | 0.247 | 0.579 | 0.783 | 0.974 | 0.998 | 0.913 | 0.838 | ||
| LMBIRCH2 | [-] | 303. | 303. | 304. | 302. | 303. | 1.09 | 2.25 | 0.247 | 0.579 | 0.782 | 0.974 | 0.997 | 0.913 | 0.838 | ||
| LUNA3 | [-] | 303. | 303. | 304. | 302. | 303. | 1.10 | 2.25 | 0.247 | 0.579 | 0.783 | 0.974 | 0.998 | 0.913 | 0.838 |
Download Data |
Period Mean (original grids) [K] |
Model Period Mean (intersection) [K] |
Model Period Mean (complement) [K] |
Benchmark Period Mean (intersection) [K] |
Benchmark Period Mean (complement) [K] |
Bias [K] |
RMSE [K] |
Phase Shift [months] |
Bias Score [1] |
RMSE Score [1] |
Seasonal Cycle Score [1] |
Spatial Distribution Score [1] |
Interannual Variability Score [1] |
Overall Score [1] |
|||
|---|---|---|---|---|---|---|---|---|---|---|---|---|---|---|---|---|---|
| Benchmark | [-] | 268. | |||||||||||||||
| Control | [-] | 267. | 267. | 268. | 268. | 268. | -0.138 | 1.62 | 0.0296 | 0.955 | 0.913 | 0.998 | 1.00 | 0.906 | 0.947 | ||
| LMBIRCH | [-] | 267. | 267. | 268. | 268. | 268. | -0.189 | 1.66 | 0.0296 | 0.953 | 0.911 | 0.998 | 1.00 | 0.906 | 0.947 | ||
| LMBIRCH2 | [-] | 267. | 267. | 268. | 268. | 268. | -0.163 | 1.64 | 0.0296 | 0.954 | 0.912 | 0.998 | 1.00 | 0.906 | 0.947 | ||
| LUNA3 | [-] | 267. | 267. | 268. | 268. | 268. | -0.184 | 1.66 | 0.0296 | 0.954 | 0.911 | 0.998 | 1.00 | 0.906 | 0.947 |
Download Data |
Period Mean (original grids) [K] |
Model Period Mean (intersection) [K] |
Model Period Mean (complement) [K] |
Benchmark Period Mean (intersection) [K] |
Benchmark Period Mean (complement) [K] |
Bias [K] |
RMSE [K] |
Phase Shift [months] |
Bias Score [1] |
RMSE Score [1] |
Seasonal Cycle Score [1] |
Spatial Distribution Score [1] |
Interannual Variability Score [1] |
Overall Score [1] |
|||
|---|---|---|---|---|---|---|---|---|---|---|---|---|---|---|---|---|---|
| Benchmark | [-] | 301. | |||||||||||||||
| Control | [-] | 303. | 304. | 298. | 301. | 299. | 1.73 | 2.13 | 0.141 | 0.660 | 0.861 | 0.989 | 0.998 | 0.899 | 0.878 | ||
| LMBIRCH | [-] | 303. | 304. | 298. | 301. | 299. | 1.72 | 2.13 | 0.139 | 0.661 | 0.861 | 0.989 | 0.998 | 0.899 | 0.878 | ||
| LMBIRCH2 | [-] | 303. | 304. | 298. | 301. | 299. | 1.73 | 2.14 | 0.141 | 0.660 | 0.861 | 0.989 | 0.998 | 0.898 | 0.878 | ||
| LUNA3 | [-] | 303. | 304. | 298. | 301. | 299. | 1.72 | 2.13 | 0.139 | 0.661 | 0.861 | 0.989 | 0.998 | 0.899 | 0.878 |
Download Data |
Period Mean (original grids) [K] |
Model Period Mean (intersection) [K] |
Model Period Mean (complement) [K] |
Benchmark Period Mean (intersection) [K] |
Benchmark Period Mean (complement) [K] |
Bias [K] |
RMSE [K] |
Phase Shift [months] |
Bias Score [1] |
RMSE Score [1] |
Seasonal Cycle Score [1] |
Spatial Distribution Score [1] |
Interannual Variability Score [1] |
Overall Score [1] |
|||
|---|---|---|---|---|---|---|---|---|---|---|---|---|---|---|---|---|---|
| Benchmark | [-] | 286. | |||||||||||||||
| Control | [-] | 286. | 286. | 287. | 286. | 285. | 0.365 | 1.59 | 0.215 | 0.863 | 0.886 | 0.986 | 0.998 | 0.925 | 0.924 | ||
| LMBIRCH | [-] | 286. | 286. | 287. | 286. | 285. | 0.357 | 1.60 | 0.194 | 0.863 | 0.884 | 0.987 | 0.998 | 0.925 | 0.923 | ||
| LMBIRCH2 | [-] | 286. | 286. | 287. | 286. | 285. | 0.366 | 1.59 | 0.208 | 0.863 | 0.887 | 0.986 | 0.998 | 0.925 | 0.924 | ||
| LUNA3 | [-] | 286. | 286. | 287. | 286. | 285. | 0.336 | 1.62 | 0.194 | 0.863 | 0.882 | 0.987 | 0.997 | 0.924 | 0.923 |
Download Data |
Period Mean (original grids) [K] |
Model Period Mean (intersection) [K] |
Model Period Mean (complement) [K] |
Benchmark Period Mean (intersection) [K] |
Benchmark Period Mean (complement) [K] |
Bias [K] |
RMSE [K] |
Phase Shift [months] |
Bias Score [1] |
RMSE Score [1] |
Seasonal Cycle Score [1] |
Spatial Distribution Score [1] |
Interannual Variability Score [1] |
Overall Score [1] |
|||
|---|---|---|---|---|---|---|---|---|---|---|---|---|---|---|---|---|---|
| Benchmark | [-] | 292. | |||||||||||||||
| Control | [-] | 289. | 293. | 259. | 292. | 296. | 1.10 | 2.06 | 0.215 | 0.676 | 0.822 | 0.976 | 0.997 | 0.904 | 0.866 | ||
| LMBIRCH | [-] | 289. | 293. | 259. | 292. | 296. | 1.10 | 2.06 | 0.213 | 0.677 | 0.822 | 0.976 | 0.997 | 0.904 | 0.866 | ||
| LMBIRCH2 | [-] | 289. | 293. | 259. | 292. | 296. | 1.10 | 2.06 | 0.215 | 0.676 | 0.822 | 0.976 | 0.997 | 0.904 | 0.866 | ||
| LUNA3 | [-] | 289. | 293. | 259. | 292. | 296. | 1.09 | 2.06 | 0.213 | 0.677 | 0.821 | 0.976 | 0.997 | 0.904 | 0.866 |
Download Data |
Period Mean (original grids) [K] |
Model Period Mean (intersection) [K] |
Model Period Mean (complement) [K] |
Benchmark Period Mean (intersection) [K] |
Benchmark Period Mean (complement) [K] |
Bias [K] |
RMSE [K] |
Phase Shift [months] |
Bias Score [1] |
RMSE Score [1] |
Seasonal Cycle Score [1] |
Spatial Distribution Score [1] |
Interannual Variability Score [1] |
Overall Score [1] |
|||
|---|---|---|---|---|---|---|---|---|---|---|---|---|---|---|---|---|---|
| Benchmark | [-] | 303. | |||||||||||||||
| Control | [-] | 304. | 304. | 299. | 303. | 299. | 1.61 | 2.31 | 0.162 | 0.724 | 0.877 | 0.987 | 0.998 | 0.907 | 0.895 | ||
| LMBIRCH | [-] | 304. | 304. | 299. | 303. | 299. | 1.61 | 2.31 | 0.161 | 0.724 | 0.877 | 0.987 | 0.998 | 0.907 | 0.895 | ||
| LMBIRCH2 | [-] | 304. | 304. | 299. | 303. | 299. | 1.61 | 2.31 | 0.159 | 0.724 | 0.877 | 0.987 | 0.998 | 0.907 | 0.895 | ||
| LUNA3 | [-] | 304. | 304. | 299. | 303. | 299. | 1.61 | 2.31 | 0.161 | 0.724 | 0.877 | 0.987 | 0.998 | 0.907 | 0.895 |
Download Data |
Period Mean (original grids) [K] |
Model Period Mean (intersection) [K] |
Model Period Mean (complement) [K] |
Benchmark Period Mean (intersection) [K] |
Benchmark Period Mean (complement) [K] |
Bias [K] |
RMSE [K] |
Phase Shift [months] |
Bias Score [1] |
RMSE Score [1] |
Seasonal Cycle Score [1] |
Spatial Distribution Score [1] |
Interannual Variability Score [1] |
Overall Score [1] |
|||
|---|---|---|---|---|---|---|---|---|---|---|---|---|---|---|---|---|---|
| Benchmark | [-] | 268. | |||||||||||||||
| Control | [-] | 269. | 269. | 268. | 268. | 271. | 0.480 | 1.95 | 0.0392 | 0.921 | 0.890 | 0.997 | 1.00 | 0.904 | 0.934 | ||
| LMBIRCH | [-] | 269. | 269. | 268. | 268. | 271. | 0.458 | 1.95 | 0.0392 | 0.921 | 0.890 | 0.997 | 1.00 | 0.904 | 0.934 | ||
| LMBIRCH2 | [-] | 269. | 269. | 268. | 268. | 271. | 0.469 | 1.95 | 0.0392 | 0.921 | 0.890 | 0.997 | 1.00 | 0.904 | 0.934 | ||
| LUNA3 | [-] | 269. | 269. | 268. | 268. | 271. | 0.440 | 1.96 | 0.0392 | 0.922 | 0.889 | 0.997 | 1.00 | 0.904 | 0.933 |
Download Data |
Period Mean (original grids) [K] |
Model Period Mean (intersection) [K] |
Model Period Mean (complement) [K] |
Benchmark Period Mean (intersection) [K] |
Benchmark Period Mean (complement) [K] |
Bias [K] |
RMSE [K] |
Phase Shift [months] |
Bias Score [1] |
RMSE Score [1] |
Seasonal Cycle Score [1] |
Spatial Distribution Score [1] |
Interannual Variability Score [1] |
Overall Score [1] |
|||
|---|---|---|---|---|---|---|---|---|---|---|---|---|---|---|---|---|---|
| Benchmark | [-] | 302. | |||||||||||||||
| Control | [-] | 303. | 303. | 303. | 302. | 303. | 1.04 | 2.28 | 0.473 | 0.535 | 0.713 | 0.942 | 0.973 | 0.880 | 0.793 | ||
| LMBIRCH | [-] | 303. | 303. | 303. | 302. | 303. | 1.04 | 2.28 | 0.473 | 0.535 | 0.713 | 0.942 | 0.973 | 0.880 | 0.793 | ||
| LMBIRCH2 | [-] | 303. | 303. | 303. | 302. | 303. | 1.04 | 2.28 | 0.473 | 0.535 | 0.713 | 0.942 | 0.972 | 0.880 | 0.792 | ||
| LUNA3 | [-] | 303. | 303. | 303. | 302. | 303. | 1.04 | 2.28 | 0.473 | 0.535 | 0.713 | 0.942 | 0.973 | 0.880 | 0.793 |
Download Data |
Period Mean (original grids) [K] |
Model Period Mean (intersection) [K] |
Model Period Mean (complement) [K] |
Benchmark Period Mean (intersection) [K] |
Benchmark Period Mean (complement) [K] |
Bias [K] |
RMSE [K] |
Phase Shift [months] |
Bias Score [1] |
RMSE Score [1] |
Seasonal Cycle Score [1] |
Spatial Distribution Score [1] |
Interannual Variability Score [1] |
Overall Score [1] |
|||
|---|---|---|---|---|---|---|---|---|---|---|---|---|---|---|---|---|---|
| Benchmark | [-] | 292. | |||||||||||||||
| Control | [-] | 293. | 293. | 299. | 292. | 294. | 0.927 | 1.42 | 0.0872 | 0.875 | 0.922 | 0.994 | 0.996 | 0.956 | 0.944 | ||
| LMBIRCH | [-] | 293. | 293. | 299. | 292. | 294. | 0.932 | 1.42 | 0.0872 | 0.875 | 0.923 | 0.994 | 0.996 | 0.957 | 0.945 | ||
| LMBIRCH2 | [-] | 293. | 293. | 299. | 292. | 294. | 0.928 | 1.41 | 0.0872 | 0.875 | 0.923 | 0.994 | 0.996 | 0.957 | 0.945 | ||
| LUNA3 | [-] | 293. | 293. | 299. | 292. | 294. | 0.927 | 1.42 | 0.0872 | 0.875 | 0.921 | 0.994 | 0.996 | 0.956 | 0.944 |
Download Data |
Period Mean (original grids) [K] |
Model Period Mean (intersection) [K] |
Model Period Mean (complement) [K] |
Benchmark Period Mean (intersection) [K] |
Benchmark Period Mean (complement) [K] |
Bias [K] |
RMSE [K] |
Phase Shift [months] |
Bias Score [1] |
RMSE Score [1] |
Seasonal Cycle Score [1] |
Spatial Distribution Score [1] |
Interannual Variability Score [1] |
Overall Score [1] |
|||
|---|---|---|---|---|---|---|---|---|---|---|---|---|---|---|---|---|---|
| Benchmark | [-] | 279. | |||||||||||||||
| Control | [-] | 280. | 280. | 281. | 279. | 282. | 0.535 | 1.41 | 0.0533 | 0.916 | 0.918 | 0.996 | 0.998 | 0.953 | 0.950 | ||
| LMBIRCH | [-] | 280. | 280. | 281. | 279. | 282. | 0.536 | 1.42 | 0.0520 | 0.916 | 0.917 | 0.997 | 0.998 | 0.953 | 0.950 | ||
| LMBIRCH2 | [-] | 280. | 280. | 281. | 279. | 282. | 0.535 | 1.41 | 0.0533 | 0.916 | 0.918 | 0.996 | 0.998 | 0.953 | 0.950 | ||
| LUNA3 | [-] | 280. | 280. | 281. | 279. | 282. | 0.517 | 1.43 | 0.0520 | 0.917 | 0.915 | 0.997 | 0.998 | 0.953 | 0.949 |
Download Data |
Period Mean (original grids) [K] |
Model Period Mean (intersection) [K] |
Model Period Mean (complement) [K] |
Benchmark Period Mean (intersection) [K] |
Benchmark Period Mean (complement) [K] |
Bias [K] |
RMSE [K] |
Phase Shift [months] |
Bias Score [1] |
RMSE Score [1] |
Seasonal Cycle Score [1] |
Spatial Distribution Score [1] |
Interannual Variability Score [1] |
Overall Score [1] |
|||
|---|---|---|---|---|---|---|---|---|---|---|---|---|---|---|---|---|---|
| Benchmark | [-] | 291. | |||||||||||||||
| Control | [-] | 292. | 292. | 292. | 291. | 294. | 1.23 | 2.09 | 0.0613 | 0.827 | 0.893 | 0.996 | 0.997 | 0.933 | 0.923 | ||
| LMBIRCH | [-] | 292. | 292. | 292. | 291. | 294. | 1.23 | 2.09 | 0.0574 | 0.827 | 0.893 | 0.996 | 0.997 | 0.934 | 0.923 | ||
| LMBIRCH2 | [-] | 292. | 292. | 292. | 291. | 294. | 1.23 | 2.09 | 0.0613 | 0.827 | 0.893 | 0.996 | 0.997 | 0.932 | 0.923 | ||
| LUNA3 | [-] | 292. | 292. | 292. | 291. | 294. | 1.22 | 2.09 | 0.0574 | 0.828 | 0.892 | 0.996 | 0.997 | 0.934 | 0.923 |
Download Data |
Period Mean (original grids) [K] |
Model Period Mean (intersection) [K] |
Model Period Mean (complement) [K] |
Benchmark Period Mean (intersection) [K] |
Benchmark Period Mean (complement) [K] |
Bias [K] |
RMSE [K] |
Phase Shift [months] |
Bias Score [1] |
RMSE Score [1] |
Seasonal Cycle Score [1] |
Spatial Distribution Score [1] |
Interannual Variability Score [1] |
Overall Score [1] |
|||
|---|---|---|---|---|---|---|---|---|---|---|---|---|---|---|---|---|---|
| Benchmark | [-] | 304. | |||||||||||||||
| Control | [-] | 306. | 306. | 304. | 304. | 304. | 1.68 | 2.12 | 0.483 | 0.243 | 0.634 | 0.936 | 1.00 | 0.899 | 0.724 | ||
| LMBIRCH | [-] | 306. | 306. | 304. | 304. | 304. | 1.68 | 2.12 | 0.483 | 0.243 | 0.634 | 0.936 | 1.00 | 0.899 | 0.724 | ||
| LMBIRCH2 | [-] | 306. | 306. | 304. | 304. | 304. | 1.67 | 2.12 | 0.474 | 0.244 | 0.634 | 0.937 | 1.00 | 0.899 | 0.725 | ||
| LUNA3 | [-] | 306. | 306. | 304. | 304. | 304. | 1.68 | 2.12 | 0.483 | 0.243 | 0.634 | 0.936 | 1.00 | 0.899 | 0.724 |
Download Data |
Period Mean (original grids) [K] |
Model Period Mean (intersection) [K] |
Model Period Mean (complement) [K] |
Benchmark Period Mean (intersection) [K] |
Benchmark Period Mean (complement) [K] |
Bias [K] |
RMSE [K] |
Phase Shift [months] |
Bias Score [1] |
RMSE Score [1] |
Seasonal Cycle Score [1] |
Spatial Distribution Score [1] |
Interannual Variability Score [1] |
Overall Score [1] |
|||
|---|---|---|---|---|---|---|---|---|---|---|---|---|---|---|---|---|---|
| Benchmark | [-] | 301. | |||||||||||||||
| Control | [-] | 303. | 303. | 300. | 301. | 300. | 1.67 | 1.97 | 0.332 | 0.487 | 0.760 | 0.958 | 0.996 | 0.921 | 0.814 | ||
| LMBIRCH | [-] | 303. | 303. | 300. | 301. | 300. | 1.67 | 1.96 | 0.332 | 0.488 | 0.760 | 0.958 | 0.996 | 0.922 | 0.814 | ||
| LMBIRCH2 | [-] | 303. | 303. | 300. | 301. | 300. | 1.67 | 1.97 | 0.340 | 0.487 | 0.762 | 0.957 | 0.996 | 0.921 | 0.814 | ||
| LUNA3 | [-] | 303. | 303. | 300. | 301. | 300. | 1.67 | 1.96 | 0.332 | 0.488 | 0.760 | 0.958 | 0.996 | 0.922 | 0.814 |
Download Data |
Period Mean (original grids) [K] |
Model Period Mean (intersection) [K] |
Model Period Mean (complement) [K] |
Benchmark Period Mean (intersection) [K] |
Benchmark Period Mean (complement) [K] |
Bias [K] |
RMSE [K] |
Phase Shift [months] |
Bias Score [1] |
RMSE Score [1] |
Seasonal Cycle Score [1] |
Spatial Distribution Score [1] |
Interannual Variability Score [1] |
Overall Score [1] |
|||
|---|---|---|---|---|---|---|---|---|---|---|---|---|---|---|---|---|---|
| Benchmark | [-] | 290. | |||||||||||||||
| Control | [-] | 292. | 292. | 293. | 290. | 288. | 1.66 | 3.01 | 0.368 | 0.527 | 0.734 | 0.951 | 0.988 | 0.911 | 0.808 | ||
| LMBIRCH | [-] | 292. | 292. | 293. | 290. | 288. | 1.67 | 3.01 | 0.368 | 0.527 | 0.734 | 0.951 | 0.989 | 0.912 | 0.808 | ||
| LMBIRCH2 | [-] | 292. | 292. | 293. | 290. | 288. | 1.66 | 3.00 | 0.387 | 0.527 | 0.734 | 0.947 | 0.988 | 0.912 | 0.807 | ||
| LUNA3 | [-] | 292. | 292. | 293. | 290. | 288. | 1.66 | 3.01 | 0.354 | 0.527 | 0.732 | 0.952 | 0.988 | 0.912 | 0.807 |
Temporally integrated period mean