Mean State
Download Data |
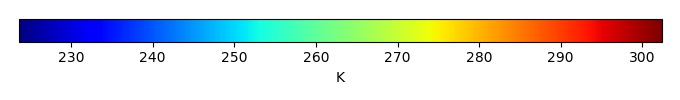
Period Mean (original grids) [K] |
Model Period Mean (intersection) [K] |
Model Period Mean (complement) [K] |
Benchmark Period Mean (intersection) [K] |
Benchmark Period Mean (complement) [K] |
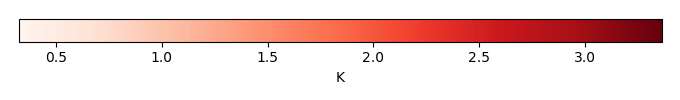
Bias [K] |
RMSE [K] |
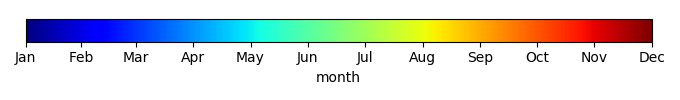
Phase Shift [months] |
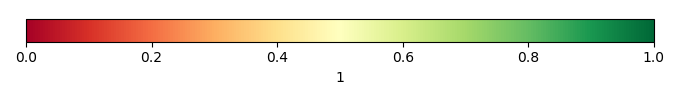
Bias Score [1] |
RMSE Score [1] |
Seasonal Cycle Score [1] |
Spatial Distribution Score [1] |
Interannual Variability Score [1] |
Overall Score [1] |
|||
|---|---|---|---|---|---|---|---|---|---|---|---|---|---|---|---|---|---|
| Benchmark | [-] | 299. | |||||||||||||||
| Control | [-] | 299. | 299. | 300. | 298. | 301. | 0.319 | 0.921 | 0.480 | 0.608 | 0.744 | 0.954 | 1.00 | 0.943 | 0.832 | ||
| LMBIRCH | [-] | 299. | 299. | 300. | 298. | 301. | 0.319 | 0.921 | 0.480 | 0.608 | 0.744 | 0.954 | 1.00 | 0.943 | 0.832 | ||
| LMBIRCH2 | [-] | 299. | 299. | 300. | 298. | 301. | 0.285 | 0.915 | 0.486 | 0.620 | 0.737 | 0.953 | 1.00 | 0.942 | 0.832 | ||
| LUNA3 | [-] | 299. | 299. | 300. | 298. | 301. | 0.319 | 0.921 | 0.480 | 0.608 | 0.744 | 0.954 | 1.00 | 0.943 | 0.832 |
Download Data |
Period Mean (original grids) [K] |
Model Period Mean (intersection) [K] |
Model Period Mean (complement) [K] |
Benchmark Period Mean (intersection) [K] |
Benchmark Period Mean (complement) [K] |
Bias [K] |
RMSE [K] |
Phase Shift [months] |
Bias Score [1] |
RMSE Score [1] |
Seasonal Cycle Score [1] |
Spatial Distribution Score [1] |
Interannual Variability Score [1] |
Overall Score [1] |
|||
|---|---|---|---|---|---|---|---|---|---|---|---|---|---|---|---|---|---|
| Benchmark | [-] | 300. | |||||||||||||||
| Control | [-] | 301. | 301. | 300. | 300. | 300. | 0.477 | 1.07 | 0.220 | 0.712 | 0.810 | 0.983 | 0.984 | 0.949 | 0.875 | ||
| LMBIRCH | [-] | 301. | 301. | 300. | 300. | 300. | 0.479 | 1.07 | 0.220 | 0.712 | 0.810 | 0.983 | 0.984 | 0.949 | 0.875 | ||
| LMBIRCH2 | [-] | 301. | 301. | 300. | 300. | 300. | 0.460 | 1.07 | 0.223 | 0.715 | 0.808 | 0.983 | 0.986 | 0.949 | 0.875 | ||
| LUNA3 | [-] | 301. | 301. | 300. | 300. | 300. | 0.479 | 1.07 | 0.220 | 0.712 | 0.810 | 0.983 | 0.984 | 0.949 | 0.875 |
Download Data |
Period Mean (original grids) [K] |
Model Period Mean (intersection) [K] |
Model Period Mean (complement) [K] |
Benchmark Period Mean (intersection) [K] |
Benchmark Period Mean (complement) [K] |
Bias [K] |
RMSE [K] |
Phase Shift [months] |
Bias Score [1] |
RMSE Score [1] |
Seasonal Cycle Score [1] |
Spatial Distribution Score [1] |
Interannual Variability Score [1] |
Overall Score [1] |
|||
|---|---|---|---|---|---|---|---|---|---|---|---|---|---|---|---|---|---|
| Benchmark | [-] | 295. | |||||||||||||||
| Control | [-] | 296. | 296. | 297. | 295. | 295. | 0.542 | 1.11 | 0.358 | 0.669 | 0.832 | 0.958 | 1.00 | 0.938 | 0.872 | ||
| LMBIRCH | [-] | 296. | 296. | 297. | 295. | 295. | 0.547 | 1.12 | 0.355 | 0.669 | 0.833 | 0.958 | 1.00 | 0.938 | 0.872 | ||
| LMBIRCH2 | [-] | 296. | 296. | 297. | 295. | 295. | 0.512 | 1.11 | 0.351 | 0.676 | 0.826 | 0.960 | 1.00 | 0.939 | 0.871 | ||
| LUNA3 | [-] | 296. | 296. | 297. | 295. | 295. | 0.547 | 1.12 | 0.355 | 0.669 | 0.833 | 0.958 | 1.00 | 0.938 | 0.872 |
Download Data |
Period Mean (original grids) [K] |
Model Period Mean (intersection) [K] |
Model Period Mean (complement) [K] |
Benchmark Period Mean (intersection) [K] |
Benchmark Period Mean (complement) [K] |
Bias [K] |
RMSE [K] |
Phase Shift [months] |
Bias Score [1] |
RMSE Score [1] |
Seasonal Cycle Score [1] |
Spatial Distribution Score [1] |
Interannual Variability Score [1] |
Overall Score [1] |
|||
|---|---|---|---|---|---|---|---|---|---|---|---|---|---|---|---|---|---|
| Benchmark | [-] | 262. | |||||||||||||||
| Control | [-] | 262. | 261. | 266. | 262. | 267. | 0.525 | 1.77 | 0.0284 | 0.917 | 0.935 | 0.998 | 0.998 | 0.925 | 0.951 | ||
| LMBIRCH | [-] | 262. | 262. | 266. | 262. | 267. | 0.575 | 1.77 | 0.0284 | 0.917 | 0.936 | 0.998 | 0.999 | 0.924 | 0.952 | ||
| LMBIRCH2 | [-] | 262. | 262. | 266. | 262. | 267. | 0.575 | 1.76 | 0.0284 | 0.917 | 0.936 | 0.998 | 0.999 | 0.924 | 0.952 | ||
| LUNA3 | [-] | 262. | 262. | 266. | 262. | 267. | 0.559 | 1.76 | 0.0284 | 0.917 | 0.936 | 0.998 | 0.999 | 0.925 | 0.952 |
Download Data |
Period Mean (original grids) [K] |
Model Period Mean (intersection) [K] |
Model Period Mean (complement) [K] |
Benchmark Period Mean (intersection) [K] |
Benchmark Period Mean (complement) [K] |
Bias [K] |
RMSE [K] |
Phase Shift [months] |
Bias Score [1] |
RMSE Score [1] |
Seasonal Cycle Score [1] |
Spatial Distribution Score [1] |
Interannual Variability Score [1] |
Overall Score [1] |
|||
|---|---|---|---|---|---|---|---|---|---|---|---|---|---|---|---|---|---|
| Benchmark | [-] | 299. | |||||||||||||||
| Control | [-] | 299. | 299. | 300. | 299. | 299. | 0.301 | 1.02 | 0.513 | 0.369 | 0.666 | 0.926 | 0.899 | 0.892 | 0.736 | ||
| LMBIRCH | [-] | 299. | 299. | 300. | 299. | 299. | 0.301 | 1.02 | 0.513 | 0.369 | 0.666 | 0.926 | 0.899 | 0.892 | 0.736 | ||
| LMBIRCH2 | [-] | 299. | 299. | 300. | 299. | 299. | 0.288 | 1.02 | 0.513 | 0.370 | 0.665 | 0.926 | 0.900 | 0.893 | 0.736 | ||
| LUNA3 | [-] | 299. | 299. | 300. | 299. | 299. | 0.301 | 1.02 | 0.513 | 0.369 | 0.666 | 0.926 | 0.899 | 0.892 | 0.736 |
Download Data |
Period Mean (original grids) [K] |
Model Period Mean (intersection) [K] |
Model Period Mean (complement) [K] |
Benchmark Period Mean (intersection) [K] |
Benchmark Period Mean (complement) [K] |
Bias [K] |
RMSE [K] |
Phase Shift [months] |
Bias Score [1] |
RMSE Score [1] |
Seasonal Cycle Score [1] |
Spatial Distribution Score [1] |
Interannual Variability Score [1] |
Overall Score [1] |
|||
|---|---|---|---|---|---|---|---|---|---|---|---|---|---|---|---|---|---|
| Benchmark | [-] | 271. | |||||||||||||||
| Control | [-] | 271. | 271. | 274. | 271. | 273. | -0.0187 | 0.894 | 0.00953 | 0.954 | 0.964 | 0.999 | 1.00 | 0.975 | 0.976 | ||
| LMBIRCH | [-] | 271. | 271. | 274. | 271. | 273. | 0.00315 | 0.901 | 0.00953 | 0.954 | 0.963 | 0.999 | 1.00 | 0.974 | 0.976 | ||
| LMBIRCH2 | [-] | 271. | 271. | 274. | 271. | 273. | -0.0200 | 0.892 | 0.00953 | 0.954 | 0.964 | 0.999 | 1.00 | 0.975 | 0.976 | ||
| LUNA3 | [-] | 271. | 271. | 274. | 271. | 273. | 0.00422 | 0.922 | 0.00953 | 0.954 | 0.961 | 0.999 | 1.00 | 0.974 | 0.975 |
Download Data |
Period Mean (original grids) [K] |
Model Period Mean (intersection) [K] |
Model Period Mean (complement) [K] |
Benchmark Period Mean (intersection) [K] |
Benchmark Period Mean (complement) [K] |
Bias [K] |
RMSE [K] |
Phase Shift [months] |
Bias Score [1] |
RMSE Score [1] |
Seasonal Cycle Score [1] |
Spatial Distribution Score [1] |
Interannual Variability Score [1] |
Overall Score [1] |
|||
|---|---|---|---|---|---|---|---|---|---|---|---|---|---|---|---|---|---|
| Benchmark | [-] | 280. | |||||||||||||||
| Control | [-] | 281. | 280. | 287. | 280. | 287. | 0.331 | 1.59 | 0.0305 | 0.874 | 0.942 | 0.998 | 1.00 | 0.956 | 0.952 | ||
| LMBIRCH | [-] | 281. | 280. | 287. | 280. | 287. | 0.348 | 1.59 | 0.0299 | 0.873 | 0.942 | 0.998 | 1.00 | 0.955 | 0.952 | ||
| LMBIRCH2 | [-] | 281. | 280. | 287. | 280. | 287. | 0.325 | 1.59 | 0.0297 | 0.874 | 0.942 | 0.998 | 1.00 | 0.955 | 0.952 | ||
| LUNA3 | [-] | 281. | 280. | 287. | 280. | 287. | 0.350 | 1.60 | 0.0299 | 0.873 | 0.942 | 0.998 | 1.00 | 0.956 | 0.952 |
Download Data |
Period Mean (original grids) [K] |
Model Period Mean (intersection) [K] |
Model Period Mean (complement) [K] |
Benchmark Period Mean (intersection) [K] |
Benchmark Period Mean (complement) [K] |
Bias [K] |
RMSE [K] |
Phase Shift [months] |
Bias Score [1] |
RMSE Score [1] |
Seasonal Cycle Score [1] |
Spatial Distribution Score [1] |
Interannual Variability Score [1] |
Overall Score [1] |
|||
|---|---|---|---|---|---|---|---|---|---|---|---|---|---|---|---|---|---|
| Benchmark | [-] | 297. | |||||||||||||||
| Control | [-] | 297. | 297. | 300. | 297. | 299. | 0.0496 | 1.55 | 0.280 | 0.716 | 0.834 | 0.972 | 0.997 | 0.927 | 0.880 | ||
| LMBIRCH | [-] | 297. | 297. | 300. | 297. | 299. | 0.0538 | 1.55 | 0.280 | 0.716 | 0.834 | 0.972 | 0.997 | 0.928 | 0.880 | ||
| LMBIRCH2 | [-] | 297. | 297. | 300. | 297. | 299. | 0.0299 | 1.55 | 0.271 | 0.717 | 0.833 | 0.973 | 0.997 | 0.928 | 0.880 | ||
| LUNA3 | [-] | 297. | 297. | 300. | 297. | 299. | 0.0580 | 1.55 | 0.280 | 0.716 | 0.835 | 0.972 | 0.997 | 0.927 | 0.880 |
Download Data |
Period Mean (original grids) [K] |
Model Period Mean (intersection) [K] |
Model Period Mean (complement) [K] |
Benchmark Period Mean (intersection) [K] |
Benchmark Period Mean (complement) [K] |
Bias [K] |
RMSE [K] |
Phase Shift [months] |
Bias Score [1] |
RMSE Score [1] |
Seasonal Cycle Score [1] |
Spatial Distribution Score [1] |
Interannual Variability Score [1] |
Overall Score [1] |
|||
|---|---|---|---|---|---|---|---|---|---|---|---|---|---|---|---|---|---|
| Benchmark | [-] | 264. | |||||||||||||||
| Control | [-] | 264. | 264. | 266. | 264. | 265. | 0.136 | 1.03 | 0.0225 | 0.953 | 0.955 | 0.998 | 0.999 | 0.955 | 0.969 | ||
| LMBIRCH | [-] | 264. | 264. | 266. | 264. | 265. | 0.162 | 1.04 | 0.0225 | 0.953 | 0.954 | 0.998 | 0.999 | 0.954 | 0.969 | ||
| LMBIRCH2 | [-] | 264. | 264. | 266. | 264. | 265. | 0.165 | 1.03 | 0.0225 | 0.953 | 0.954 | 0.998 | 1.00 | 0.954 | 0.969 | ||
| LUNA3 | [-] | 264. | 264. | 266. | 264. | 265. | 0.145 | 1.04 | 0.0225 | 0.953 | 0.953 | 0.998 | 1.00 | 0.954 | 0.969 |
Download Data |
Period Mean (original grids) [K] |
Model Period Mean (intersection) [K] |
Model Period Mean (complement) [K] |
Benchmark Period Mean (intersection) [K] |
Benchmark Period Mean (complement) [K] |
Bias [K] |
RMSE [K] |
Phase Shift [months] |
Bias Score [1] |
RMSE Score [1] |
Seasonal Cycle Score [1] |
Spatial Distribution Score [1] |
Interannual Variability Score [1] |
Overall Score [1] |
|||
|---|---|---|---|---|---|---|---|---|---|---|---|---|---|---|---|---|---|
| Benchmark | [-] | 295. | |||||||||||||||
| Control | [-] | 295. | 295. | 293. | 295. | 294. | 0.517 | 0.896 | 0.113 | 0.855 | 0.903 | 0.992 | 0.999 | 0.949 | 0.934 | ||
| LMBIRCH | [-] | 295. | 295. | 293. | 295. | 294. | 0.527 | 0.898 | 0.117 | 0.855 | 0.904 | 0.992 | 0.999 | 0.949 | 0.934 | ||
| LMBIRCH2 | [-] | 295. | 295. | 293. | 295. | 294. | 0.510 | 0.893 | 0.107 | 0.856 | 0.904 | 0.992 | 0.999 | 0.949 | 0.934 | ||
| LUNA3 | [-] | 295. | 295. | 293. | 295. | 294. | 0.529 | 0.899 | 0.111 | 0.855 | 0.904 | 0.992 | 0.999 | 0.949 | 0.934 |
Download Data |
Period Mean (original grids) [K] |
Model Period Mean (intersection) [K] |
Model Period Mean (complement) [K] |
Benchmark Period Mean (intersection) [K] |
Benchmark Period Mean (complement) [K] |
Bias [K] |
RMSE [K] |
Phase Shift [months] |
Bias Score [1] |
RMSE Score [1] |
Seasonal Cycle Score [1] |
Spatial Distribution Score [1] |
Interannual Variability Score [1] |
Overall Score [1] |
|||
|---|---|---|---|---|---|---|---|---|---|---|---|---|---|---|---|---|---|
| Benchmark | [-] | 282. | |||||||||||||||
| Control | [-] | 282. | 282. | 284. | 282. | 283. | 0.134 | 1.29 | 0.169 | 0.863 | 0.914 | 0.989 | 1.00 | 0.948 | 0.938 | ||
| LMBIRCH | [-] | 282. | 282. | 284. | 282. | 283. | 0.183 | 1.30 | 0.167 | 0.862 | 0.913 | 0.989 | 1.00 | 0.948 | 0.937 | ||
| LMBIRCH2 | [-] | 282. | 282. | 284. | 282. | 283. | 0.121 | 1.29 | 0.171 | 0.863 | 0.914 | 0.989 | 1.00 | 0.947 | 0.938 | ||
| LUNA3 | [-] | 282. | 282. | 284. | 282. | 283. | 0.180 | 1.31 | 0.167 | 0.861 | 0.912 | 0.989 | 0.999 | 0.948 | 0.937 |
Download Data |
Period Mean (original grids) [K] |
Model Period Mean (intersection) [K] |
Model Period Mean (complement) [K] |
Benchmark Period Mean (intersection) [K] |
Benchmark Period Mean (complement) [K] |
Bias [K] |
RMSE [K] |
Phase Shift [months] |
Bias Score [1] |
RMSE Score [1] |
Seasonal Cycle Score [1] |
Spatial Distribution Score [1] |
Interannual Variability Score [1] |
Overall Score [1] |
|||
|---|---|---|---|---|---|---|---|---|---|---|---|---|---|---|---|---|---|
| Benchmark | [-] | 287. | |||||||||||||||
| Control | [-] | 283. | 287. | 256. | 287. | 293. | 0.270 | 1.27 | 0.184 | 0.797 | 0.879 | 0.980 | 1.00 | 0.945 | 0.913 | ||
| LMBIRCH | [-] | 283. | 287. | 256. | 287. | 293. | 0.285 | 1.27 | 0.183 | 0.796 | 0.879 | 0.980 | 1.00 | 0.945 | 0.913 | ||
| LMBIRCH2 | [-] | 283. | 287. | 256. | 287. | 293. | 0.261 | 1.27 | 0.182 | 0.798 | 0.878 | 0.981 | 1.00 | 0.945 | 0.913 | ||
| LUNA3 | [-] | 283. | 287. | 256. | 287. | 293. | 0.286 | 1.28 | 0.183 | 0.796 | 0.879 | 0.981 | 1.00 | 0.945 | 0.913 |
Download Data |
Period Mean (original grids) [K] |
Model Period Mean (intersection) [K] |
Model Period Mean (complement) [K] |
Benchmark Period Mean (intersection) [K] |
Benchmark Period Mean (complement) [K] |
Bias [K] |
RMSE [K] |
Phase Shift [months] |
Bias Score [1] |
RMSE Score [1] |
Seasonal Cycle Score [1] |
Spatial Distribution Score [1] |
Interannual Variability Score [1] |
Overall Score [1] |
|||
|---|---|---|---|---|---|---|---|---|---|---|---|---|---|---|---|---|---|
| Benchmark | [-] | 296. | |||||||||||||||
| Control | [-] | 296. | 296. | 295. | 296. | 295. | 0.179 | 1.18 | 0.169 | 0.868 | 0.919 | 0.987 | 1.00 | 0.952 | 0.941 | ||
| LMBIRCH | [-] | 296. | 296. | 295. | 296. | 295. | 0.186 | 1.18 | 0.166 | 0.868 | 0.919 | 0.988 | 0.999 | 0.952 | 0.941 | ||
| LMBIRCH2 | [-] | 296. | 296. | 295. | 296. | 295. | 0.174 | 1.18 | 0.170 | 0.868 | 0.919 | 0.987 | 1.00 | 0.952 | 0.941 | ||
| LUNA3 | [-] | 296. | 296. | 295. | 296. | 295. | 0.186 | 1.18 | 0.166 | 0.868 | 0.919 | 0.988 | 0.999 | 0.952 | 0.941 |
Download Data |
Period Mean (original grids) [K] |
Model Period Mean (intersection) [K] |
Model Period Mean (complement) [K] |
Benchmark Period Mean (intersection) [K] |
Benchmark Period Mean (complement) [K] |
Bias [K] |
RMSE [K] |
Phase Shift [months] |
Bias Score [1] |
RMSE Score [1] |
Seasonal Cycle Score [1] |
Spatial Distribution Score [1] |
Interannual Variability Score [1] |
Overall Score [1] |
|||
|---|---|---|---|---|---|---|---|---|---|---|---|---|---|---|---|---|---|
| Benchmark | [-] | 265. | |||||||||||||||
| Control | [-] | 265. | 265. | 265. | 265. | 268. | 0.467 | 1.51 | 0.0339 | 0.920 | 0.931 | 0.998 | 1.00 | 0.947 | 0.954 | ||
| LMBIRCH | [-] | 265. | 265. | 265. | 265. | 268. | 0.500 | 1.52 | 0.0339 | 0.919 | 0.930 | 0.998 | 1.00 | 0.947 | 0.954 | ||
| LMBIRCH2 | [-] | 265. | 265. | 265. | 265. | 268. | 0.490 | 1.51 | 0.0339 | 0.920 | 0.931 | 0.998 | 1.00 | 0.947 | 0.954 | ||
| LUNA3 | [-] | 265. | 265. | 265. | 265. | 268. | 0.481 | 1.52 | 0.0339 | 0.920 | 0.930 | 0.998 | 1.00 | 0.947 | 0.954 |
Download Data |
Period Mean (original grids) [K] |
Model Period Mean (intersection) [K] |
Model Period Mean (complement) [K] |
Benchmark Period Mean (intersection) [K] |
Benchmark Period Mean (complement) [K] |
Bias [K] |
RMSE [K] |
Phase Shift [months] |
Bias Score [1] |
RMSE Score [1] |
Seasonal Cycle Score [1] |
Spatial Distribution Score [1] |
Interannual Variability Score [1] |
Overall Score [1] |
|||
|---|---|---|---|---|---|---|---|---|---|---|---|---|---|---|---|---|---|
| Benchmark | [-] | 296. | |||||||||||||||
| Control | [-] | 296. | 295. | 298. | 296. | 299. | 0.462 | 1.69 | 0.410 | 0.616 | 0.807 | 0.957 | 0.999 | 0.913 | 0.850 | ||
| LMBIRCH | [-] | 296. | 295. | 298. | 296. | 299. | 0.463 | 1.69 | 0.410 | 0.616 | 0.807 | 0.957 | 0.999 | 0.913 | 0.850 | ||
| LMBIRCH2 | [-] | 296. | 295. | 298. | 296. | 299. | 0.448 | 1.69 | 0.410 | 0.616 | 0.806 | 0.957 | 0.999 | 0.913 | 0.850 | ||
| LUNA3 | [-] | 296. | 295. | 298. | 296. | 299. | 0.465 | 1.69 | 0.410 | 0.616 | 0.807 | 0.957 | 0.999 | 0.913 | 0.850 |
Download Data |
Period Mean (original grids) [K] |
Model Period Mean (intersection) [K] |
Model Period Mean (complement) [K] |
Benchmark Period Mean (intersection) [K] |
Benchmark Period Mean (complement) [K] |
Bias [K] |
RMSE [K] |
Phase Shift [months] |
Bias Score [1] |
RMSE Score [1] |
Seasonal Cycle Score [1] |
Spatial Distribution Score [1] |
Interannual Variability Score [1] |
Overall Score [1] |
|||
|---|---|---|---|---|---|---|---|---|---|---|---|---|---|---|---|---|---|
| Benchmark | [-] | 286. | |||||||||||||||
| Control | [-] | 286. | 286. | 294. | 286. | 289. | 0.302 | 0.907 | 0.0390 | 0.918 | 0.941 | 0.997 | 0.999 | 0.962 | 0.960 | ||
| LMBIRCH | [-] | 286. | 286. | 294. | 286. | 289. | 0.319 | 0.912 | 0.0390 | 0.917 | 0.942 | 0.997 | 0.999 | 0.962 | 0.960 | ||
| LMBIRCH2 | [-] | 286. | 286. | 294. | 286. | 289. | 0.265 | 0.893 | 0.0390 | 0.920 | 0.942 | 0.997 | 0.999 | 0.962 | 0.960 | ||
| LUNA3 | [-] | 286. | 286. | 294. | 286. | 289. | 0.335 | 0.920 | 0.0390 | 0.917 | 0.941 | 0.997 | 0.999 | 0.962 | 0.960 |
Download Data |
Period Mean (original grids) [K] |
Model Period Mean (intersection) [K] |
Model Period Mean (complement) [K] |
Benchmark Period Mean (intersection) [K] |
Benchmark Period Mean (complement) [K] |
Bias [K] |
RMSE [K] |
Phase Shift [months] |
Bias Score [1] |
RMSE Score [1] |
Seasonal Cycle Score [1] |
Spatial Distribution Score [1] |
Interannual Variability Score [1] |
Overall Score [1] |
|||
|---|---|---|---|---|---|---|---|---|---|---|---|---|---|---|---|---|---|
| Benchmark | [-] | 275. | |||||||||||||||
| Control | [-] | 274. | 274. | 278. | 275. | 279. | 0.0828 | 1.03 | 0.0502 | 0.924 | 0.942 | 0.997 | 0.998 | 0.962 | 0.960 | ||
| LMBIRCH | [-] | 274. | 274. | 278. | 275. | 279. | 0.107 | 1.03 | 0.0528 | 0.924 | 0.941 | 0.996 | 0.998 | 0.962 | 0.960 | ||
| LMBIRCH2 | [-] | 274. | 274. | 278. | 275. | 279. | 0.0798 | 1.03 | 0.0502 | 0.924 | 0.941 | 0.997 | 0.998 | 0.962 | 0.961 | ||
| LUNA3 | [-] | 274. | 274. | 278. | 275. | 279. | 0.135 | 1.04 | 0.0528 | 0.923 | 0.940 | 0.996 | 0.998 | 0.962 | 0.960 |
Download Data |
Period Mean (original grids) [K] |
Model Period Mean (intersection) [K] |
Model Period Mean (complement) [K] |
Benchmark Period Mean (intersection) [K] |
Benchmark Period Mean (complement) [K] |
Bias [K] |
RMSE [K] |
Phase Shift [months] |
Bias Score [1] |
RMSE Score [1] |
Seasonal Cycle Score [1] |
Spatial Distribution Score [1] |
Interannual Variability Score [1] |
Overall Score [1] |
|||
|---|---|---|---|---|---|---|---|---|---|---|---|---|---|---|---|---|---|
| Benchmark | [-] | 284. | |||||||||||||||
| Control | [-] | 284. | 284. | 288. | 284. | 289. | 0.458 | 1.63 | 0.0383 | 0.842 | 0.914 | 0.997 | 1.00 | 0.951 | 0.937 | ||
| LMBIRCH | [-] | 284. | 284. | 288. | 284. | 289. | 0.474 | 1.64 | 0.0383 | 0.841 | 0.914 | 0.997 | 1.00 | 0.951 | 0.936 | ||
| LMBIRCH2 | [-] | 284. | 284. | 288. | 284. | 289. | 0.454 | 1.63 | 0.0383 | 0.842 | 0.914 | 0.997 | 1.00 | 0.952 | 0.937 | ||
| LUNA3 | [-] | 284. | 284. | 288. | 284. | 289. | 0.474 | 1.64 | 0.0383 | 0.841 | 0.914 | 0.997 | 1.00 | 0.951 | 0.936 |
Download Data |
Period Mean (original grids) [K] |
Model Period Mean (intersection) [K] |
Model Period Mean (complement) [K] |
Benchmark Period Mean (intersection) [K] |
Benchmark Period Mean (complement) [K] |
Bias [K] |
RMSE [K] |
Phase Shift [months] |
Bias Score [1] |
RMSE Score [1] |
Seasonal Cycle Score [1] |
Spatial Distribution Score [1] |
Interannual Variability Score [1] |
Overall Score [1] |
|||
|---|---|---|---|---|---|---|---|---|---|---|---|---|---|---|---|---|---|
| Benchmark | [-] | 299. | |||||||||||||||
| Control | [-] | 299. | 299. | 300. | 299. | 300. | 0.160 | 0.953 | 0.488 | 0.619 | 0.741 | 0.932 | 0.999 | 0.915 | 0.824 | ||
| LMBIRCH | [-] | 299. | 299. | 300. | 299. | 300. | 0.162 | 0.954 | 0.488 | 0.619 | 0.741 | 0.932 | 0.999 | 0.915 | 0.824 | ||
| LMBIRCH2 | [-] | 299. | 299. | 300. | 299. | 300. | 0.139 | 0.950 | 0.478 | 0.623 | 0.739 | 0.934 | 0.999 | 0.915 | 0.825 | ||
| LUNA3 | [-] | 299. | 299. | 300. | 299. | 300. | 0.162 | 0.954 | 0.488 | 0.619 | 0.741 | 0.932 | 0.999 | 0.915 | 0.824 |
Download Data |
Period Mean (original grids) [K] |
Model Period Mean (intersection) [K] |
Model Period Mean (complement) [K] |
Benchmark Period Mean (intersection) [K] |
Benchmark Period Mean (complement) [K] |
Bias [K] |
RMSE [K] |
Phase Shift [months] |
Bias Score [1] |
RMSE Score [1] |
Seasonal Cycle Score [1] |
Spatial Distribution Score [1] |
Interannual Variability Score [1] |
Overall Score [1] |
|||
|---|---|---|---|---|---|---|---|---|---|---|---|---|---|---|---|---|---|
| Benchmark | [-] | 296. | |||||||||||||||
| Control | [-] | 296. | 296. | 295. | 296. | 297. | 0.356 | 0.888 | 0.329 | 0.728 | 0.841 | 0.958 | 0.999 | 0.951 | 0.887 | ||
| LMBIRCH | [-] | 296. | 296. | 295. | 296. | 297. | 0.380 | 0.893 | 0.331 | 0.727 | 0.843 | 0.958 | 1.00 | 0.951 | 0.887 | ||
| LMBIRCH2 | [-] | 296. | 296. | 295. | 296. | 297. | 0.328 | 0.879 | 0.333 | 0.733 | 0.841 | 0.958 | 0.999 | 0.951 | 0.887 | ||
| LUNA3 | [-] | 296. | 296. | 295. | 296. | 297. | 0.385 | 0.894 | 0.331 | 0.726 | 0.843 | 0.958 | 1.00 | 0.951 | 0.887 |
Download Data |
Period Mean (original grids) [K] |
Model Period Mean (intersection) [K] |
Model Period Mean (complement) [K] |
Benchmark Period Mean (intersection) [K] |
Benchmark Period Mean (complement) [K] |
Bias [K] |
RMSE [K] |
Phase Shift [months] |
Bias Score [1] |
RMSE Score [1] |
Seasonal Cycle Score [1] |
Spatial Distribution Score [1] |
Interannual Variability Score [1] |
Overall Score [1] |
|||
|---|---|---|---|---|---|---|---|---|---|---|---|---|---|---|---|---|---|
| Benchmark | [-] | 284. | |||||||||||||||
| Control | [-] | 285. | 284. | 288. | 284. | 284. | 0.636 | 2.44 | 0.264 | 0.593 | 0.816 | 0.963 | 0.999 | 0.926 | 0.852 | ||
| LMBIRCH | [-] | 285. | 284. | 288. | 284. | 284. | 0.651 | 2.44 | 0.264 | 0.593 | 0.817 | 0.963 | 0.999 | 0.926 | 0.852 | ||
| LMBIRCH2 | [-] | 285. | 284. | 288. | 284. | 284. | 0.625 | 2.43 | 0.264 | 0.594 | 0.816 | 0.963 | 0.999 | 0.926 | 0.852 | ||
| LUNA3 | [-] | 285. | 284. | 288. | 284. | 284. | 0.654 | 2.44 | 0.264 | 0.593 | 0.816 | 0.963 | 0.999 | 0.925 | 0.852 |
Temporally integrated period mean