Mean State
Download Data |
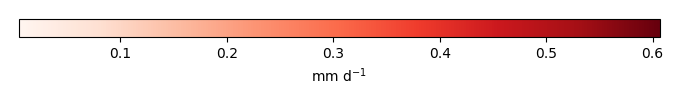
Period Mean (original grids) [mm d-1] |
Model Period Mean (intersection) [mm d-1] |
Model Period Mean (complement) [mm d-1] |
Benchmark Period Mean (intersection) [mm d-1] |
Benchmark Period Mean (complement) [mm d-1] |
Bias [mm d-1] |
RMSE [mm d-1] |
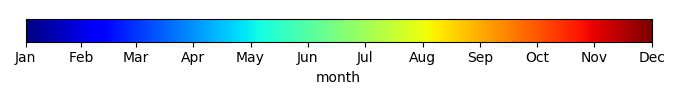
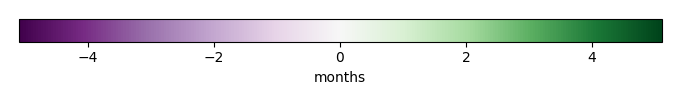
Phase Shift [months] |
Bias Score [1] |
RMSE Score [1] |
Seasonal Cycle Score [1] |
Spatial Distribution Score [1] |
Interannual Variability Score [1] |
Overall Score [1] |
|||
|---|---|---|---|---|---|---|---|---|---|---|---|---|---|---|---|---|---|
| Benchmark | [-] | 2.07 | |||||||||||||||
| Control | [-] | 2.50 | 2.46 | 2.49 | 2.07 | 1.30 | 0.383 | 0.781 | 2.12 | 0.443 | 0.315 | 0.632 | 0.968 | 0.664 | 0.556 | ||
| LMBIRCH | [-] | 2.50 | 2.46 | 2.49 | 2.07 | 1.30 | 0.382 | 0.780 | 2.11 | 0.444 | 0.315 | 0.634 | 0.968 | 0.664 | 0.557 | ||
| LMBIRCH2 | [-] | 2.57 | 2.53 | 2.52 | 2.07 | 1.30 | 0.446 | 0.818 | 2.21 | 0.402 | 0.310 | 0.613 | 0.959 | 0.661 | 0.543 | ||
| LUNA3 | [-] | 2.50 | 2.46 | 2.49 | 2.07 | 1.30 | 0.382 | 0.780 | 2.11 | 0.444 | 0.315 | 0.634 | 0.968 | 0.665 | 0.557 |
Download Data |
Period Mean (original grids) [mm d-1] |
Model Period Mean (intersection) [mm d-1] |
Model Period Mean (complement) [mm d-1] |
Benchmark Period Mean (intersection) [mm d-1] |
Benchmark Period Mean (complement) [mm d-1] |
Bias [mm d-1] |
RMSE [mm d-1] |
Phase Shift [months] |
Bias Score [1] |
RMSE Score [1] |
Seasonal Cycle Score [1] |
Spatial Distribution Score [1] |
Interannual Variability Score [1] |
Overall Score [1] |
|||
|---|---|---|---|---|---|---|---|---|---|---|---|---|---|---|---|---|---|
| Benchmark | [-] | 1.48 | |||||||||||||||
| Control | [-] | 1.56 | 1.58 | 1.55 | 1.48 | 1.39 | 0.0945 | 0.664 | 1.84 | 0.734 | 0.455 | 0.645 | 0.964 | 0.789 | 0.674 | ||
| LMBIRCH | [-] | 1.56 | 1.58 | 1.54 | 1.48 | 1.39 | 0.0938 | 0.661 | 1.80 | 0.737 | 0.456 | 0.653 | 0.967 | 0.790 | 0.676 | ||
| LMBIRCH2 | [-] | 1.57 | 1.59 | 1.57 | 1.48 | 1.39 | 0.105 | 0.690 | 1.70 | 0.702 | 0.449 | 0.680 | 0.944 | 0.780 | 0.667 | ||
| LUNA3 | [-] | 1.56 | 1.58 | 1.55 | 1.48 | 1.39 | 0.0938 | 0.661 | 1.80 | 0.736 | 0.456 | 0.653 | 0.967 | 0.790 | 0.676 |
Download Data |
Period Mean (original grids) [mm d-1] |
Model Period Mean (intersection) [mm d-1] |
Model Period Mean (complement) [mm d-1] |
Benchmark Period Mean (intersection) [mm d-1] |
Benchmark Period Mean (complement) [mm d-1] |
Bias [mm d-1] |
RMSE [mm d-1] |
Phase Shift [months] |
Bias Score [1] |
RMSE Score [1] |
Seasonal Cycle Score [1] |
Spatial Distribution Score [1] |
Interannual Variability Score [1] |
Overall Score [1] |
|||
|---|---|---|---|---|---|---|---|---|---|---|---|---|---|---|---|---|---|
| Benchmark | [-] | 1.64 | |||||||||||||||
| Control | [-] | 1.68 | 1.69 | 1.82 | 1.65 | 1.11 | 0.0441 | 0.720 | 1.28 | 0.646 | 0.465 | 0.821 | 0.935 | 0.679 | 0.668 | ||
| LMBIRCH | [-] | 1.67 | 1.68 | 1.80 | 1.65 | 1.11 | 0.0353 | 0.717 | 1.27 | 0.645 | 0.468 | 0.824 | 0.938 | 0.689 | 0.672 | ||
| LMBIRCH2 | [-] | 1.75 | 1.76 | 1.86 | 1.65 | 1.11 | 0.119 | 0.752 | 1.25 | 0.631 | 0.454 | 0.824 | 0.905 | 0.677 | 0.658 | ||
| LUNA3 | [-] | 1.67 | 1.68 | 1.80 | 1.65 | 1.11 | 0.0351 | 0.717 | 1.27 | 0.644 | 0.468 | 0.824 | 0.938 | 0.689 | 0.672 |
Download Data |
Period Mean (original grids) [mm d-1] |
Model Period Mean (intersection) [mm d-1] |
Model Period Mean (complement) [mm d-1] |
Benchmark Period Mean (intersection) [mm d-1] |
Benchmark Period Mean (complement) [mm d-1] |
Bias [mm d-1] |
RMSE [mm d-1] |
Phase Shift [months] |
Bias Score [1] |
RMSE Score [1] |
Seasonal Cycle Score [1] |
Spatial Distribution Score [1] |
Interannual Variability Score [1] |
Overall Score [1] |
|||
|---|---|---|---|---|---|---|---|---|---|---|---|---|---|---|---|---|---|
| Benchmark | [-] | 0.536 | |||||||||||||||
| Control | [-] | 0.543 | 0.551 | 0.446 | 0.537 | 0.370 | -0.00419 | 0.504 | 0.679 | 0.820 | 0.491 | 0.954 | 0.971 | 0.707 | 0.739 | ||
| LMBIRCH | [-] | 0.391 | 0.398 | 0.326 | 0.537 | 0.370 | -0.150 | 0.390 | 0.557 | 0.765 | 0.593 | 0.963 | 0.855 | 0.759 | 0.755 | ||
| LMBIRCH2 | [-] | 0.441 | 0.448 | 0.390 | 0.537 | 0.370 | -0.0991 | 0.406 | 0.711 | 0.807 | 0.570 | 0.952 | 0.960 | 0.781 | 0.773 | ||
| LUNA3 | [-] | 0.446 | 0.453 | 0.355 | 0.537 | 0.370 | -0.0993 | 0.402 | 0.725 | 0.811 | 0.571 | 0.951 | 0.947 | 0.788 | 0.773 |
Download Data |
Period Mean (original grids) [mm d-1] |
Model Period Mean (intersection) [mm d-1] |
Model Period Mean (complement) [mm d-1] |
Benchmark Period Mean (intersection) [mm d-1] |
Benchmark Period Mean (complement) [mm d-1] |
Bias [mm d-1] |
RMSE [mm d-1] |
Phase Shift [months] |
Bias Score [1] |
RMSE Score [1] |
Seasonal Cycle Score [1] |
Spatial Distribution Score [1] |
Interannual Variability Score [1] |
Overall Score [1] |
|||
|---|---|---|---|---|---|---|---|---|---|---|---|---|---|---|---|---|---|
| Benchmark | [-] | 2.98 | |||||||||||||||
| Control | [-] | 3.41 | 3.39 | 3.51 | 3.01 | 2.17 | 0.445 | 1.01 | 2.54 | 0.371 | 0.300 | 0.580 | 0.412 | 0.652 | 0.436 | ||
| LMBIRCH | [-] | 3.40 | 3.39 | 3.51 | 3.01 | 2.17 | 0.442 | 1.01 | 2.54 | 0.371 | 0.300 | 0.580 | 0.410 | 0.652 | 0.436 | ||
| LMBIRCH2 | [-] | 3.45 | 3.43 | 3.55 | 3.01 | 2.17 | 0.488 | 1.02 | 2.54 | 0.376 | 0.298 | 0.579 | 0.434 | 0.652 | 0.439 | ||
| LUNA3 | [-] | 3.40 | 3.39 | 3.51 | 3.01 | 2.17 | 0.442 | 1.01 | 2.54 | 0.371 | 0.300 | 0.580 | 0.410 | 0.652 | 0.436 |
Download Data |
Period Mean (original grids) [mm d-1] |
Model Period Mean (intersection) [mm d-1] |
Model Period Mean (complement) [mm d-1] |
Benchmark Period Mean (intersection) [mm d-1] |
Benchmark Period Mean (complement) [mm d-1] |
Bias [mm d-1] |
RMSE [mm d-1] |
Phase Shift [months] |
Bias Score [1] |
RMSE Score [1] |
Seasonal Cycle Score [1] |
Spatial Distribution Score [1] |
Interannual Variability Score [1] |
Overall Score [1] |
|||
|---|---|---|---|---|---|---|---|---|---|---|---|---|---|---|---|---|---|
| Benchmark | [-] | 1.00 | |||||||||||||||
| Control | [-] | 0.889 | 0.894 | 0.874 | 1.00 | 0.655 | -0.110 | 0.486 | 0.589 | 0.841 | 0.627 | 0.960 | 0.992 | 0.766 | 0.802 | ||
| LMBIRCH | [-] | 0.793 | 0.797 | 0.741 | 1.00 | 0.655 | -0.207 | 0.463 | 0.602 | 0.782 | 0.670 | 0.959 | 0.989 | 0.771 | 0.807 | ||
| LMBIRCH2 | [-] | 0.881 | 0.886 | 0.883 | 1.00 | 0.655 | -0.116 | 0.480 | 0.568 | 0.838 | 0.633 | 0.962 | 0.991 | 0.777 | 0.806 | ||
| LUNA3 | [-] | 0.745 | 0.747 | 0.678 | 1.00 | 0.655 | -0.257 | 0.488 | 0.638 | 0.746 | 0.670 | 0.957 | 0.985 | 0.756 | 0.797 |
Download Data |
Period Mean (original grids) [mm d-1] |
Model Period Mean (intersection) [mm d-1] |
Model Period Mean (complement) [mm d-1] |
Benchmark Period Mean (intersection) [mm d-1] |
Benchmark Period Mean (complement) [mm d-1] |
Bias [mm d-1] |
RMSE [mm d-1] |
Phase Shift [months] |
Bias Score [1] |
RMSE Score [1] |
Seasonal Cycle Score [1] |
Spatial Distribution Score [1] |
Interannual Variability Score [1] |
Overall Score [1] |
|||
|---|---|---|---|---|---|---|---|---|---|---|---|---|---|---|---|---|---|
| Benchmark | [-] | 0.939 | |||||||||||||||
| Control | [-] | 0.935 | 0.925 | 1.74 | 0.939 | 1.09 | 0.0190 | 0.502 | 0.721 | 0.748 | 0.543 | 0.940 | 0.969 | 0.715 | 0.743 | ||
| LMBIRCH | [-] | 0.913 | 0.904 | 1.71 | 0.939 | 1.09 | -0.00355 | 0.475 | 0.736 | 0.744 | 0.565 | 0.938 | 0.965 | 0.726 | 0.751 | ||
| LMBIRCH2 | [-] | 0.957 | 0.947 | 1.80 | 0.939 | 1.09 | 0.0436 | 0.494 | 0.716 | 0.770 | 0.546 | 0.941 | 0.978 | 0.726 | 0.751 | ||
| LUNA3 | [-] | 0.902 | 0.894 | 1.68 | 0.939 | 1.09 | -0.0153 | 0.484 | 0.735 | 0.734 | 0.559 | 0.936 | 0.958 | 0.724 | 0.745 |
Download Data |
Period Mean (original grids) [mm d-1] |
Model Period Mean (intersection) [mm d-1] |
Model Period Mean (complement) [mm d-1] |
Benchmark Period Mean (intersection) [mm d-1] |
Benchmark Period Mean (complement) [mm d-1] |
Bias [mm d-1] |
RMSE [mm d-1] |
Phase Shift [months] |
Bias Score [1] |
RMSE Score [1] |
Seasonal Cycle Score [1] |
Spatial Distribution Score [1] |
Interannual Variability Score [1] |
Overall Score [1] |
|||
|---|---|---|---|---|---|---|---|---|---|---|---|---|---|---|---|---|---|
| Benchmark | [-] | 1.65 | |||||||||||||||
| Control | [-] | 2.00 | 1.94 | 2.69 | 1.65 | 1.62 | 0.433 | 0.929 | 2.41 | 0.528 | 0.322 | 0.574 | 0.972 | 0.704 | 0.570 | ||
| LMBIRCH | [-] | 1.98 | 1.93 | 2.68 | 1.65 | 1.62 | 0.421 | 0.920 | 2.36 | 0.532 | 0.324 | 0.585 | 0.972 | 0.701 | 0.573 | ||
| LMBIRCH2 | [-] | 2.03 | 1.97 | 2.72 | 1.65 | 1.62 | 0.462 | 0.948 | 2.43 | 0.520 | 0.317 | 0.573 | 0.970 | 0.708 | 0.567 | ||
| LUNA3 | [-] | 1.98 | 1.92 | 2.68 | 1.65 | 1.62 | 0.417 | 0.917 | 2.34 | 0.533 | 0.325 | 0.589 | 0.972 | 0.702 | 0.574 |
Download Data |
Period Mean (original grids) [mm d-1] |
Model Period Mean (intersection) [mm d-1] |
Model Period Mean (complement) [mm d-1] |
Benchmark Period Mean (intersection) [mm d-1] |
Benchmark Period Mean (complement) [mm d-1] |
Bias [mm d-1] |
RMSE [mm d-1] |
Phase Shift [months] |
Bias Score [1] |
RMSE Score [1] |
Seasonal Cycle Score [1] |
Spatial Distribution Score [1] |
Interannual Variability Score [1] |
Overall Score [1] |
|||
|---|---|---|---|---|---|---|---|---|---|---|---|---|---|---|---|---|---|
| Benchmark | [-] | 0.539 | |||||||||||||||
| Control | [-] | 0.601 | 0.614 | 0.411 | 0.539 | 0.247 | 0.0544 | 0.550 | 0.280 | 0.843 | 0.460 | 0.980 | 0.982 | 0.630 | 0.726 | ||
| LMBIRCH | [-] | 0.455 | 0.466 | 0.336 | 0.539 | 0.247 | -0.0883 | 0.439 | 0.312 | 0.805 | 0.563 | 0.977 | 0.976 | 0.715 | 0.767 | ||
| LMBIRCH2 | [-] | 0.516 | 0.528 | 0.378 | 0.539 | 0.247 | -0.0278 | 0.463 | 0.289 | 0.841 | 0.527 | 0.980 | 0.970 | 0.733 | 0.763 | ||
| LUNA3 | [-] | 0.477 | 0.486 | 0.340 | 0.539 | 0.247 | -0.0691 | 0.451 | 0.340 | 0.820 | 0.548 | 0.975 | 0.970 | 0.708 | 0.761 |
Download Data |
Period Mean (original grids) [mm d-1] |
Model Period Mean (intersection) [mm d-1] |
Model Period Mean (complement) [mm d-1] |
Benchmark Period Mean (intersection) [mm d-1] |
Benchmark Period Mean (complement) [mm d-1] |
Bias [mm d-1] |
RMSE [mm d-1] |
Phase Shift [months] |
Bias Score [1] |
RMSE Score [1] |
Seasonal Cycle Score [1] |
Spatial Distribution Score [1] |
Interannual Variability Score [1] |
Overall Score [1] |
|||
|---|---|---|---|---|---|---|---|---|---|---|---|---|---|---|---|---|---|
| Benchmark | [-] | 1.17 | |||||||||||||||
| Control | [-] | 1.14 | 1.11 | 1.96 | 1.17 | 1.50 | 0.0202 | 0.513 | 0.663 | 0.737 | 0.529 | 0.924 | 0.973 | 0.762 | 0.742 | ||
| LMBIRCH | [-] | 1.13 | 1.09 | 1.89 | 1.17 | 1.50 | 0.00235 | 0.502 | 0.654 | 0.742 | 0.533 | 0.926 | 0.979 | 0.772 | 0.748 | ||
| LMBIRCH2 | [-] | 1.16 | 1.12 | 2.00 | 1.17 | 1.50 | 0.0370 | 0.518 | 0.654 | 0.738 | 0.525 | 0.925 | 0.967 | 0.750 | 0.738 | ||
| LUNA3 | [-] | 1.13 | 1.09 | 1.89 | 1.17 | 1.50 | -0.000786 | 0.502 | 0.667 | 0.740 | 0.534 | 0.925 | 0.979 | 0.772 | 0.747 |
Download Data |
Period Mean (original grids) [mm d-1] |
Model Period Mean (intersection) [mm d-1] |
Model Period Mean (complement) [mm d-1] |
Benchmark Period Mean (intersection) [mm d-1] |
Benchmark Period Mean (complement) [mm d-1] |
Bias [mm d-1] |
RMSE [mm d-1] |
Phase Shift [months] |
Bias Score [1] |
RMSE Score [1] |
Seasonal Cycle Score [1] |
Spatial Distribution Score [1] |
Interannual Variability Score [1] |
Overall Score [1] |
|||
|---|---|---|---|---|---|---|---|---|---|---|---|---|---|---|---|---|---|
| Benchmark | [-] | 1.10 | |||||||||||||||
| Control | [-] | 1.16 | 1.17 | 1.14 | 1.10 | 0.582 | 0.0707 | 0.513 | 0.477 | 0.811 | 0.607 | 0.970 | 0.970 | 0.749 | 0.786 | ||
| LMBIRCH | [-] | 1.01 | 1.02 | 0.988 | 1.10 | 0.582 | -0.0775 | 0.472 | 0.468 | 0.766 | 0.652 | 0.971 | 0.981 | 0.736 | 0.793 | ||
| LMBIRCH2 | [-] | 1.17 | 1.18 | 1.13 | 1.10 | 0.582 | 0.0809 | 0.518 | 0.475 | 0.795 | 0.608 | 0.970 | 0.975 | 0.745 | 0.783 | ||
| LUNA3 | [-] | 0.967 | 0.978 | 0.955 | 1.10 | 0.582 | -0.117 | 0.485 | 0.476 | 0.752 | 0.648 | 0.971 | 0.980 | 0.735 | 0.789 |
Download Data |
Period Mean (original grids) [mm d-1] |
Model Period Mean (intersection) [mm d-1] |
Model Period Mean (complement) [mm d-1] |
Benchmark Period Mean (intersection) [mm d-1] |
Benchmark Period Mean (complement) [mm d-1] |
Bias [mm d-1] |
RMSE [mm d-1] |
Phase Shift [months] |
Bias Score [1] |
RMSE Score [1] |
Seasonal Cycle Score [1] |
Spatial Distribution Score [1] |
Interannual Variability Score [1] |
Overall Score [1] |
|||
|---|---|---|---|---|---|---|---|---|---|---|---|---|---|---|---|---|---|
| Benchmark | [-] | 1.18 | |||||||||||||||
| Control | [-] | 1.19 | 1.17 | 1.61 | 1.17 | 1.39 | 0.0452 | 0.548 | 1.15 | 0.635 | 0.456 | 0.782 | 0.973 | 0.708 | 0.668 | ||
| LMBIRCH | [-] | 1.16 | 1.14 | 1.57 | 1.17 | 1.39 | 0.00927 | 0.528 | 1.14 | 0.627 | 0.470 | 0.783 | 0.972 | 0.712 | 0.672 | ||
| LMBIRCH2 | [-] | 1.21 | 1.19 | 1.64 | 1.17 | 1.39 | 0.0638 | 0.546 | 1.14 | 0.634 | 0.456 | 0.785 | 0.969 | 0.709 | 0.668 | ||
| LUNA3 | [-] | 1.15 | 1.13 | 1.56 | 1.17 | 1.39 | -0.000899 | 0.534 | 1.16 | 0.621 | 0.468 | 0.782 | 0.971 | 0.711 | 0.670 |
Download Data |
Period Mean (original grids) [mm d-1] |
Model Period Mean (intersection) [mm d-1] |
Model Period Mean (complement) [mm d-1] |
Benchmark Period Mean (intersection) [mm d-1] |
Benchmark Period Mean (complement) [mm d-1] |
Bias [mm d-1] |
RMSE [mm d-1] |
Phase Shift [months] |
Bias Score [1] |
RMSE Score [1] |
Seasonal Cycle Score [1] |
Spatial Distribution Score [1] |
Interannual Variability Score [1] |
Overall Score [1] |
|||
|---|---|---|---|---|---|---|---|---|---|---|---|---|---|---|---|---|---|
| Benchmark | [-] | 0.283 | |||||||||||||||
| Control | [-] | 0.321 | 0.300 | 0.597 | 0.283 | 0.767 | 0.0325 | 0.314 | 1.15 | 0.597 | 0.376 | 0.866 | 0.915 | 0.707 | 0.639 | ||
| LMBIRCH | [-] | 0.314 | 0.294 | 0.582 | 0.283 | 0.767 | 0.0253 | 0.303 | 1.15 | 0.605 | 0.396 | 0.864 | 0.915 | 0.709 | 0.648 | ||
| LMBIRCH2 | [-] | 0.326 | 0.305 | 0.613 | 0.283 | 0.767 | 0.0373 | 0.320 | 1.14 | 0.592 | 0.368 | 0.867 | 0.912 | 0.690 | 0.633 | ||
| LUNA3 | [-] | 0.313 | 0.293 | 0.578 | 0.283 | 0.767 | 0.0242 | 0.303 | 1.15 | 0.605 | 0.394 | 0.864 | 0.915 | 0.709 | 0.647 |
Download Data |
Period Mean (original grids) [mm d-1] |
Model Period Mean (intersection) [mm d-1] |
Model Period Mean (complement) [mm d-1] |
Benchmark Period Mean (intersection) [mm d-1] |
Benchmark Period Mean (complement) [mm d-1] |
Bias [mm d-1] |
RMSE [mm d-1] |
Phase Shift [months] |
Bias Score [1] |
RMSE Score [1] |
Seasonal Cycle Score [1] |
Spatial Distribution Score [1] |
Interannual Variability Score [1] |
Overall Score [1] |
|||
|---|---|---|---|---|---|---|---|---|---|---|---|---|---|---|---|---|---|
| Benchmark | [-] | 0.532 | |||||||||||||||
| Control | [-] | 0.566 | 0.576 | 0.371 | 0.533 | 0.354 | 0.0129 | 0.506 | 0.387 | 0.794 | 0.483 | 0.972 | 0.953 | 0.724 | 0.735 | ||
| LMBIRCH | [-] | 0.476 | 0.482 | 0.330 | 0.533 | 0.354 | -0.0730 | 0.423 | 0.289 | 0.787 | 0.558 | 0.980 | 0.967 | 0.717 | 0.761 | ||
| LMBIRCH2 | [-] | 0.537 | 0.544 | 0.368 | 0.533 | 0.354 | -0.0145 | 0.456 | 0.298 | 0.812 | 0.518 | 0.979 | 0.964 | 0.733 | 0.754 | ||
| LUNA3 | [-] | 0.477 | 0.484 | 0.323 | 0.533 | 0.354 | -0.0737 | 0.434 | 0.391 | 0.783 | 0.548 | 0.970 | 0.964 | 0.708 | 0.754 |
Download Data |
Period Mean (original grids) [mm d-1] |
Model Period Mean (intersection) [mm d-1] |
Model Period Mean (complement) [mm d-1] |
Benchmark Period Mean (intersection) [mm d-1] |
Benchmark Period Mean (complement) [mm d-1] |
Bias [mm d-1] |
RMSE [mm d-1] |
Phase Shift [months] |
Bias Score [1] |
RMSE Score [1] |
Seasonal Cycle Score [1] |
Spatial Distribution Score [1] |
Interannual Variability Score [1] |
Overall Score [1] |
|||
|---|---|---|---|---|---|---|---|---|---|---|---|---|---|---|---|---|---|
| Benchmark | [-] | 1.80 | |||||||||||||||
| Control | [-] | 2.01 | 1.95 | 2.48 | 1.80 | 2.12 | 0.323 | 0.989 | 1.36 | 0.559 | 0.403 | 0.790 | 0.871 | 0.617 | 0.607 | ||
| LMBIRCH | [-] | 2.01 | 1.95 | 2.47 | 1.80 | 2.12 | 0.319 | 0.987 | 1.39 | 0.562 | 0.403 | 0.787 | 0.874 | 0.611 | 0.607 | ||
| LMBIRCH2 | [-] | 2.05 | 1.99 | 2.51 | 1.80 | 2.12 | 0.357 | 0.997 | 1.33 | 0.556 | 0.405 | 0.799 | 0.863 | 0.637 | 0.611 | ||
| LUNA3 | [-] | 2.01 | 1.94 | 2.47 | 1.80 | 2.12 | 0.314 | 0.987 | 1.39 | 0.560 | 0.403 | 0.787 | 0.873 | 0.612 | 0.606 |
Download Data |
Period Mean (original grids) [mm d-1] |
Model Period Mean (intersection) [mm d-1] |
Model Period Mean (complement) [mm d-1] |
Benchmark Period Mean (intersection) [mm d-1] |
Benchmark Period Mean (complement) [mm d-1] |
Bias [mm d-1] |
RMSE [mm d-1] |
Phase Shift [months] |
Bias Score [1] |
RMSE Score [1] |
Seasonal Cycle Score [1] |
Spatial Distribution Score [1] |
Interannual Variability Score [1] |
Overall Score [1] |
|||
|---|---|---|---|---|---|---|---|---|---|---|---|---|---|---|---|---|---|
| Benchmark | [-] | 1.98 | |||||||||||||||
| Control | [-] | 1.76 | 1.74 | 1.98 | 1.98 | 1.92 | -0.199 | 0.679 | 0.473 | 0.728 | 0.628 | 0.963 | 0.908 | 0.752 | 0.768 | ||
| LMBIRCH | [-] | 1.73 | 1.71 | 1.91 | 1.98 | 1.92 | -0.232 | 0.654 | 0.480 | 0.713 | 0.653 | 0.963 | 0.858 | 0.735 | 0.763 | ||
| LMBIRCH2 | [-] | 1.89 | 1.87 | 2.07 | 1.98 | 1.92 | -0.0713 | 0.608 | 0.498 | 0.799 | 0.642 | 0.961 | 0.960 | 0.764 | 0.795 | ||
| LUNA3 | [-] | 1.65 | 1.63 | 1.86 | 1.98 | 1.92 | -0.309 | 0.711 | 0.475 | 0.672 | 0.638 | 0.963 | 0.872 | 0.737 | 0.753 |
Download Data |
Period Mean (original grids) [mm d-1] |
Model Period Mean (intersection) [mm d-1] |
Model Period Mean (complement) [mm d-1] |
Benchmark Period Mean (intersection) [mm d-1] |
Benchmark Period Mean (complement) [mm d-1] |
Bias [mm d-1] |
RMSE [mm d-1] |
Phase Shift [months] |
Bias Score [1] |
RMSE Score [1] |
Seasonal Cycle Score [1] |
Spatial Distribution Score [1] |
Interannual Variability Score [1] |
Overall Score [1] |
|||
|---|---|---|---|---|---|---|---|---|---|---|---|---|---|---|---|---|---|
| Benchmark | [-] | 1.20 | |||||||||||||||
| Control | [-] | 1.07 | 1.07 | 1.12 | 1.20 | 1.12 | -0.130 | 0.633 | 0.552 | 0.732 | 0.580 | 0.962 | 0.700 | 0.670 | 0.704 | ||
| LMBIRCH | [-] | 0.965 | 0.961 | 1.02 | 1.20 | 1.12 | -0.243 | 0.617 | 0.566 | 0.692 | 0.611 | 0.961 | 0.764 | 0.656 | 0.716 | ||
| LMBIRCH2 | [-] | 1.08 | 1.08 | 1.17 | 1.20 | 1.12 | -0.117 | 0.620 | 0.533 | 0.740 | 0.585 | 0.963 | 0.777 | 0.672 | 0.720 | ||
| LUNA3 | [-] | 0.897 | 0.894 | 0.960 | 1.20 | 1.12 | -0.310 | 0.635 | 0.620 | 0.656 | 0.619 | 0.957 | 0.790 | 0.659 | 0.717 |
Download Data |
Period Mean (original grids) [mm d-1] |
Model Period Mean (intersection) [mm d-1] |
Model Period Mean (complement) [mm d-1] |
Benchmark Period Mean (intersection) [mm d-1] |
Benchmark Period Mean (complement) [mm d-1] |
Bias [mm d-1] |
RMSE [mm d-1] |
Phase Shift [months] |
Bias Score [1] |
RMSE Score [1] |
Seasonal Cycle Score [1] |
Spatial Distribution Score [1] |
Interannual Variability Score [1] |
Overall Score [1] |
|||
|---|---|---|---|---|---|---|---|---|---|---|---|---|---|---|---|---|---|
| Benchmark | [-] | 1.11 | |||||||||||||||
| Control | [-] | 0.939 | 0.935 | 1.18 | 1.11 | 1.04 | -0.163 | 0.577 | 0.681 | 0.697 | 0.513 | 0.945 | 0.874 | 0.753 | 0.716 | ||
| LMBIRCH | [-] | 0.909 | 0.904 | 1.09 | 1.11 | 1.04 | -0.196 | 0.574 | 0.674 | 0.684 | 0.521 | 0.949 | 0.818 | 0.728 | 0.703 | ||
| LMBIRCH2 | [-] | 0.944 | 0.940 | 1.21 | 1.11 | 1.04 | -0.157 | 0.577 | 0.644 | 0.700 | 0.513 | 0.947 | 0.881 | 0.747 | 0.717 | ||
| LUNA3 | [-] | 0.902 | 0.898 | 1.10 | 1.11 | 1.04 | -0.202 | 0.580 | 0.686 | 0.680 | 0.519 | 0.948 | 0.823 | 0.734 | 0.704 |
Download Data |
Period Mean (original grids) [mm d-1] |
Model Period Mean (intersection) [mm d-1] |
Model Period Mean (complement) [mm d-1] |
Benchmark Period Mean (intersection) [mm d-1] |
Benchmark Period Mean (complement) [mm d-1] |
Bias [mm d-1] |
RMSE [mm d-1] |
Phase Shift [months] |
Bias Score [1] |
RMSE Score [1] |
Seasonal Cycle Score [1] |
Spatial Distribution Score [1] |
Interannual Variability Score [1] |
Overall Score [1] |
|||
|---|---|---|---|---|---|---|---|---|---|---|---|---|---|---|---|---|---|
| Benchmark | [-] | 3.25 | |||||||||||||||
| Control | [-] | 3.25 | 3.24 | 3.03 | 3.25 | 1.88 | -0.0208 | 0.742 | 2.77 | 0.480 | 0.355 | 0.515 | 0.764 | 0.705 | 0.529 | ||
| LMBIRCH | [-] | 3.24 | 3.24 | 3.03 | 3.25 | 1.88 | -0.0245 | 0.742 | 2.77 | 0.479 | 0.355 | 0.515 | 0.764 | 0.705 | 0.529 | ||
| LMBIRCH2 | [-] | 3.30 | 3.29 | 3.07 | 3.25 | 1.88 | 0.0280 | 0.743 | 2.73 | 0.490 | 0.353 | 0.522 | 0.759 | 0.707 | 0.531 | ||
| LUNA3 | [-] | 3.24 | 3.24 | 3.03 | 3.25 | 1.88 | -0.0245 | 0.742 | 2.77 | 0.479 | 0.355 | 0.515 | 0.764 | 0.705 | 0.529 |
Download Data |
Period Mean (original grids) [mm d-1] |
Model Period Mean (intersection) [mm d-1] |
Model Period Mean (complement) [mm d-1] |
Benchmark Period Mean (intersection) [mm d-1] |
Benchmark Period Mean (complement) [mm d-1] |
Bias [mm d-1] |
RMSE [mm d-1] |
Phase Shift [months] |
Bias Score [1] |
RMSE Score [1] |
Seasonal Cycle Score [1] |
Spatial Distribution Score [1] |
Interannual Variability Score [1] |
Overall Score [1] |
|||
|---|---|---|---|---|---|---|---|---|---|---|---|---|---|---|---|---|---|
| Benchmark | [-] | 2.24 | |||||||||||||||
| Control | [-] | 2.32 | 2.31 | 2.40 | 2.25 | 1.44 | 0.0611 | 0.658 | 1.04 | 0.736 | 0.512 | 0.886 | 0.940 | 0.734 | 0.720 | ||
| LMBIRCH | [-] | 2.27 | 2.26 | 2.25 | 2.25 | 1.44 | 0.00771 | 0.646 | 1.04 | 0.736 | 0.522 | 0.886 | 0.930 | 0.758 | 0.726 | ||
| LMBIRCH2 | [-] | 2.37 | 2.36 | 2.46 | 2.25 | 1.44 | 0.118 | 0.682 | 1.06 | 0.716 | 0.503 | 0.888 | 0.929 | 0.704 | 0.707 | ||
| LUNA3 | [-] | 2.26 | 2.25 | 2.25 | 2.25 | 1.44 | 0.000351 | 0.645 | 1.05 | 0.736 | 0.523 | 0.885 | 0.929 | 0.761 | 0.726 |
Download Data |
Period Mean (original grids) [mm d-1] |
Model Period Mean (intersection) [mm d-1] |
Model Period Mean (complement) [mm d-1] |
Benchmark Period Mean (intersection) [mm d-1] |
Benchmark Period Mean (complement) [mm d-1] |
Bias [mm d-1] |
RMSE [mm d-1] |
Phase Shift [months] |
Bias Score [1] |
RMSE Score [1] |
Seasonal Cycle Score [1] |
Spatial Distribution Score [1] |
Interannual Variability Score [1] |
Overall Score [1] |
|||
|---|---|---|---|---|---|---|---|---|---|---|---|---|---|---|---|---|---|
| Benchmark | [-] | 0.909 | |||||||||||||||
| Control | [-] | 1.01 | 1.01 | 0.736 | 0.906 | 1.11 | 0.0715 | 0.655 | 1.02 | 0.581 | 0.448 | 0.878 | 0.912 | 0.670 | 0.656 | ||
| LMBIRCH | [-] | 0.983 | 0.982 | 0.712 | 0.906 | 1.11 | 0.0364 | 0.620 | 1.11 | 0.582 | 0.474 | 0.872 | 0.917 | 0.662 | 0.663 | ||
| LMBIRCH2 | [-] | 1.04 | 1.04 | 0.759 | 0.906 | 1.11 | 0.104 | 0.668 | 0.971 | 0.583 | 0.442 | 0.894 | 0.903 | 0.679 | 0.657 | ||
| LUNA3 | [-] | 0.963 | 0.961 | 0.691 | 0.906 | 1.11 | 0.0109 | 0.623 | 1.08 | 0.572 | 0.474 | 0.873 | 0.915 | 0.657 | 0.661 |
Temporally integrated period mean