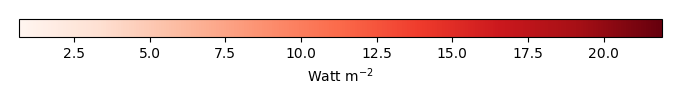
Mean State
Download Data |
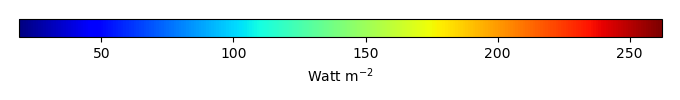
Period Mean (original grids) [Watt m-2] |
Model Period Mean (intersection) [Watt m-2] |
Model Period Mean (complement) [Watt m-2] |
Benchmark Period Mean (intersection) [Watt m-2] |
Benchmark Period Mean (complement) [Watt m-2] |
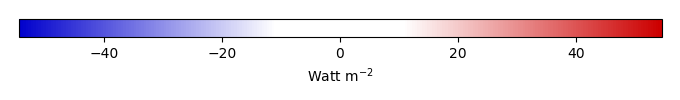
Bias [Watt m-2] |
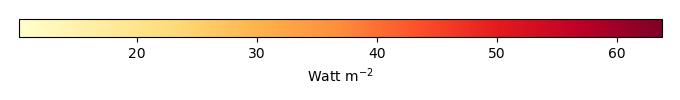
RMSE [Watt m-2] |
Phase Shift [months] |
Bias Score [1] |
RMSE Score [1] |
Seasonal Cycle Score [1] |
Spatial Distribution Score [1] |
Interannual Variability Score [1] |
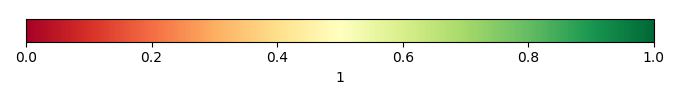
Overall Score [1] |
|||
|---|---|---|---|---|---|---|---|---|---|---|---|---|---|---|---|---|---|
| Benchmark | [-] | 179. | |||||||||||||||
| Control | [-] | 182. | 183. | 178. | 223. | 4.59 | 17.7 | 0.565 | 0.619 | 0.515 | 0.924 | 0.875 | 0.725 | 0.695 | |||
| LMBIRCH | [-] | 182. | 183. | 178. | 223. | 4.60 | 17.7 | 0.567 | 0.619 | 0.515 | 0.924 | 0.875 | 0.725 | 0.695 | |||
| LMBIRCH2 | [-] | 182. | 182. | 178. | 223. | 4.42 | 17.6 | 0.574 | 0.625 | 0.515 | 0.924 | 0.875 | 0.725 | 0.696 | |||
| LUNA3 | [-] | 182. | 183. | 178. | 223. | 4.60 | 17.7 | 0.567 | 0.619 | 0.515 | 0.924 | 0.875 | 0.725 | 0.695 |
Download Data |
Period Mean (original grids) [Watt m-2] |
Model Period Mean (intersection) [Watt m-2] |
Model Period Mean (complement) [Watt m-2] |
Benchmark Period Mean (intersection) [Watt m-2] |
Benchmark Period Mean (complement) [Watt m-2] |
Bias [Watt m-2] |
RMSE [Watt m-2] |
Phase Shift [months] |
Bias Score [1] |
RMSE Score [1] |
Seasonal Cycle Score [1] |
Spatial Distribution Score [1] |
Interannual Variability Score [1] |
Overall Score [1] |
|||
|---|---|---|---|---|---|---|---|---|---|---|---|---|---|---|---|---|---|
| Benchmark | [-] | 189. | |||||||||||||||
| Control | [-] | 196. | 195. | 189. | 214. | 6.79 | 17.0 | 0.588 | 0.662 | 0.528 | 0.930 | 0.978 | 0.780 | 0.734 | |||
| LMBIRCH | [-] | 196. | 195. | 189. | 214. | 6.81 | 17.0 | 0.590 | 0.661 | 0.528 | 0.930 | 0.978 | 0.780 | 0.734 | |||
| LMBIRCH2 | [-] | 196. | 195. | 189. | 214. | 6.65 | 17.0 | 0.555 | 0.665 | 0.528 | 0.935 | 0.979 | 0.779 | 0.736 | |||
| LUNA3 | [-] | 196. | 195. | 189. | 214. | 6.81 | 17.0 | 0.590 | 0.661 | 0.528 | 0.930 | 0.978 | 0.780 | 0.734 |
Download Data |
Period Mean (original grids) [Watt m-2] |
Model Period Mean (intersection) [Watt m-2] |
Model Period Mean (complement) [Watt m-2] |
Benchmark Period Mean (intersection) [Watt m-2] |
Benchmark Period Mean (complement) [Watt m-2] |
Bias [Watt m-2] |
RMSE [Watt m-2] |
Phase Shift [months] |
Bias Score [1] |
RMSE Score [1] |
Seasonal Cycle Score [1] |
Spatial Distribution Score [1] |
Interannual Variability Score [1] |
Overall Score [1] |
|||
|---|---|---|---|---|---|---|---|---|---|---|---|---|---|---|---|---|---|
| Benchmark | [-] | 194. | |||||||||||||||
| Control | [-] | 197. | 196. | 193. | 227. | 3.19 | 19.5 | 0.559 | 0.705 | 0.558 | 0.922 | 0.931 | 0.665 | 0.723 | |||
| LMBIRCH | [-] | 197. | 196. | 193. | 227. | 3.24 | 19.5 | 0.575 | 0.704 | 0.558 | 0.920 | 0.931 | 0.664 | 0.723 | |||
| LMBIRCH2 | [-] | 196. | 196. | 193. | 227. | 2.89 | 19.4 | 0.530 | 0.712 | 0.559 | 0.927 | 0.932 | 0.663 | 0.725 | |||
| LUNA3 | [-] | 197. | 196. | 193. | 227. | 3.25 | 19.5 | 0.575 | 0.704 | 0.558 | 0.920 | 0.930 | 0.664 | 0.723 |
Download Data |
Period Mean (original grids) [Watt m-2] |
Model Period Mean (intersection) [Watt m-2] |
Model Period Mean (complement) [Watt m-2] |
Benchmark Period Mean (intersection) [Watt m-2] |
Benchmark Period Mean (complement) [Watt m-2] |
Bias [Watt m-2] |
RMSE [Watt m-2] |
Phase Shift [months] |
Bias Score [1] |
RMSE Score [1] |
Seasonal Cycle Score [1] |
Spatial Distribution Score [1] |
Interannual Variability Score [1] |
Overall Score [1] |
|||
|---|---|---|---|---|---|---|---|---|---|---|---|---|---|---|---|---|---|
| Benchmark | [-] | 81.3 | |||||||||||||||
| Control | [-] | 72.0 | 72.4 | 81.1 | 86.1 | -9.48 | 20.6 | 0.279 | 0.865 | 0.752 | 0.982 | 0.932 | 0.692 | 0.829 | |||
| LMBIRCH | [-] | 70.4 | 70.9 | 81.1 | 86.1 | -11.0 | 21.8 | 0.301 | 0.849 | 0.743 | 0.980 | 0.922 | 0.701 | 0.823 | |||
| LMBIRCH2 | [-] | 71.7 | 72.2 | 81.1 | 86.1 | -9.78 | 20.8 | 0.288 | 0.862 | 0.751 | 0.981 | 0.915 | 0.694 | 0.826 | |||
| LUNA3 | [-] | 70.9 | 71.4 | 81.1 | 86.1 | -10.6 | 21.3 | 0.290 | 0.854 | 0.748 | 0.981 | 0.923 | 0.693 | 0.824 |
Download Data |
Period Mean (original grids) [Watt m-2] |
Model Period Mean (intersection) [Watt m-2] |
Model Period Mean (complement) [Watt m-2] |
Benchmark Period Mean (intersection) [Watt m-2] |
Benchmark Period Mean (complement) [Watt m-2] |
Bias [Watt m-2] |
RMSE [Watt m-2] |
Phase Shift [months] |
Bias Score [1] |
RMSE Score [1] |
Seasonal Cycle Score [1] |
Spatial Distribution Score [1] |
Interannual Variability Score [1] |
Overall Score [1] |
|||
|---|---|---|---|---|---|---|---|---|---|---|---|---|---|---|---|---|---|
| Benchmark | [-] | 189. | |||||||||||||||
| Control | [-] | 178. | 177. | 187. | 210. | -3.35 | 22.3 | 0.816 | 0.584 | 0.452 | 0.883 | 0.777 | 0.685 | 0.639 | |||
| LMBIRCH | [-] | 178. | 177. | 187. | 210. | -3.35 | 22.3 | 0.816 | 0.584 | 0.452 | 0.883 | 0.777 | 0.685 | 0.639 | |||
| LMBIRCH2 | [-] | 178. | 177. | 187. | 210. | -3.42 | 22.4 | 0.816 | 0.585 | 0.452 | 0.883 | 0.776 | 0.685 | 0.639 | |||
| LUNA3 | [-] | 178. | 177. | 187. | 210. | -3.35 | 22.3 | 0.816 | 0.584 | 0.452 | 0.883 | 0.777 | 0.685 | 0.639 |
Download Data |
Period Mean (original grids) [Watt m-2] |
Model Period Mean (intersection) [Watt m-2] |
Model Period Mean (complement) [Watt m-2] |
Benchmark Period Mean (intersection) [Watt m-2] |
Benchmark Period Mean (complement) [Watt m-2] |
Bias [Watt m-2] |
RMSE [Watt m-2] |
Phase Shift [months] |
Bias Score [1] |
RMSE Score [1] |
Seasonal Cycle Score [1] |
Spatial Distribution Score [1] |
Interannual Variability Score [1] |
Overall Score [1] |
|||
|---|---|---|---|---|---|---|---|---|---|---|---|---|---|---|---|---|---|
| Benchmark | [-] | 105. | |||||||||||||||
| Control | [-] | 101. | 101. | 105. | 116. | -3.03 | 15.8 | 0.0925 | 0.938 | 0.805 | 0.994 | 0.999 | 0.633 | 0.862 | |||
| LMBIRCH | [-] | 101. | 101. | 105. | 116. | -3.41 | 16.0 | 0.0854 | 0.935 | 0.803 | 0.994 | 0.999 | 0.631 | 0.861 | |||
| LMBIRCH2 | [-] | 101. | 101. | 105. | 116. | -2.86 | 15.6 | 0.0890 | 0.940 | 0.808 | 0.994 | 0.999 | 0.630 | 0.863 | |||
| LUNA3 | [-] | 99.9 | 99.5 | 105. | 116. | -4.42 | 17.3 | 0.0904 | 0.926 | 0.792 | 0.994 | 0.997 | 0.640 | 0.857 |
Download Data |
Period Mean (original grids) [Watt m-2] |
Model Period Mean (intersection) [Watt m-2] |
Model Period Mean (complement) [Watt m-2] |
Benchmark Period Mean (intersection) [Watt m-2] |
Benchmark Period Mean (complement) [Watt m-2] |
Bias [Watt m-2] |
RMSE [Watt m-2] |
Phase Shift [months] |
Bias Score [1] |
RMSE Score [1] |
Seasonal Cycle Score [1] |
Spatial Distribution Score [1] |
Interannual Variability Score [1] |
Overall Score [1] |
|||
|---|---|---|---|---|---|---|---|---|---|---|---|---|---|---|---|---|---|
| Benchmark | [-] | 140. | |||||||||||||||
| Control | [-] | 135. | 135. | 140. | 162. | -3.99 | 17.6 | 0.262 | 0.880 | 0.740 | 0.977 | 0.997 | 0.627 | 0.827 | |||
| LMBIRCH | [-] | 135. | 135. | 140. | 162. | -4.01 | 17.6 | 0.265 | 0.881 | 0.740 | 0.977 | 0.997 | 0.627 | 0.827 | |||
| LMBIRCH2 | [-] | 135. | 135. | 140. | 162. | -4.20 | 17.6 | 0.266 | 0.880 | 0.741 | 0.977 | 0.996 | 0.627 | 0.827 | |||
| LUNA3 | [-] | 135. | 135. | 140. | 162. | -3.96 | 17.7 | 0.264 | 0.880 | 0.740 | 0.977 | 0.997 | 0.628 | 0.827 |
Download Data |
Period Mean (original grids) [Watt m-2] |
Model Period Mean (intersection) [Watt m-2] |
Model Period Mean (complement) [Watt m-2] |
Benchmark Period Mean (intersection) [Watt m-2] |
Benchmark Period Mean (complement) [Watt m-2] |
Bias [Watt m-2] |
RMSE [Watt m-2] |
Phase Shift [months] |
Bias Score [1] |
RMSE Score [1] |
Seasonal Cycle Score [1] |
Spatial Distribution Score [1] |
Interannual Variability Score [1] |
Overall Score [1] |
|||
|---|---|---|---|---|---|---|---|---|---|---|---|---|---|---|---|---|---|
| Benchmark | [-] | 180. | |||||||||||||||
| Control | [-] | 175. | 175. | 179. | 215. | -1.99 | 20.1 | 0.281 | 0.780 | 0.611 | 0.980 | 0.925 | 0.625 | 0.755 | |||
| LMBIRCH | [-] | 175. | 175. | 179. | 215. | -1.99 | 20.1 | 0.281 | 0.780 | 0.611 | 0.980 | 0.926 | 0.625 | 0.755 | |||
| LMBIRCH2 | [-] | 175. | 175. | 179. | 215. | -2.15 | 20.1 | 0.280 | 0.782 | 0.611 | 0.981 | 0.927 | 0.625 | 0.756 | |||
| LUNA3 | [-] | 175. | 175. | 179. | 215. | -1.98 | 20.2 | 0.281 | 0.780 | 0.611 | 0.980 | 0.925 | 0.625 | 0.755 |
Download Data |
Period Mean (original grids) [Watt m-2] |
Model Period Mean (intersection) [Watt m-2] |
Model Period Mean (complement) [Watt m-2] |
Benchmark Period Mean (intersection) [Watt m-2] |
Benchmark Period Mean (complement) [Watt m-2] |
Bias [Watt m-2] |
RMSE [Watt m-2] |
Phase Shift [months] |
Bias Score [1] |
RMSE Score [1] |
Seasonal Cycle Score [1] |
Spatial Distribution Score [1] |
Interannual Variability Score [1] |
Overall Score [1] |
|||
|---|---|---|---|---|---|---|---|---|---|---|---|---|---|---|---|---|---|
| Benchmark | [-] | 74.6 | |||||||||||||||
| Control | [-] | 65.1 | 66.1 | 74.6 | 70.6 | -10.3 | 18.8 | 0.365 | 0.854 | 0.742 | 0.976 | 0.922 | 0.664 | 0.817 | |||
| LMBIRCH | [-] | 62.9 | 63.9 | 74.6 | 70.6 | -12.2 | 19.3 | 0.303 | 0.829 | 0.742 | 0.980 | 0.888 | 0.664 | 0.808 | |||
| LMBIRCH2 | [-] | 64.3 | 65.3 | 74.6 | 70.6 | -11.0 | 18.7 | 0.325 | 0.845 | 0.745 | 0.978 | 0.893 | 0.658 | 0.811 | |||
| LUNA3 | [-] | 62.9 | 64.0 | 74.6 | 70.6 | -12.2 | 19.6 | 0.325 | 0.830 | 0.737 | 0.978 | 0.917 | 0.671 | 0.812 |
Download Data |
Period Mean (original grids) [Watt m-2] |
Model Period Mean (intersection) [Watt m-2] |
Model Period Mean (complement) [Watt m-2] |
Benchmark Period Mean (intersection) [Watt m-2] |
Benchmark Period Mean (complement) [Watt m-2] |
Bias [Watt m-2] |
RMSE [Watt m-2] |
Phase Shift [months] |
Bias Score [1] |
RMSE Score [1] |
Seasonal Cycle Score [1] |
Spatial Distribution Score [1] |
Interannual Variability Score [1] |
Overall Score [1] |
|||
|---|---|---|---|---|---|---|---|---|---|---|---|---|---|---|---|---|---|
| Benchmark | [-] | 193. | |||||||||||||||
| Control | [-] | 192. | 192. | 193. | 202. | -2.29 | 18.9 | 0.240 | 0.839 | 0.702 | 0.982 | 0.996 | 0.616 | 0.806 | |||
| LMBIRCH | [-] | 192. | 192. | 193. | 202. | -2.30 | 18.9 | 0.238 | 0.839 | 0.702 | 0.982 | 0.996 | 0.616 | 0.806 | |||
| LMBIRCH2 | [-] | 192. | 192. | 193. | 202. | -2.40 | 18.9 | 0.235 | 0.840 | 0.702 | 0.983 | 0.996 | 0.616 | 0.807 | |||
| LUNA3 | [-] | 192. | 193. | 193. | 202. | -2.25 | 18.9 | 0.243 | 0.839 | 0.702 | 0.982 | 0.996 | 0.616 | 0.806 |
Download Data |
Period Mean (original grids) [Watt m-2] |
Model Period Mean (intersection) [Watt m-2] |
Model Period Mean (complement) [Watt m-2] |
Benchmark Period Mean (intersection) [Watt m-2] |
Benchmark Period Mean (complement) [Watt m-2] |
Bias [Watt m-2] |
RMSE [Watt m-2] |
Phase Shift [months] |
Bias Score [1] |
RMSE Score [1] |
Seasonal Cycle Score [1] |
Spatial Distribution Score [1] |
Interannual Variability Score [1] |
Overall Score [1] |
|||
|---|---|---|---|---|---|---|---|---|---|---|---|---|---|---|---|---|---|
| Benchmark | [-] | 120. | |||||||||||||||
| Control | [-] | 112. | 112. | 120. | 119. | -3.12 | 17.6 | 0.371 | 0.894 | 0.799 | 0.974 | 0.997 | 0.626 | 0.848 | |||
| LMBIRCH | [-] | 111. | 112. | 120. | 119. | -3.64 | 17.7 | 0.364 | 0.892 | 0.799 | 0.975 | 0.997 | 0.626 | 0.848 | |||
| LMBIRCH2 | [-] | 112. | 112. | 120. | 119. | -3.39 | 17.6 | 0.370 | 0.893 | 0.799 | 0.974 | 0.997 | 0.624 | 0.848 | |||
| LUNA3 | [-] | 111. | 111. | 120. | 119. | -3.91 | 18.2 | 0.365 | 0.888 | 0.794 | 0.975 | 0.997 | 0.633 | 0.847 |
Download Data |
Period Mean (original grids) [Watt m-2] |
Model Period Mean (intersection) [Watt m-2] |
Model Period Mean (complement) [Watt m-2] |
Benchmark Period Mean (intersection) [Watt m-2] |
Benchmark Period Mean (complement) [Watt m-2] |
Bias [Watt m-2] |
RMSE [Watt m-2] |
Phase Shift [months] |
Bias Score [1] |
RMSE Score [1] |
Seasonal Cycle Score [1] |
Spatial Distribution Score [1] |
Interannual Variability Score [1] |
Overall Score [1] |
|||
|---|---|---|---|---|---|---|---|---|---|---|---|---|---|---|---|---|---|
| Benchmark | [-] | 168. | |||||||||||||||
| Control | [-] | 136. | 136. | 146. | 180. | -7.39 | 20.6 | 0.315 | 0.764 | 0.667 | 0.968 | 0.972 | 0.623 | 0.777 | |||
| LMBIRCH | [-] | 136. | 136. | 146. | 180. | -7.54 | 20.7 | 0.316 | 0.763 | 0.667 | 0.968 | 0.971 | 0.623 | 0.777 | |||
| LMBIRCH2 | [-] | 136. | 136. | 146. | 180. | -7.50 | 20.5 | 0.311 | 0.765 | 0.668 | 0.968 | 0.972 | 0.622 | 0.777 | |||
| LUNA3 | [-] | 136. | 136. | 146. | 180. | -7.62 | 20.8 | 0.316 | 0.762 | 0.666 | 0.968 | 0.971 | 0.625 | 0.776 |
Download Data |
Period Mean (original grids) [Watt m-2] |
Model Period Mean (intersection) [Watt m-2] |
Model Period Mean (complement) [Watt m-2] |
Benchmark Period Mean (intersection) [Watt m-2] |
Benchmark Period Mean (complement) [Watt m-2] |
Bias [Watt m-2] |
RMSE [Watt m-2] |
Phase Shift [months] |
Bias Score [1] |
RMSE Score [1] |
Seasonal Cycle Score [1] |
Spatial Distribution Score [1] |
Interannual Variability Score [1] |
Overall Score [1] |
|||
|---|---|---|---|---|---|---|---|---|---|---|---|---|---|---|---|---|---|
| Benchmark | [-] | 175. | |||||||||||||||
| Control | [-] | 161. | 161. | 175. | 221. | -11.9 | 21.8 | 0.350 | 0.687 | 0.723 | 0.967 | 0.989 | 0.580 | 0.778 | |||
| LMBIRCH | [-] | 161. | 161. | 175. | 221. | -11.9 | 21.7 | 0.349 | 0.687 | 0.723 | 0.967 | 0.989 | 0.580 | 0.778 | |||
| LMBIRCH2 | [-] | 161. | 161. | 175. | 221. | -11.9 | 21.8 | 0.352 | 0.687 | 0.723 | 0.967 | 0.989 | 0.580 | 0.778 | |||
| LUNA3 | [-] | 161. | 161. | 175. | 221. | -11.9 | 21.7 | 0.350 | 0.687 | 0.723 | 0.967 | 0.989 | 0.580 | 0.778 |
Download Data |
Period Mean (original grids) [Watt m-2] |
Model Period Mean (intersection) [Watt m-2] |
Model Period Mean (complement) [Watt m-2] |
Benchmark Period Mean (intersection) [Watt m-2] |
Benchmark Period Mean (complement) [Watt m-2] |
Bias [Watt m-2] |
RMSE [Watt m-2] |
Phase Shift [months] |
Bias Score [1] |
RMSE Score [1] |
Seasonal Cycle Score [1] |
Spatial Distribution Score [1] |
Interannual Variability Score [1] |
Overall Score [1] |
|||
|---|---|---|---|---|---|---|---|---|---|---|---|---|---|---|---|---|---|
| Benchmark | [-] | 80.0 | |||||||||||||||
| Control | [-] | 70.3 | 70.2 | 79.9 | 86.6 | -11.4 | 20.2 | 0.0961 | 0.833 | 0.758 | 0.994 | 0.908 | 0.731 | 0.830 | |||
| LMBIRCH | [-] | 69.7 | 69.6 | 79.9 | 86.6 | -11.9 | 20.6 | 0.0997 | 0.828 | 0.756 | 0.993 | 0.905 | 0.734 | 0.829 | |||
| LMBIRCH2 | [-] | 70.4 | 70.3 | 79.9 | 86.6 | -11.3 | 19.9 | 0.0848 | 0.834 | 0.761 | 0.994 | 0.899 | 0.727 | 0.829 | |||
| LUNA3 | [-] | 69.1 | 69.0 | 79.9 | 86.6 | -12.5 | 21.2 | 0.0927 | 0.823 | 0.750 | 0.994 | 0.920 | 0.741 | 0.830 |
Download Data |
Period Mean (original grids) [Watt m-2] |
Model Period Mean (intersection) [Watt m-2] |
Model Period Mean (complement) [Watt m-2] |
Benchmark Period Mean (intersection) [Watt m-2] |
Benchmark Period Mean (complement) [Watt m-2] |
Bias [Watt m-2] |
RMSE [Watt m-2] |
Phase Shift [months] |
Bias Score [1] |
RMSE Score [1] |
Seasonal Cycle Score [1] |
Spatial Distribution Score [1] |
Interannual Variability Score [1] |
Overall Score [1] |
|||
|---|---|---|---|---|---|---|---|---|---|---|---|---|---|---|---|---|---|
| Benchmark | [-] | 205. | |||||||||||||||
| Control | [-] | 194. | 194. | 204. | 218. | -6.85 | 22.8 | 0.287 | 0.712 | 0.635 | 0.970 | 0.837 | 0.619 | 0.735 | |||
| LMBIRCH | [-] | 194. | 194. | 204. | 218. | -6.84 | 22.8 | 0.287 | 0.712 | 0.635 | 0.970 | 0.837 | 0.619 | 0.735 | |||
| LMBIRCH2 | [-] | 193. | 194. | 204. | 218. | -6.98 | 22.8 | 0.287 | 0.712 | 0.635 | 0.970 | 0.835 | 0.619 | 0.734 | |||
| LUNA3 | [-] | 194. | 194. | 204. | 218. | -6.82 | 22.8 | 0.287 | 0.712 | 0.635 | 0.970 | 0.838 | 0.619 | 0.735 |
Download Data |
Period Mean (original grids) [Watt m-2] |
Model Period Mean (intersection) [Watt m-2] |
Model Period Mean (complement) [Watt m-2] |
Benchmark Period Mean (intersection) [Watt m-2] |
Benchmark Period Mean (complement) [Watt m-2] |
Bias [Watt m-2] |
RMSE [Watt m-2] |
Phase Shift [months] |
Bias Score [1] |
RMSE Score [1] |
Seasonal Cycle Score [1] |
Spatial Distribution Score [1] |
Interannual Variability Score [1] |
Overall Score [1] |
|||
|---|---|---|---|---|---|---|---|---|---|---|---|---|---|---|---|---|---|
| Benchmark | [-] | 153. | |||||||||||||||
| Control | [-] | 144. | 144. | 152. | 188. | -5.55 | 16.8 | 0.196 | 0.897 | 0.766 | 0.987 | 0.999 | 0.614 | 0.838 | |||
| LMBIRCH | [-] | 143. | 143. | 152. | 188. | -5.84 | 16.8 | 0.196 | 0.894 | 0.766 | 0.987 | 0.999 | 0.613 | 0.838 | |||
| LMBIRCH2 | [-] | 144. | 144. | 152. | 188. | -5.57 | 16.8 | 0.196 | 0.896 | 0.767 | 0.987 | 0.999 | 0.613 | 0.838 | |||
| LUNA3 | [-] | 143. | 143. | 152. | 188. | -5.80 | 17.0 | 0.196 | 0.894 | 0.764 | 0.987 | 0.999 | 0.617 | 0.838 |
Download Data |
Period Mean (original grids) [Watt m-2] |
Model Period Mean (intersection) [Watt m-2] |
Model Period Mean (complement) [Watt m-2] |
Benchmark Period Mean (intersection) [Watt m-2] |
Benchmark Period Mean (complement) [Watt m-2] |
Bias [Watt m-2] |
RMSE [Watt m-2] |
Phase Shift [months] |
Bias Score [1] |
RMSE Score [1] |
Seasonal Cycle Score [1] |
Spatial Distribution Score [1] |
Interannual Variability Score [1] |
Overall Score [1] |
|||
|---|---|---|---|---|---|---|---|---|---|---|---|---|---|---|---|---|---|
| Benchmark | [-] | 115. | |||||||||||||||
| Control | [-] | 111. | 111. | 115. | 123. | -3.86 | 15.5 | 0.101 | 0.917 | 0.820 | 0.993 | 0.999 | 0.645 | 0.866 | |||
| LMBIRCH | [-] | 110. | 110. | 115. | 123. | -4.03 | 15.5 | 0.115 | 0.916 | 0.820 | 0.992 | 0.999 | 0.645 | 0.865 | |||
| LMBIRCH2 | [-] | 111. | 111. | 115. | 123. | -3.76 | 15.2 | 0.103 | 0.919 | 0.823 | 0.993 | 0.998 | 0.641 | 0.866 | |||
| LUNA3 | [-] | 110. | 110. | 115. | 123. | -4.46 | 16.0 | 0.108 | 0.912 | 0.815 | 0.993 | 0.999 | 0.651 | 0.864 |
Download Data |
Period Mean (original grids) [Watt m-2] |
Model Period Mean (intersection) [Watt m-2] |
Model Period Mean (complement) [Watt m-2] |
Benchmark Period Mean (intersection) [Watt m-2] |
Benchmark Period Mean (complement) [Watt m-2] |
Bias [Watt m-2] |
RMSE [Watt m-2] |
Phase Shift [months] |
Bias Score [1] |
RMSE Score [1] |
Seasonal Cycle Score [1] |
Spatial Distribution Score [1] |
Interannual Variability Score [1] |
Overall Score [1] |
|||
|---|---|---|---|---|---|---|---|---|---|---|---|---|---|---|---|---|---|
| Benchmark | [-] | 162. | |||||||||||||||
| Control | [-] | 158. | 158. | 162. | 197. | -3.52 | 15.8 | 0.189 | 0.921 | 0.806 | 0.988 | 0.999 | 0.656 | 0.863 | |||
| LMBIRCH | [-] | 158. | 158. | 162. | 197. | -3.50 | 15.7 | 0.189 | 0.921 | 0.807 | 0.988 | 0.999 | 0.655 | 0.863 | |||
| LMBIRCH2 | [-] | 158. | 158. | 162. | 197. | -3.74 | 15.8 | 0.180 | 0.920 | 0.806 | 0.988 | 0.999 | 0.655 | 0.862 | |||
| LUNA3 | [-] | 158. | 158. | 162. | 197. | -3.55 | 15.8 | 0.189 | 0.920 | 0.806 | 0.988 | 0.998 | 0.658 | 0.862 |
Download Data |
Period Mean (original grids) [Watt m-2] |
Model Period Mean (intersection) [Watt m-2] |
Model Period Mean (complement) [Watt m-2] |
Benchmark Period Mean (intersection) [Watt m-2] |
Benchmark Period Mean (complement) [Watt m-2] |
Bias [Watt m-2] |
RMSE [Watt m-2] |
Phase Shift [months] |
Bias Score [1] |
RMSE Score [1] |
Seasonal Cycle Score [1] |
Spatial Distribution Score [1] |
Interannual Variability Score [1] |
Overall Score [1] |
|||
|---|---|---|---|---|---|---|---|---|---|---|---|---|---|---|---|---|---|
| Benchmark | [-] | 176. | |||||||||||||||
| Control | [-] | 174. | 174. | 175. | 226. | 0.187 | 18.0 | 0.587 | 0.802 | 0.464 | 0.923 | 0.951 | 0.644 | 0.708 | |||
| LMBIRCH | [-] | 174. | 174. | 175. | 226. | 0.194 | 18.0 | 0.587 | 0.802 | 0.464 | 0.923 | 0.951 | 0.644 | 0.708 | |||
| LMBIRCH2 | [-] | 174. | 174. | 175. | 226. | 0.0712 | 18.0 | 0.587 | 0.802 | 0.464 | 0.923 | 0.950 | 0.644 | 0.708 | |||
| LUNA3 | [-] | 174. | 174. | 175. | 226. | 0.194 | 18.0 | 0.587 | 0.802 | 0.464 | 0.923 | 0.951 | 0.644 | 0.708 |
Download Data |
Period Mean (original grids) [Watt m-2] |
Model Period Mean (intersection) [Watt m-2] |
Model Period Mean (complement) [Watt m-2] |
Benchmark Period Mean (intersection) [Watt m-2] |
Benchmark Period Mean (complement) [Watt m-2] |
Bias [Watt m-2] |
RMSE [Watt m-2] |
Phase Shift [months] |
Bias Score [1] |
RMSE Score [1] |
Seasonal Cycle Score [1] |
Spatial Distribution Score [1] |
Interannual Variability Score [1] |
Overall Score [1] |
|||
|---|---|---|---|---|---|---|---|---|---|---|---|---|---|---|---|---|---|
| Benchmark | [-] | 182. | |||||||||||||||
| Control | [-] | 181. | 181. | 182. | 192. | -0.671 | 19.8 | 0.292 | 0.866 | 0.571 | 0.967 | 0.998 | 0.614 | 0.765 | |||
| LMBIRCH | [-] | 181. | 181. | 182. | 192. | -0.781 | 19.8 | 0.309 | 0.865 | 0.572 | 0.964 | 0.999 | 0.614 | 0.764 | |||
| LMBIRCH2 | [-] | 181. | 181. | 182. | 192. | -0.860 | 19.8 | 0.294 | 0.868 | 0.572 | 0.966 | 0.998 | 0.614 | 0.765 | |||
| LUNA3 | [-] | 181. | 181. | 182. | 192. | -0.723 | 19.8 | 0.309 | 0.865 | 0.571 | 0.964 | 0.999 | 0.614 | 0.764 |
Download Data |
Period Mean (original grids) [Watt m-2] |
Model Period Mean (intersection) [Watt m-2] |
Model Period Mean (complement) [Watt m-2] |
Benchmark Period Mean (intersection) [Watt m-2] |
Benchmark Period Mean (complement) [Watt m-2] |
Bias [Watt m-2] |
RMSE [Watt m-2] |
Phase Shift [months] |
Bias Score [1] |
RMSE Score [1] |
Seasonal Cycle Score [1] |
Spatial Distribution Score [1] |
Interannual Variability Score [1] |
Overall Score [1] |
|||
|---|---|---|---|---|---|---|---|---|---|---|---|---|---|---|---|---|---|
| Benchmark | [-] | 176. | |||||||||||||||
| Control | [-] | 175. | 174. | 175. | 182. | -5.25 | 23.0 | 0.408 | 0.807 | 0.687 | 0.956 | 0.998 | 0.599 | 0.789 | |||
| LMBIRCH | [-] | 175. | 174. | 175. | 182. | -5.19 | 23.0 | 0.411 | 0.806 | 0.687 | 0.956 | 0.998 | 0.600 | 0.789 | |||
| LMBIRCH2 | [-] | 175. | 174. | 175. | 182. | -5.42 | 23.0 | 0.408 | 0.806 | 0.687 | 0.956 | 0.998 | 0.599 | 0.789 | |||
| LUNA3 | [-] | 176. | 174. | 175. | 182. | -5.13 | 23.0 | 0.411 | 0.807 | 0.687 | 0.956 | 0.998 | 0.600 | 0.789 |
Temporally integrated period mean