Mean State
Download Data |
Period Mean (original grids) [Pg] |
Model Period Mean (intersection) [Pg] |
Model Period Mean (complement) [Pg] |
Benchmark Period Mean (intersection) [Pg] |
Benchmark Period Mean (complement) [Pg] |
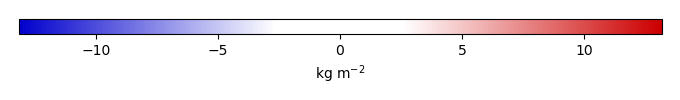
Bias [kg m-2] |
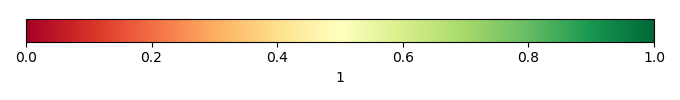
Bias Score [1] |
Spatial Distribution Score [1] |
Overall Score [1] |
|||
|---|---|---|---|---|---|---|---|---|---|---|---|---|
| Benchmark | [-] | 26.2 | ||||||||||
| D104 | [-] | 505. | 16.0 | 489. | 26.2 | 0.0251 | -0.876 | 0.603 | 0.794 | 0.698 | ||
| LMBIRCH4 | [-] | 528. | 18.6 | 509. | 26.2 | 0.0251 | -0.477 | 0.619 | 0.832 | 0.726 | ||
| PHSParam | [-] | 554. | 23.5 | 530. | 26.2 | 0.0251 | 0.171 | 0.634 | 0.877 | 0.756 | ||
| PPE | [-] | 639. | 28.0 | 611. | 26.2 | 0.0251 | 0.771 | 0.648 | 0.892 | 0.770 | ||
| R15 | [-] | 498. | 15.3 | 483. | 26.2 | 0.0251 | -0.945 | 0.597 | 0.786 | 0.692 |
Download Data |
Period Mean (original grids) [Pg] |
Model Period Mean (intersection) [Pg] |
Model Period Mean (complement) [Pg] |
Benchmark Period Mean (intersection) [Pg] |
Benchmark Period Mean (complement) [Pg] |
Bias [kg m-2] |
Bias Score [1] |
Spatial Distribution Score [1] |
Overall Score [1] |
|||
|---|---|---|---|---|---|---|---|---|---|---|---|---|
| Benchmark | [-] | 0.00338 | ||||||||||
| D104 | [-] | 10.4 | 0.0295 | 9.74 | 0.00338 | 0.456 | 0.0844 | 0.109 | 0.0966 | |||
| LMBIRCH4 | [-] | 11.0 | 0.0331 | 10.2 | 0.00338 | 0.524 | 0.0694 | 0.0775 | 0.0735 | |||
| PHSParam | [-] | 11.1 | 0.0355 | 10.3 | 0.00338 | 0.575 | 0.0633 | 0.0581 | 0.0607 | |||
| PPE | [-] | 13.1 | 0.0487 | 12.2 | 0.00338 | 0.762 | 0.0623 | 0.0468 | 0.0545 | |||
| R15 | [-] | 10.3 | 0.0296 | 9.59 | 0.00338 | 0.467 | 0.0743 | 0.0929 | 0.0836 |
Download Data |
Period Mean (original grids) [Pg] |
Model Period Mean (intersection) [Pg] |
Model Period Mean (complement) [Pg] |
Benchmark Period Mean (intersection) [Pg] |
Benchmark Period Mean (complement) [Pg] |
Bias [kg m-2] |
Bias Score [1] |
Spatial Distribution Score [1] |
Overall Score [1] |
|||
|---|---|---|---|---|---|---|---|---|---|---|---|---|
| Benchmark | [-] | 17.5 | ||||||||||
| D104 | [-] | 12.6 | 11.9 | 0.437 | 17.5 | 0.0228 | -0.861 | 0.650 | 0.866 | 0.758 | ||
| LMBIRCH4 | [-] | 15.4 | 14.6 | 0.515 | 17.5 | 0.0228 | -0.137 | 0.682 | 0.904 | 0.793 | ||
| PHSParam | [-] | 17.2 | 16.3 | 0.577 | 17.5 | 0.0228 | 0.349 | 0.668 | 0.905 | 0.787 | ||
| PPE | [-] | 20.1 | 19.1 | 0.641 | 17.5 | 0.0228 | 1.08 | 0.668 | 0.904 | 0.786 | ||
| R15 | [-] | 12.0 | 11.3 | 0.425 | 17.5 | 0.0228 | -1.02 | 0.640 | 0.853 | 0.747 |
Download Data |
Period Mean (original grids) [Pg] |
Model Period Mean (intersection) [Pg] |
Model Period Mean (complement) [Pg] |
Benchmark Period Mean (intersection) [Pg] |
Benchmark Period Mean (complement) [Pg] |
Bias [kg m-2] |
Bias Score [1] |
Spatial Distribution Score [1] |
Overall Score [1] |
|||
|---|---|---|---|---|---|---|---|---|---|---|---|---|
| Benchmark | [-] | 0.222 | ||||||||||
| D104 | [-] | 44.8 | 0.599 | 44.0 | 0.222 | 5.39 | 0.386 | 0.680 | 0.533 | |||
| LMBIRCH4 | [-] | 43.7 | 0.643 | 43.0 | 0.222 | 5.88 | 0.366 | 0.662 | 0.514 | |||
| PHSParam | [-] | 47.7 | 0.744 | 46.9 | 0.222 | 7.14 | 0.330 | 0.568 | 0.449 | |||
| PPE | [-] | 52.8 | 0.833 | 51.6 | 0.222 | 8.24 | 0.275 | 0.504 | 0.389 | |||
| R15 | [-] | 44.7 | 0.584 | 43.9 | 0.222 | 5.18 | 0.398 | 0.703 | 0.550 |
Download Data |
Period Mean (original grids) [Pg] |
Model Period Mean (intersection) [Pg] |
Model Period Mean (complement) [Pg] |
Benchmark Period Mean (intersection) [Pg] |
Benchmark Period Mean (complement) [Pg] |
Bias [kg m-2] |
Bias Score [1] |
Spatial Distribution Score [1] |
Overall Score [1] |
|||
|---|---|---|---|---|---|---|---|---|---|---|---|---|
| Benchmark | [-] | 8.47 | ||||||||||
| D104 | [-] | 3.35 | 3.39 | 0.116 | 8.47 | 0.00149 | -1.09 | 0.512 | 0.631 | 0.572 | ||
| LMBIRCH4 | [-] | 3.20 | 3.30 | 0.151 | 8.47 | 0.00149 | -1.04 | 0.497 | 0.649 | 0.573 | ||
| PHSParam | [-] | 6.33 | 6.35 | 0.171 | 8.47 | 0.00149 | -0.223 | 0.574 | 0.837 | 0.705 | ||
| PPE | [-] | 7.90 | 7.92 | 0.215 | 8.47 | 0.00149 | 0.227 | 0.619 | 0.883 | 0.751 | ||
| R15 | [-] | 3.31 | 3.35 | 0.123 | 8.47 | 0.00149 | -1.06 | 0.516 | 0.650 | 0.583 |
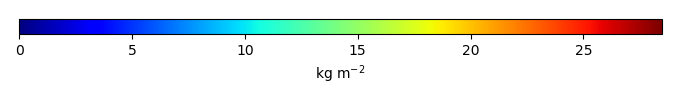
Temporally integrated period mean