Mean State
Download Data |
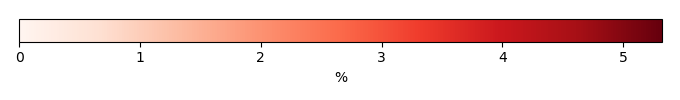
Period Mean (original grids) [%] |
Model Period Mean (intersection) [%] |
Model Period Mean (complement) [%] |
Benchmark Period Mean (intersection) [%] |
Benchmark Period Mean (complement) [%] |
Bias [%] |
RMSE [%] |
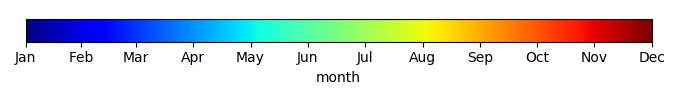
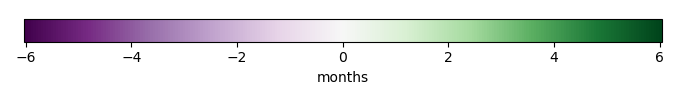
Phase Shift [months] |
Bias Score [1] |
RMSE Score [1] |
Seasonal Cycle Score [1] |
Spatial Distribution Score [1] |
Interannual Variability Score [1] |
Overall Score [1] |
|||
|---|---|---|---|---|---|---|---|---|---|---|---|---|---|---|---|---|---|
| Benchmark | [-] | 0.419 | |||||||||||||||
| D104 | [-] | 0.266 | 0.289 | 0.0324 | 0.419 | -0.141 | 1.26 | 1.86 | 0.688 | 0.342 | 0.802 | 0.467 | 0.510 | 0.525 | |||
| LMBIRCH4 | [-] | 0.298 | 0.320 | 0.0322 | 0.419 | -0.112 | 1.33 | 1.88 | 0.674 | 0.347 | 0.781 | 0.572 | 0.479 | 0.533 | |||
| PHSParam | [-] | 0.366 | 0.366 | 0.0317 | 0.419 | -0.0662 | 1.37 | 1.86 | 0.689 | 0.333 | 0.804 | 0.680 | 0.491 | 0.555 | |||
| PPE | [-] | 0.377 | 0.390 | 0.0200 | 0.419 | -0.0455 | 1.29 | 1.83 | 0.688 | 0.348 | 0.781 | 0.705 | 0.472 | 0.557 | |||
| R15 | [-] | 0.296 | 0.296 | 0.0322 | 0.419 | -0.133 | 1.29 | 1.89 | 0.700 | 0.336 | 0.781 | 0.524 | 0.518 | 0.532 |
Download Data |
Period Mean (original grids) [%] |
Model Period Mean (intersection) [%] |
Model Period Mean (complement) [%] |
Benchmark Period Mean (intersection) [%] |
Benchmark Period Mean (complement) [%] |
Bias [%] |
RMSE [%] |
Phase Shift [months] |
Bias Score [1] |
RMSE Score [1] |
Seasonal Cycle Score [1] |
Spatial Distribution Score [1] |
Interannual Variability Score [1] |
Overall Score [1] |
|||
|---|---|---|---|---|---|---|---|---|---|---|---|---|---|---|---|---|---|
| Benchmark | [-] | 1.70 | |||||||||||||||
| D104 | [-] | 0.958 | 0.926 | 0.0657 | 1.70 | 0.0870 | -0.795 | 3.97 | 2.19 | 0.738 | 0.366 | 0.737 | 0.410 | 0.478 | 0.516 | ||
| LMBIRCH4 | [-] | 1.13 | 1.11 | 0.0669 | 1.70 | 0.0870 | -0.619 | 4.18 | 2.31 | 0.754 | 0.351 | 0.689 | 0.598 | 0.501 | 0.541 | ||
| PHSParam | [-] | 1.10 | 1.07 | 0.103 | 1.70 | 0.0870 | -0.650 | 4.24 | 2.53 | 0.747 | 0.344 | 0.622 | 0.533 | 0.499 | 0.515 | ||
| PPE | [-] | 1.10 | 1.08 | 0.0740 | 1.70 | 0.0870 | -0.648 | 4.06 | 2.55 | 0.747 | 0.356 | 0.625 | 0.565 | 0.482 | 0.522 | ||
| R15 | [-] | 0.914 | 0.903 | 0.0643 | 1.70 | 0.0870 | -0.817 | 4.03 | 2.20 | 0.734 | 0.361 | 0.729 | 0.398 | 0.475 | 0.510 |
Download Data |
Period Mean (original grids) [%] |
Model Period Mean (intersection) [%] |
Model Period Mean (complement) [%] |
Benchmark Period Mean (intersection) [%] |
Benchmark Period Mean (complement) [%] |
Bias [%] |
RMSE [%] |
Phase Shift [months] |
Bias Score [1] |
RMSE Score [1] |
Seasonal Cycle Score [1] |
Spatial Distribution Score [1] |
Interannual Variability Score [1] |
Overall Score [1] |
|||
|---|---|---|---|---|---|---|---|---|---|---|---|---|---|---|---|---|---|
| Benchmark | [-] | 1.56 | |||||||||||||||
| D104 | [-] | 1.18 | 1.23 | 0.241 | 1.57 | 0.0342 | -0.410 | 3.87 | 1.60 | 0.723 | 0.337 | 0.790 | 0.784 | 0.530 | 0.583 | ||
| LMBIRCH4 | [-] | 1.47 | 1.52 | 0.256 | 1.57 | 0.0342 | -0.139 | 4.12 | 1.62 | 0.730 | 0.314 | 0.772 | 0.844 | 0.565 | 0.590 | ||
| PHSParam | [-] | 1.59 | 1.67 | 0.263 | 1.57 | 0.0342 | -0.00208 | 3.99 | 1.60 | 0.757 | 0.321 | 0.788 | 0.882 | 0.587 | 0.609 | ||
| PPE | [-] | 1.73 | 1.81 | 0.365 | 1.57 | 0.0342 | 0.136 | 3.78 | 1.57 | 0.728 | 0.347 | 0.795 | 0.864 | 0.564 | 0.607 | ||
| R15 | [-] | 1.03 | 1.07 | 0.206 | 1.57 | 0.0342 | -0.562 | 3.84 | 1.66 | 0.714 | 0.334 | 0.767 | 0.701 | 0.543 | 0.565 |
Download Data |
Period Mean (original grids) [%] |
Model Period Mean (intersection) [%] |
Model Period Mean (complement) [%] |
Benchmark Period Mean (intersection) [%] |
Benchmark Period Mean (complement) [%] |
Bias [%] |
RMSE [%] |
Phase Shift [months] |
Bias Score [1] |
RMSE Score [1] |
Seasonal Cycle Score [1] |
Spatial Distribution Score [1] |
Interannual Variability Score [1] |
Overall Score [1] |
|||
|---|---|---|---|---|---|---|---|---|---|---|---|---|---|---|---|---|---|
| Benchmark | [-] | 0.0193 | |||||||||||||||
| D104 | [-] | 0.115 | 0.125 | 0.00524 | 0.0193 | 0.00103 | 0.0941 | 0.561 | 2.27 | 0.790 | 0.291 | 0.949 | 0.130 | 0.439 | 0.482 | ||
| LMBIRCH4 | [-] | 0.0825 | 0.0902 | 0.00760 | 0.0193 | 0.00103 | 0.0625 | 0.478 | 2.27 | 0.827 | 0.306 | 0.949 | 0.201 | 0.447 | 0.506 | ||
| PHSParam | [-] | 0.0958 | 0.104 | 0.00939 | 0.0193 | 0.00103 | 0.0755 | 0.524 | 2.28 | 0.813 | 0.298 | 0.948 | 0.184 | 0.445 | 0.498 | ||
| PPE | [-] | 0.00546 | 0.00733 | 0.000787 | 0.0193 | 0.00103 | -0.0130 | 0.173 | 2.28 | 0.891 | 0.367 | 0.951 | 0.374 | 0.382 | 0.555 | ||
| R15 | [-] | 0.136 | 0.148 | 0.00539 | 0.0193 | 0.00103 | 0.115 | 0.595 | 2.27 | 0.778 | 0.289 | 0.949 | 0.0952 | 0.430 | 0.472 |
Download Data |
Period Mean (original grids) [%] |
Model Period Mean (intersection) [%] |
Model Period Mean (complement) [%] |
Benchmark Period Mean (intersection) [%] |
Benchmark Period Mean (complement) [%] |
Bias [%] |
RMSE [%] |
Phase Shift [months] |
Bias Score [1] |
RMSE Score [1] |
Seasonal Cycle Score [1] |
Spatial Distribution Score [1] |
Interannual Variability Score [1] |
Overall Score [1] |
|||
|---|---|---|---|---|---|---|---|---|---|---|---|---|---|---|---|---|---|
| Benchmark | [-] | 0.0475 | |||||||||||||||
| D104 | [-] | 0.0837 | 0.0782 | 0.100 | 0.0485 | 0.0167 | 0.0427 | 0.299 | 1.68 | 0.737 | 0.315 | 0.893 | 0.646 | 0.479 | 0.564 | ||
| LMBIRCH4 | [-] | 0.0837 | 0.0781 | 0.100 | 0.0485 | 0.0167 | 0.0427 | 0.299 | 1.66 | 0.737 | 0.315 | 0.902 | 0.646 | 0.479 | 0.566 | ||
| PHSParam | [-] | 0.0837 | 0.0781 | 0.101 | 0.0485 | 0.0167 | 0.0430 | 0.299 | 1.66 | 0.737 | 0.315 | 0.903 | 0.646 | 0.478 | 0.566 | ||
| PPE | [-] | 0.0537 | 0.0500 | 0.0646 | 0.0485 | 0.0167 | 0.0115 | 0.220 | 1.64 | 0.746 | 0.342 | 0.898 | 0.665 | 0.473 | 0.578 | ||
| R15 | [-] | 0.0837 | 0.0782 | 0.100 | 0.0485 | 0.0167 | 0.0427 | 0.299 | 1.68 | 0.737 | 0.315 | 0.893 | 0.646 | 0.478 | 0.564 |
Download Data |
Period Mean (original grids) [%] |
Model Period Mean (intersection) [%] |
Model Period Mean (complement) [%] |
Benchmark Period Mean (intersection) [%] |
Benchmark Period Mean (complement) [%] |
Bias [%] |
RMSE [%] |
Phase Shift [months] |
Bias Score [1] |
RMSE Score [1] |
Seasonal Cycle Score [1] |
Spatial Distribution Score [1] |
Interannual Variability Score [1] |
Overall Score [1] |
|||
|---|---|---|---|---|---|---|---|---|---|---|---|---|---|---|---|---|---|
| Benchmark | [-] | 0.0788 | |||||||||||||||
| D104 | [-] | 0.177 | 0.170 | 0.0282 | 0.0789 | 0.00283 | 0.0881 | 0.829 | 1.52 | 0.796 | 0.290 | 0.758 | 0.448 | 0.477 | 0.510 | ||
| LMBIRCH4 | [-] | 0.211 | 0.203 | 0.0312 | 0.0789 | 0.00283 | 0.121 | 0.951 | 1.49 | 0.769 | 0.271 | 0.757 | 0.367 | 0.470 | 0.484 | ||
| PHSParam | [-] | 0.160 | 0.154 | 0.0286 | 0.0789 | 0.00283 | 0.0733 | 0.800 | 1.45 | 0.802 | 0.304 | 0.778 | 0.499 | 0.488 | 0.529 | ||
| PPE | [-] | 0.167 | 0.165 | 0.0198 | 0.0789 | 0.00283 | 0.0845 | 0.630 | 1.48 | 0.778 | 0.319 | 0.767 | 0.452 | 0.470 | 0.517 | ||
| R15 | [-] | 0.159 | 0.153 | 0.0219 | 0.0789 | 0.00283 | 0.0715 | 0.799 | 1.54 | 0.806 | 0.296 | 0.758 | 0.466 | 0.471 | 0.516 |
Download Data |
Period Mean (original grids) [%] |
Model Period Mean (intersection) [%] |
Model Period Mean (complement) [%] |
Benchmark Period Mean (intersection) [%] |
Benchmark Period Mean (complement) [%] |
Bias [%] |
RMSE [%] |
Phase Shift [months] |
Bias Score [1] |
RMSE Score [1] |
Seasonal Cycle Score [1] |
Spatial Distribution Score [1] |
Interannual Variability Score [1] |
Overall Score [1] |
|||
|---|---|---|---|---|---|---|---|---|---|---|---|---|---|---|---|---|---|
| Benchmark | [-] | 0.115 | |||||||||||||||
| D104 | [-] | 0.215 | 0.247 | 0.0155 | 0.115 | 0.00360 | 0.125 | 0.872 | 2.35 | 0.769 | 0.322 | 0.778 | 0.463 | 0.449 | 0.517 | ||
| LMBIRCH4 | [-] | 0.220 | 0.255 | 0.0150 | 0.115 | 0.00360 | 0.133 | 0.884 | 2.35 | 0.770 | 0.321 | 0.778 | 0.444 | 0.454 | 0.515 | ||
| PHSParam | [-] | 0.230 | 0.265 | 0.0163 | 0.115 | 0.00360 | 0.143 | 0.888 | 2.35 | 0.774 | 0.316 | 0.785 | 0.460 | 0.461 | 0.519 | ||
| PPE | [-] | 0.217 | 0.251 | 0.0137 | 0.115 | 0.00360 | 0.129 | 0.716 | 2.29 | 0.753 | 0.329 | 0.786 | 0.488 | 0.469 | 0.526 | ||
| R15 | [-] | 0.177 | 0.204 | 0.0134 | 0.115 | 0.00360 | 0.0838 | 0.808 | 2.35 | 0.774 | 0.325 | 0.774 | 0.570 | 0.449 | 0.536 |
Download Data |
Period Mean (original grids) [%] |
Model Period Mean (intersection) [%] |
Model Period Mean (complement) [%] |
Benchmark Period Mean (intersection) [%] |
Benchmark Period Mean (complement) [%] |
Bias [%] |
RMSE [%] |
Phase Shift [months] |
Bias Score [1] |
RMSE Score [1] |
Seasonal Cycle Score [1] |
Spatial Distribution Score [1] |
Interannual Variability Score [1] |
Overall Score [1] |
|||
|---|---|---|---|---|---|---|---|---|---|---|---|---|---|---|---|---|---|
| Benchmark | [-] | 0.177 | |||||||||||||||
| D104 | [-] | 0.158 | 0.168 | 0.0786 | 0.178 | 0.0111 | -0.0128 | 0.646 | 1.50 | 0.712 | 0.350 | 0.845 | 0.428 | 0.462 | 0.524 | ||
| LMBIRCH4 | [-] | 0.161 | 0.171 | 0.0774 | 0.178 | 0.0111 | -0.0102 | 0.668 | 1.53 | 0.702 | 0.344 | 0.838 | 0.473 | 0.451 | 0.525 | ||
| PHSParam | [-] | 0.288 | 0.309 | 0.0809 | 0.178 | 0.0111 | 0.112 | 0.858 | 1.52 | 0.691 | 0.330 | 0.827 | 0.528 | 0.471 | 0.530 | ||
| PPE | [-] | 0.177 | 0.188 | 0.0587 | 0.178 | 0.0111 | 0.000711 | 0.620 | 1.49 | 0.722 | 0.360 | 0.847 | 0.632 | 0.464 | 0.564 | ||
| R15 | [-] | 0.159 | 0.169 | 0.0760 | 0.178 | 0.0111 | -0.0122 | 0.646 | 1.54 | 0.713 | 0.347 | 0.831 | 0.424 | 0.469 | 0.522 |
Download Data |
Period Mean (original grids) [%] |
Model Period Mean (intersection) [%] |
Model Period Mean (complement) [%] |
Benchmark Period Mean (intersection) [%] |
Benchmark Period Mean (complement) [%] |
Bias [%] |
RMSE [%] |
Phase Shift [months] |
Bias Score [1] |
RMSE Score [1] |
Seasonal Cycle Score [1] |
Spatial Distribution Score [1] |
Interannual Variability Score [1] |
Overall Score [1] |
|||
|---|---|---|---|---|---|---|---|---|---|---|---|---|---|---|---|---|---|
| Benchmark | [-] | 0.00900 | |||||||||||||||
| D104 | [-] | 0.177 | 0.191 | 0.00106 | 0.00900 | 0.00 | 0.176 | 0.679 | 2.23 | 0.718 | 0.266 | 0.857 | 0.0122 | 0.410 | 0.422 | ||
| LMBIRCH4 | [-] | 0.124 | 0.134 | 0.00310 | 0.00900 | 0.00 | 0.120 | 0.551 | 2.24 | 0.777 | 0.292 | 0.848 | 0.0220 | 0.427 | 0.443 | ||
| PHSParam | [-] | 0.146 | 0.157 | 0.00448 | 0.00900 | 0.00 | 0.143 | 0.633 | 2.20 | 0.748 | 0.274 | 0.853 | 0.0199 | 0.424 | 0.432 | ||
| PPE | [-] | 0.00566 | 0.00814 | 0.000405 | 0.00900 | 0.00 | -0.00140 | 0.0909 | 2.71 | 0.881 | 0.365 | 0.868 | 0.623 | 0.394 | 0.583 | ||
| R15 | [-] | 0.180 | 0.193 | 0.000568 | 0.00900 | 0.00 | 0.177 | 0.644 | 2.22 | 0.732 | 0.279 | 0.854 | 0.0107 | 0.429 | 0.431 |
Download Data |
Period Mean (original grids) [%] |
Model Period Mean (intersection) [%] |
Model Period Mean (complement) [%] |
Benchmark Period Mean (intersection) [%] |
Benchmark Period Mean (complement) [%] |
Bias [%] |
RMSE [%] |
Phase Shift [months] |
Bias Score [1] |
RMSE Score [1] |
Seasonal Cycle Score [1] |
Spatial Distribution Score [1] |
Interannual Variability Score [1] |
Overall Score [1] |
|||
|---|---|---|---|---|---|---|---|---|---|---|---|---|---|---|---|---|---|
| Benchmark | [-] | 0.529 | |||||||||||||||
| D104 | [-] | 0.409 | 0.425 | 0.135 | 0.531 | 0.214 | -0.136 | 2.25 | 1.61 | 0.761 | 0.364 | 0.812 | 0.538 | 0.409 | 0.541 | ||
| LMBIRCH4 | [-] | 0.476 | 0.492 | 0.201 | 0.531 | 0.214 | -0.0696 | 2.27 | 1.61 | 0.781 | 0.361 | 0.816 | 0.604 | 0.425 | 0.558 | ||
| PHSParam | [-] | 0.491 | 0.505 | 0.227 | 0.531 | 0.214 | -0.0514 | 2.33 | 1.57 | 0.779 | 0.359 | 0.823 | 0.645 | 0.426 | 0.565 | ||
| PPE | [-] | 0.719 | 0.740 | 0.360 | 0.531 | 0.214 | 0.170 | 2.36 | 1.56 | 0.807 | 0.353 | 0.808 | 0.779 | 0.439 | 0.590 | ||
| R15 | [-] | 0.395 | 0.410 | 0.136 | 0.531 | 0.214 | -0.149 | 2.21 | 1.59 | 0.769 | 0.363 | 0.816 | 0.509 | 0.417 | 0.540 |
Download Data |
Period Mean (original grids) [%] |
Model Period Mean (intersection) [%] |
Model Period Mean (complement) [%] |
Benchmark Period Mean (intersection) [%] |
Benchmark Period Mean (complement) [%] |
Bias [%] |
RMSE [%] |
Phase Shift [months] |
Bias Score [1] |
RMSE Score [1] |
Seasonal Cycle Score [1] |
Spatial Distribution Score [1] |
Interannual Variability Score [1] |
Overall Score [1] |
|||
|---|---|---|---|---|---|---|---|---|---|---|---|---|---|---|---|---|---|
| Benchmark | [-] | 0.0201 | |||||||||||||||
| D104 | [-] | 0.122 | 0.125 | 0.0810 | 0.0201 | 0.0328 | 0.106 | 0.305 | 2.13 | 0.588 | 0.231 | 0.864 | 0.118 | 0.461 | 0.416 | ||
| LMBIRCH4 | [-] | 0.130 | 0.135 | 0.0742 | 0.0201 | 0.0328 | 0.114 | 0.325 | 2.14 | 0.584 | 0.228 | 0.863 | 0.103 | 0.460 | 0.411 | ||
| PHSParam | [-] | 0.130 | 0.135 | 0.0649 | 0.0201 | 0.0328 | 0.113 | 0.331 | 2.13 | 0.596 | 0.225 | 0.866 | 0.0951 | 0.456 | 0.410 | ||
| PPE | [-] | 0.115 | 0.121 | 0.0432 | 0.0201 | 0.0328 | 0.0937 | 0.251 | 2.21 | 0.618 | 0.264 | 0.862 | 0.118 | 0.456 | 0.430 | ||
| R15 | [-] | 0.122 | 0.125 | 0.0822 | 0.0201 | 0.0328 | 0.106 | 0.321 | 2.13 | 0.600 | 0.229 | 0.862 | 0.127 | 0.468 | 0.419 |
Download Data |
Period Mean (original grids) [%] |
Model Period Mean (intersection) [%] |
Model Period Mean (complement) [%] |
Benchmark Period Mean (intersection) [%] |
Benchmark Period Mean (complement) [%] |
Bias [%] |
RMSE [%] |
Phase Shift [months] |
Bias Score [1] |
RMSE Score [1] |
Seasonal Cycle Score [1] |
Spatial Distribution Score [1] |
Interannual Variability Score [1] |
Overall Score [1] |
|||
|---|---|---|---|---|---|---|---|---|---|---|---|---|---|---|---|---|---|
| Benchmark | [-] | 0.319 | |||||||||||||||
| D104 | [-] | 0.266 | 0.318 | 0.0260 | 0.322 | 0.0200 | -0.0232 | 1.14 | 1.95 | 0.729 | 0.345 | 0.785 | 0.682 | 0.486 | 0.562 | ||
| LMBIRCH4 | [-] | 0.305 | 0.365 | 0.0282 | 0.322 | 0.0200 | 0.0209 | 1.20 | 1.96 | 0.736 | 0.330 | 0.763 | 0.766 | 0.505 | 0.572 | ||
| PHSParam | [-] | 0.329 | 0.394 | 0.0303 | 0.322 | 0.0200 | 0.0487 | 1.22 | 1.95 | 0.744 | 0.329 | 0.753 | 0.788 | 0.514 | 0.576 | ||
| PPE | [-] | 0.331 | 0.396 | 0.0282 | 0.322 | 0.0200 | 0.0499 | 1.07 | 1.98 | 0.738 | 0.347 | 0.755 | 0.802 | 0.504 | 0.582 | ||
| R15 | [-] | 0.244 | 0.292 | 0.0249 | 0.322 | 0.0200 | -0.0470 | 1.13 | 1.95 | 0.728 | 0.342 | 0.773 | 0.632 | 0.491 | 0.551 |
Download Data |
Period Mean (original grids) [%] |
Model Period Mean (intersection) [%] |
Model Period Mean (complement) [%] |
Benchmark Period Mean (intersection) [%] |
Benchmark Period Mean (complement) [%] |
Bias [%] |
RMSE [%] |
Phase Shift [months] |
Bias Score [1] |
RMSE Score [1] |
Seasonal Cycle Score [1] |
Spatial Distribution Score [1] |
Interannual Variability Score [1] |
Overall Score [1] |
|||
|---|---|---|---|---|---|---|---|---|---|---|---|---|---|---|---|---|---|
| Benchmark | [-] | 0.0194 | |||||||||||||||
| D104 | [-] | 0.0326 | 0.0962 | 0.00345 | 0.0195 | 0.00238 | 0.0788 | 0.226 | 2.44 | 0.667 | 0.308 | 0.801 | 0.206 | 0.421 | 0.452 | ||
| LMBIRCH4 | [-] | 0.0360 | 0.106 | 0.00361 | 0.0195 | 0.00238 | 0.0890 | 0.239 | 2.46 | 0.659 | 0.305 | 0.800 | 0.184 | 0.426 | 0.447 | ||
| PHSParam | [-] | 0.0377 | 0.112 | 0.00378 | 0.0195 | 0.00238 | 0.0949 | 0.251 | 2.42 | 0.652 | 0.301 | 0.799 | 0.172 | 0.425 | 0.442 | ||
| PPE | [-] | 0.0335 | 0.0992 | 0.00336 | 0.0195 | 0.00238 | 0.0791 | 0.208 | 2.47 | 0.664 | 0.311 | 0.792 | 0.219 | 0.420 | 0.453 | ||
| R15 | [-] | 0.0293 | 0.0864 | 0.00327 | 0.0195 | 0.00238 | 0.0689 | 0.214 | 2.42 | 0.673 | 0.310 | 0.806 | 0.257 | 0.420 | 0.463 |
Download Data |
Period Mean (original grids) [%] |
Model Period Mean (intersection) [%] |
Model Period Mean (complement) [%] |
Benchmark Period Mean (intersection) [%] |
Benchmark Period Mean (complement) [%] |
Bias [%] |
RMSE [%] |
Phase Shift [months] |
Bias Score [1] |
RMSE Score [1] |
Seasonal Cycle Score [1] |
Spatial Distribution Score [1] |
Interannual Variability Score [1] |
Overall Score [1] |
|||
|---|---|---|---|---|---|---|---|---|---|---|---|---|---|---|---|---|---|
| Benchmark | [-] | 0.0156 | |||||||||||||||
| D104 | [-] | 0.0164 | 0.0173 | 0.00140 | 0.0156 | 0.000305 | 7.39e-05 | 0.187 | 2.85 | 0.883 | 0.358 | 0.775 | 0.510 | 0.387 | 0.545 | ||
| LMBIRCH4 | [-] | 0.0168 | 0.0175 | 0.00183 | 0.0156 | 0.000305 | 0.000203 | 0.192 | 2.84 | 0.884 | 0.357 | 0.755 | 0.548 | 0.401 | 0.550 | ||
| PHSParam | [-] | 0.0190 | 0.0201 | 0.00204 | 0.0156 | 0.000305 | 0.00251 | 0.201 | 2.89 | 0.884 | 0.358 | 0.766 | 0.543 | 0.406 | 0.552 | ||
| PPE | [-] | 0.00998 | 0.00804 | 0.000477 | 0.0156 | 0.000305 | -0.00815 | 0.152 | 3.13 | 0.891 | 0.367 | 0.943 | 0.524 | 0.376 | 0.578 | ||
| R15 | [-] | 0.0142 | 0.0149 | 0.00127 | 0.0156 | 0.000305 | -0.00215 | 0.178 | 2.85 | 0.888 | 0.360 | 0.789 | 0.569 | 0.386 | 0.558 |
Download Data |
Period Mean (original grids) [%] |
Model Period Mean (intersection) [%] |
Model Period Mean (complement) [%] |
Benchmark Period Mean (intersection) [%] |
Benchmark Period Mean (complement) [%] |
Bias [%] |
RMSE [%] |
Phase Shift [months] |
Bias Score [1] |
RMSE Score [1] |
Seasonal Cycle Score [1] |
Spatial Distribution Score [1] |
Interannual Variability Score [1] |
Overall Score [1] |
|||
|---|---|---|---|---|---|---|---|---|---|---|---|---|---|---|---|---|---|
| Benchmark | [-] | 0.0820 | |||||||||||||||
| D104 | [-] | 0.320 | 0.350 | 0.164 | 0.0826 | 0.0262 | 0.216 | 0.697 | 1.69 | 0.631 | 0.298 | 0.822 | 0.0948 | 0.426 | 0.428 | ||
| LMBIRCH4 | [-] | 0.418 | 0.457 | 0.217 | 0.0826 | 0.0262 | 0.314 | 0.857 | 1.67 | 0.605 | 0.284 | 0.823 | 0.0555 | 0.408 | 0.410 | ||
| PHSParam | [-] | 0.409 | 0.449 | 0.209 | 0.0826 | 0.0262 | 0.304 | 0.827 | 1.60 | 0.600 | 0.280 | 0.871 | 0.0782 | 0.432 | 0.424 | ||
| PPE | [-] | 0.437 | 0.503 | 0.100 | 0.0826 | 0.0262 | 0.326 | 0.736 | 1.55 | 0.615 | 0.310 | 0.879 | 0.0626 | 0.460 | 0.439 | ||
| R15 | [-] | 0.275 | 0.296 | 0.166 | 0.0826 | 0.0262 | 0.179 | 0.656 | 1.68 | 0.630 | 0.295 | 0.824 | 0.132 | 0.419 | 0.433 |
Download Data |
Period Mean (original grids) [%] |
Model Period Mean (intersection) [%] |
Model Period Mean (complement) [%] |
Benchmark Period Mean (intersection) [%] |
Benchmark Period Mean (complement) [%] |
Bias [%] |
RMSE [%] |
Phase Shift [months] |
Bias Score [1] |
RMSE Score [1] |
Seasonal Cycle Score [1] |
Spatial Distribution Score [1] |
Interannual Variability Score [1] |
Overall Score [1] |
|||
|---|---|---|---|---|---|---|---|---|---|---|---|---|---|---|---|---|---|
| Benchmark | [-] | 0.0297 | |||||||||||||||
| D104 | [-] | 0.0346 | 0.0380 | 0.00609 | 0.0298 | 0.00847 | 0.00712 | 0.190 | 3.02 | 0.677 | 0.270 | 0.534 | 0.589 | 0.424 | 0.461 | ||
| LMBIRCH4 | [-] | 0.0324 | 0.0361 | 0.00587 | 0.0298 | 0.00847 | 0.00541 | 0.177 | 2.98 | 0.663 | 0.290 | 0.549 | 0.592 | 0.429 | 0.469 | ||
| PHSParam | [-] | 0.0246 | 0.0283 | 0.00574 | 0.0298 | 0.00847 | -0.00179 | 0.157 | 3.02 | 0.681 | 0.299 | 0.554 | 0.567 | 0.447 | 0.475 | ||
| PPE | [-] | 0.0304 | 0.0345 | 0.0128 | 0.0298 | 0.00847 | 0.00463 | 0.143 | 3.09 | 0.690 | 0.311 | 0.564 | 0.580 | 0.458 | 0.485 | ||
| R15 | [-] | 0.0268 | 0.0298 | 0.00515 | 0.0298 | 0.00847 | -0.000947 | 0.173 | 2.96 | 0.688 | 0.278 | 0.566 | 0.458 | 0.430 | 0.450 |
Download Data |
Period Mean (original grids) [%] |
Model Period Mean (intersection) [%] |
Model Period Mean (complement) [%] |
Benchmark Period Mean (intersection) [%] |
Benchmark Period Mean (complement) [%] |
Bias [%] |
RMSE [%] |
Phase Shift [months] |
Bias Score [1] |
RMSE Score [1] |
Seasonal Cycle Score [1] |
Spatial Distribution Score [1] |
Interannual Variability Score [1] |
Overall Score [1] |
|||
|---|---|---|---|---|---|---|---|---|---|---|---|---|---|---|---|---|---|
| Benchmark | [-] | 0.0271 | |||||||||||||||
| D104 | [-] | 0.0194 | 0.0227 | 0.00279 | 0.0272 | 0.000329 | -0.00587 | 0.258 | 2.25 | 0.868 | 0.350 | 0.850 | 0.514 | 0.414 | 0.558 | ||
| LMBIRCH4 | [-] | 0.0206 | 0.0251 | 0.00217 | 0.0272 | 0.000329 | -0.00337 | 0.271 | 2.27 | 0.861 | 0.341 | 0.840 | 0.536 | 0.415 | 0.556 | ||
| PHSParam | [-] | 0.0229 | 0.0268 | 0.00259 | 0.0272 | 0.000329 | -0.00185 | 0.274 | 2.25 | 0.861 | 0.340 | 0.845 | 0.521 | 0.418 | 0.554 | ||
| PPE | [-] | 0.0220 | 0.0277 | 0.00465 | 0.0272 | 0.000329 | -0.000811 | 0.251 | 2.28 | 0.877 | 0.360 | 0.845 | 0.587 | 0.405 | 0.572 | ||
| R15 | [-] | 0.0159 | 0.0186 | 0.00236 | 0.0272 | 0.000329 | -0.00978 | 0.249 | 2.25 | 0.872 | 0.352 | 0.851 | 0.592 | 0.414 | 0.572 |
Download Data |
Period Mean (original grids) [%] |
Model Period Mean (intersection) [%] |
Model Period Mean (complement) [%] |
Benchmark Period Mean (intersection) [%] |
Benchmark Period Mean (complement) [%] |
Bias [%] |
RMSE [%] |
Phase Shift [months] |
Bias Score [1] |
RMSE Score [1] |
Seasonal Cycle Score [1] |
Spatial Distribution Score [1] |
Interannual Variability Score [1] |
Overall Score [1] |
|||
|---|---|---|---|---|---|---|---|---|---|---|---|---|---|---|---|---|---|
| Benchmark | [-] | 0.0297 | |||||||||||||||
| D104 | [-] | 0.149 | 0.148 | 0.249 | 0.0297 | 0.0588 | 0.115 | 0.468 | 1.87 | 0.719 | 0.285 | 0.837 | 0.108 | 0.410 | 0.441 | ||
| LMBIRCH4 | [-] | 0.195 | 0.194 | 0.254 | 0.0297 | 0.0588 | 0.159 | 0.569 | 1.85 | 0.669 | 0.263 | 0.851 | 0.0780 | 0.412 | 0.423 | ||
| PHSParam | [-] | 0.191 | 0.190 | 0.257 | 0.0297 | 0.0588 | 0.156 | 0.568 | 1.87 | 0.686 | 0.271 | 0.847 | 0.0671 | 0.405 | 0.425 | ||
| PPE | [-] | 0.203 | 0.200 | 0.0998 | 0.0297 | 0.0588 | 0.162 | 0.480 | 1.88 | 0.686 | 0.289 | 0.845 | 0.0714 | 0.417 | 0.433 | ||
| R15 | [-] | 0.128 | 0.127 | 0.213 | 0.0297 | 0.0588 | 0.0953 | 0.421 | 1.90 | 0.730 | 0.289 | 0.835 | 0.136 | 0.419 | 0.450 |
Download Data |
Period Mean (original grids) [%] |
Model Period Mean (intersection) [%] |
Model Period Mean (complement) [%] |
Benchmark Period Mean (intersection) [%] |
Benchmark Period Mean (complement) [%] |
Bias [%] |
RMSE [%] |
Phase Shift [months] |
Bias Score [1] |
RMSE Score [1] |
Seasonal Cycle Score [1] |
Spatial Distribution Score [1] |
Interannual Variability Score [1] |
Overall Score [1] |
|||
|---|---|---|---|---|---|---|---|---|---|---|---|---|---|---|---|---|---|
| Benchmark | [-] | 0.125 | |||||||||||||||
| D104 | [-] | 0.0969 | 0.101 | 0.0964 | 0.125 | 0.0211 | -0.0229 | 0.457 | 1.30 | 0.682 | 0.322 | 0.869 | 0.675 | 0.434 | 0.551 | ||
| LMBIRCH4 | [-] | 0.0959 | 0.103 | 0.0893 | 0.125 | 0.0211 | -0.0212 | 0.465 | 1.30 | 0.676 | 0.317 | 0.869 | 0.672 | 0.414 | 0.544 | ||
| PHSParam | [-] | 0.182 | 0.175 | 0.182 | 0.125 | 0.0211 | 0.0530 | 0.586 | 1.28 | 0.669 | 0.291 | 0.875 | 0.471 | 0.405 | 0.500 | ||
| PPE | [-] | 0.120 | 0.121 | 0.0978 | 0.125 | 0.0211 | -0.00455 | 0.417 | 1.25 | 0.690 | 0.351 | 0.902 | 0.690 | 0.477 | 0.577 | ||
| R15 | [-] | 0.0991 | 0.102 | 0.106 | 0.125 | 0.0211 | -0.0213 | 0.461 | 1.29 | 0.682 | 0.320 | 0.871 | 0.675 | 0.438 | 0.551 |
Download Data |
Period Mean (original grids) [%] |
Model Period Mean (intersection) [%] |
Model Period Mean (complement) [%] |
Benchmark Period Mean (intersection) [%] |
Benchmark Period Mean (complement) [%] |
Bias [%] |
RMSE [%] |
Phase Shift [months] |
Bias Score [1] |
RMSE Score [1] |
Seasonal Cycle Score [1] |
Spatial Distribution Score [1] |
Interannual Variability Score [1] |
Overall Score [1] |
|||
|---|---|---|---|---|---|---|---|---|---|---|---|---|---|---|---|---|---|
| Benchmark | [-] | 0.224 | |||||||||||||||
| D104 | [-] | 0.475 | 0.485 | 0.0783 | 0.225 | 0.00895 | 0.237 | 1.15 | 1.38 | 0.665 | 0.312 | 0.875 | 0.605 | 0.477 | 0.541 | ||
| LMBIRCH4 | [-] | 0.525 | 0.532 | 0.0801 | 0.225 | 0.00895 | 0.285 | 1.24 | 1.45 | 0.644 | 0.288 | 0.857 | 0.509 | 0.477 | 0.511 | ||
| PHSParam | [-] | 0.603 | 0.639 | 0.0986 | 0.225 | 0.00895 | 0.384 | 1.39 | 1.33 | 0.613 | 0.271 | 0.886 | 0.410 | 0.470 | 0.487 | ||
| PPE | [-] | 0.553 | 0.564 | 0.0942 | 0.225 | 0.00895 | 0.311 | 1.11 | 1.39 | 0.636 | 0.314 | 0.872 | 0.414 | 0.482 | 0.505 | ||
| R15 | [-] | 0.440 | 0.450 | 0.0673 | 0.225 | 0.00895 | 0.204 | 1.12 | 1.38 | 0.672 | 0.316 | 0.875 | 0.620 | 0.471 | 0.545 |
Download Data |
Period Mean (original grids) [%] |
Model Period Mean (intersection) [%] |
Model Period Mean (complement) [%] |
Benchmark Period Mean (intersection) [%] |
Benchmark Period Mean (complement) [%] |
Bias [%] |
RMSE [%] |
Phase Shift [months] |
Bias Score [1] |
RMSE Score [1] |
Seasonal Cycle Score [1] |
Spatial Distribution Score [1] |
Interannual Variability Score [1] |
Overall Score [1] |
|||
|---|---|---|---|---|---|---|---|---|---|---|---|---|---|---|---|---|---|
| Benchmark | [-] | 0.0270 | |||||||||||||||
| D104 | [-] | 0.241 | 0.236 | 0.144 | 0.0272 | 0.00237 | 0.192 | 0.505 | 1.71 | 0.755 | 0.309 | 0.846 | 0.0833 | 0.401 | 0.451 | ||
| LMBIRCH4 | [-] | 0.250 | 0.242 | 0.144 | 0.0272 | 0.00237 | 0.197 | 0.507 | 1.70 | 0.757 | 0.311 | 0.845 | 0.0809 | 0.405 | 0.452 | ||
| PHSParam | [-] | 0.293 | 0.263 | 0.163 | 0.0272 | 0.00237 | 0.215 | 0.538 | 1.69 | 0.754 | 0.308 | 0.853 | 0.0783 | 0.403 | 0.451 | ||
| PPE | [-] | 0.195 | 0.192 | 0.115 | 0.0272 | 0.00237 | 0.154 | 0.386 | 1.69 | 0.740 | 0.316 | 0.854 | 0.152 | 0.408 | 0.464 | ||
| R15 | [-] | 0.226 | 0.219 | 0.133 | 0.0272 | 0.00237 | 0.176 | 0.486 | 1.69 | 0.759 | 0.311 | 0.858 | 0.0932 | 0.401 | 0.456 |
Temporally integrated period mean