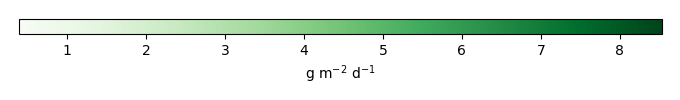
Mean State
Download Data |
Period Mean (original grids) [g m-2 d-1] |
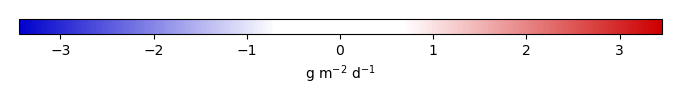
Bias [g m-2 d-1] |
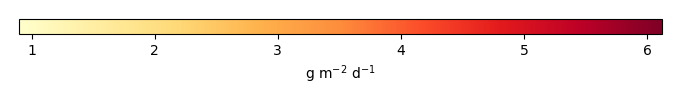
RMSE [g m-2 d-1] |
Phase Shift [months] |
Bias Score [1] |
RMSE Score [1] |
Seasonal Cycle Score [1] |
Interannual Variability Score [1] |
Overall Score [1] |
|||
|---|---|---|---|---|---|---|---|---|---|---|---|---|
| Benchmark | [-] | 1.90 | ||||||||||
| D104 | [-] | 1.51 | -0.397 | 1.82 | 0.492 | 0.818 | 0.393 | 0.970 | 0.578 | 0.630 | ||
| LMBIRCH4 | [-] | 2.81 | 0.904 | 2.41 | 0.492 | 0.652 | 0.357 | 0.970 | 0.646 | 0.597 | ||
| PHSParam | [-] | 1.63 | -0.274 | 1.89 | 0.492 | 0.869 | 0.372 | 0.970 | 0.553 | 0.627 | ||
| PPE | [-] | 1.48 | -0.426 | 1.67 | 0.492 | 0.795 | 0.434 | 0.970 | 0.649 | 0.656 | ||
| R15 | [-] | 1.39 | -0.510 | 2.00 | 0.492 | 0.787 | 0.365 | 0.970 | 0.540 | 0.605 |
Download Data |
Period Mean (original grids) [g m-2 d-1] |
Bias [g m-2 d-1] |
RMSE [g m-2 d-1] |
Phase Shift [months] |
Bias Score [1] |
RMSE Score [1] |
Seasonal Cycle Score [1] |
Interannual Variability Score [1] |
Overall Score [1] |
|||
|---|---|---|---|---|---|---|---|---|---|---|---|---|
| Benchmark | [-] | 1.45 | ||||||||||
| D104 | [-] | 1.52 | 0.0700 | 2.90 | 0.00 | 0.948 | 0.114 | 1.00 | 0.336 | 0.503 | ||
| LMBIRCH4 | [-] | 0.831 | -0.618 | 1.68 | 0.00 | 0.627 | 0.261 | 1.00 | 0.749 | 0.580 | ||
| PHSParam | [-] | 1.08 | -0.370 | 2.01 | 0.00 | 0.756 | 0.203 | 1.00 | 0.597 | 0.552 | ||
| PPE | [-] | 0.970 | -0.479 | 1.97 | 0.00 | 0.697 | 0.209 | 1.00 | 0.605 | 0.544 | ||
| R15 | [-] | 1.81 | 0.358 | 3.64 | 0.00 | 0.763 | 0.0708 | 1.00 | 0.219 | 0.425 |
Download Data |
Period Mean (original grids) [g m-2 d-1] |
Bias [g m-2 d-1] |
RMSE [g m-2 d-1] |
Phase Shift [months] |
Bias Score [1] |
RMSE Score [1] |
Seasonal Cycle Score [1] |
Interannual Variability Score [1] |
Overall Score [1] |
|||
|---|---|---|---|---|---|---|---|---|---|---|---|---|
| Benchmark | [-] | 8.69 | ||||||||||
| D104 | [-] | 7.52 | -1.17 | 1.70 | 3.05 | 0.414 | 0.358 | 0.498 | 0.476 | 0.421 | ||
| LMBIRCH4 | [-] | 7.55 | -1.14 | 1.69 | 3.05 | 0.423 | 0.357 | 0.498 | 0.479 | 0.423 | ||
| PHSParam | [-] | 8.59 | -0.101 | 1.35 | 3.05 | 0.927 | 0.361 | 0.498 | 0.477 | 0.525 | ||
| PPE | [-] | 9.06 | 0.373 | 1.44 | 3.05 | 0.755 | 0.361 | 0.498 | 0.485 | 0.492 | ||
| R15 | [-] | 6.96 | -1.73 | 2.11 | 3.05 | 0.271 | 0.359 | 0.498 | 0.458 | 0.389 |
Download Data |
Period Mean (original grids) [g m-2 d-1] |
Bias [g m-2 d-1] |
RMSE [g m-2 d-1] |
Phase Shift [months] |
Bias Score [1] |
RMSE Score [1] |
Seasonal Cycle Score [1] |
Interannual Variability Score [1] |
Overall Score [1] |
|||
|---|---|---|---|---|---|---|---|---|---|---|---|---|
| Benchmark | [-] | 1.87 | ||||||||||
| D104 | [-] | 2.68 | 0.807 | 2.23 | 0.00 | 0.663 | 0.388 | 1.00 | 0.603 | 0.608 | ||
| LMBIRCH4 | [-] | 2.57 | 0.692 | 2.09 | 0.508 | 0.702 | 0.405 | 0.963 | 0.633 | 0.621 | ||
| PHSParam | [-] | 2.56 | 0.689 | 2.05 | 0.00 | 0.704 | 0.414 | 1.00 | 0.648 | 0.636 | ||
| PPE | [-] | 2.75 | 0.880 | 2.33 | 0.00 | 0.638 | 0.375 | 1.00 | 0.579 | 0.593 | ||
| R15 | [-] | 2.81 | 0.939 | 2.44 | 0.00 | 0.622 | 0.358 | 1.00 | 0.563 | 0.580 |
Download Data |
Period Mean (original grids) [g m-2 d-1] |
Bias [g m-2 d-1] |
RMSE [g m-2 d-1] |
Phase Shift [months] |
Bias Score [1] |
RMSE Score [1] |
Seasonal Cycle Score [1] |
Interannual Variability Score [1] |
Overall Score [1] |
|||
|---|---|---|---|---|---|---|---|---|---|---|---|---|
| Benchmark | [-] | 4.97 | ||||||||||
| D104 | [-] | 6.02 | 1.05 | 5.53 | 2.56 | 0.134 | 0.354 | 0.643 | 0.787 | 0.454 | ||
| LMBIRCH4 | [-] | 5.90 | 0.934 | 5.37 | 2.56 | 0.141 | 0.351 | 0.643 | 0.791 | 0.455 | ||
| PHSParam | [-] | 5.41 | 0.442 | 4.82 | 1.54 | 0.167 | 0.316 | 0.820 | 0.930 | 0.510 | ||
| PPE | [-] | 5.37 | 0.397 | 4.81 | 1.54 | 0.162 | 0.334 | 0.820 | 0.927 | 0.515 | ||
| R15 | [-] | 5.91 | 0.944 | 5.50 | 2.05 | 0.132 | 0.357 | 0.745 | 0.773 | 0.473 |
Download Data |
Period Mean (original grids) [g m-2 d-1] |
Bias [g m-2 d-1] |
RMSE [g m-2 d-1] |
Phase Shift [months] |
Bias Score [1] |
RMSE Score [1] |
Seasonal Cycle Score [1] |
Interannual Variability Score [1] |
Overall Score [1] |
|||
|---|---|---|---|---|---|---|---|---|---|---|---|---|
| Benchmark | [-] | 3.63 | ||||||||||
| D104 | [-] | 3.01 | -0.624 | 2.39 | 0.665 | 0.668 | 0.527 | 0.943 | 0.752 | 0.684 | ||
| LMBIRCH4 | [-] | 2.98 | -0.649 | 2.39 | 0.684 | 0.670 | 0.524 | 0.943 | 0.744 | 0.681 | ||
| PHSParam | [-] | 3.16 | -0.472 | 2.27 | 0.665 | 0.701 | 0.532 | 0.943 | 0.753 | 0.692 | ||
| PPE | [-] | 3.19 | -0.446 | 2.33 | 0.684 | 0.698 | 0.529 | 0.943 | 0.750 | 0.690 | ||
| R15 | [-] | 2.97 | -0.659 | 2.43 | 0.665 | 0.663 | 0.531 | 0.943 | 0.755 | 0.684 |
Download Data |
Period Mean (original grids) [g m-2 d-1] |
Bias [g m-2 d-1] |
RMSE [g m-2 d-1] |
Phase Shift [months] |
Bias Score [1] |
RMSE Score [1] |
Seasonal Cycle Score [1] |
Interannual Variability Score [1] |
Overall Score [1] |
|||
|---|---|---|---|---|---|---|---|---|---|---|---|---|
| Benchmark | [-] | 3.27 | ||||||||||
| D104 | [-] | 2.97 | -0.297 | 2.44 | 0.822 | 0.648 | 0.499 | 0.898 | 0.718 | 0.653 | ||
| LMBIRCH4 | [-] | 3.09 | -0.177 | 2.44 | 0.871 | 0.662 | 0.495 | 0.896 | 0.726 | 0.655 | ||
| PHSParam | [-] | 3.19 | -0.0802 | 2.35 | 0.793 | 0.689 | 0.497 | 0.903 | 0.739 | 0.665 | ||
| PPE | [-] | 3.26 | -0.00547 | 2.40 | 0.862 | 0.676 | 0.495 | 0.901 | 0.737 | 0.661 | ||
| R15 | [-] | 2.94 | -0.327 | 2.49 | 0.813 | 0.637 | 0.500 | 0.901 | 0.715 | 0.651 |
Download Data |
Period Mean (original grids) [g m-2 d-1] |
Bias [g m-2 d-1] |
RMSE [g m-2 d-1] |
Phase Shift [months] |
Bias Score [1] |
RMSE Score [1] |
Seasonal Cycle Score [1] |
Interannual Variability Score [1] |
Overall Score [1] |
|||
|---|---|---|---|---|---|---|---|---|---|---|---|---|
| Benchmark | [-] | 1.98 | ||||||||||
| D104 | [-] | 1.04 | -0.936 | 1.29 | 2.03 | 0.510 | 0.485 | 0.749 | 0.795 | 0.605 | ||
| LMBIRCH4 | [-] | 1.04 | -0.942 | 1.30 | 2.03 | 0.508 | 0.485 | 0.749 | 0.792 | 0.604 | ||
| PHSParam | [-] | 1.06 | -0.915 | 1.39 | 2.03 | 0.518 | 0.435 | 0.749 | 0.730 | 0.573 | ||
| PPE | [-] | 1.07 | -0.906 | 1.39 | 2.03 | 0.521 | 0.434 | 0.749 | 0.730 | 0.573 | ||
| R15 | [-] | 0.957 | -1.02 | 1.37 | 2.03 | 0.480 | 0.478 | 0.749 | 0.745 | 0.586 |
Download Data |
Period Mean (original grids) [g m-2 d-1] |
Bias [g m-2 d-1] |
RMSE [g m-2 d-1] |
Phase Shift [months] |
Bias Score [1] |
RMSE Score [1] |
Seasonal Cycle Score [1] |
Interannual Variability Score [1] |
Overall Score [1] |
|||
|---|---|---|---|---|---|---|---|---|---|---|---|---|
| Benchmark | [-] | 3.69 | ||||||||||
| D104 | [-] | 3.19 | -0.492 | 2.70 | 1.31 | 0.759 | 0.532 | 0.830 | 0.747 | 0.680 | ||
| LMBIRCH4 | [-] | 3.44 | -0.242 | 2.67 | 1.31 | 0.806 | 0.531 | 0.830 | 0.771 | 0.694 | ||
| PHSParam | [-] | 3.54 | -0.145 | 2.67 | 1.31 | 0.781 | 0.530 | 0.830 | 0.781 | 0.690 | ||
| PPE | [-] | 3.63 | -0.0512 | 2.57 | 1.31 | 0.769 | 0.542 | 0.830 | 0.798 | 0.696 | ||
| R15 | [-] | 3.14 | -0.548 | 2.71 | 1.31 | 0.749 | 0.533 | 0.830 | 0.745 | 0.678 |
Download Data |
Period Mean (original grids) [g m-2 d-1] |
Bias [g m-2 d-1] |
RMSE [g m-2 d-1] |
Phase Shift [months] |
Bias Score [1] |
RMSE Score [1] |
Seasonal Cycle Score [1] |
Interannual Variability Score [1] |
Overall Score [1] |
|||
|---|---|---|---|---|---|---|---|---|---|---|---|---|
| Benchmark | [-] | 1.64 | ||||||||||
| D104 | [-] | 2.77 | 1.13 | 2.15 | 0.293 | 0.579 | 0.446 | 0.980 | 0.615 | 0.613 | ||
| LMBIRCH4 | [-] | 2.86 | 1.23 | 2.35 | 0.583 | 0.550 | 0.410 | 0.956 | 0.572 | 0.579 | ||
| PHSParam | [-] | 2.90 | 1.26 | 2.27 | 0.293 | 0.561 | 0.426 | 0.980 | 0.602 | 0.599 | ||
| PPE | [-] | 3.08 | 1.45 | 2.57 | 0.729 | 0.529 | 0.386 | 0.944 | 0.562 | 0.561 | ||
| R15 | [-] | 2.81 | 1.17 | 2.20 | 0.293 | 0.573 | 0.437 | 0.980 | 0.610 | 0.608 |
Download Data |
Period Mean (original grids) [g m-2 d-1] |
Bias [g m-2 d-1] |
RMSE [g m-2 d-1] |
Phase Shift [months] |
Bias Score [1] |
RMSE Score [1] |
Seasonal Cycle Score [1] |
Interannual Variability Score [1] |
Overall Score [1] |
|||
|---|---|---|---|---|---|---|---|---|---|---|---|---|
| Benchmark | [-] | 1.85 | ||||||||||
| D104 | [-] | 1.25 | -0.601 | 2.43 | 1.02 | 0.433 | 0.357 | 0.881 | 0.465 | 0.499 | ||
| LMBIRCH4 | [-] | 2.12 | 0.268 | 1.95 | 0.847 | 0.647 | 0.364 | 0.902 | 0.693 | 0.594 | ||
| PHSParam | [-] | 2.36 | 0.507 | 2.02 | 0.847 | 0.621 | 0.360 | 0.902 | 0.547 | 0.558 | ||
| PPE | [-] | 2.48 | 0.632 | 2.02 | 0.847 | 0.630 | 0.359 | 0.902 | 0.557 | 0.561 | ||
| R15 | [-] | 1.26 | -0.590 | 2.40 | 1.02 | 0.456 | 0.361 | 0.881 | 0.479 | 0.508 |
Download Data |
Period Mean (original grids) [g m-2 d-1] |
Bias [g m-2 d-1] |
RMSE [g m-2 d-1] |
Phase Shift [months] |
Bias Score [1] |
RMSE Score [1] |
Seasonal Cycle Score [1] |
Interannual Variability Score [1] |
Overall Score [1] |
|||
|---|---|---|---|---|---|---|---|---|---|---|---|---|
| Benchmark | [-] | 7.40 | ||||||||||
| D104 | [-] | 5.99 | -1.41 | 1.76 | 1.02 | 0.264 | 0.361 | 0.933 | 0.593 | 0.502 | ||
| LMBIRCH4 | [-] | 6.06 | -1.34 | 1.70 | 1.02 | 0.283 | 0.362 | 0.933 | 0.613 | 0.510 | ||
| PHSParam | [-] | 5.47 | -1.94 | 2.42 | 1.02 | 0.162 | 0.258 | 0.933 | 0.848 | 0.492 | ||
| PPE | [-] | 5.83 | -1.57 | 2.20 | 1.02 | 0.227 | 0.242 | 0.933 | 0.773 | 0.483 | ||
| R15 | [-] | 5.79 | -1.61 | 1.90 | 1.02 | 0.220 | 0.367 | 0.933 | 0.534 | 0.484 |
Temporally integrated period mean