Mean State
Download Data |
Period Mean (original grids) [Pg yr-1] |
Model Period Mean (intersection) [Pg yr-1] |
Model Period Mean (complement) [Pg yr-1] |
Benchmark Period Mean (intersection) [Pg yr-1] |
Benchmark Period Mean (complement) [Pg yr-1] |
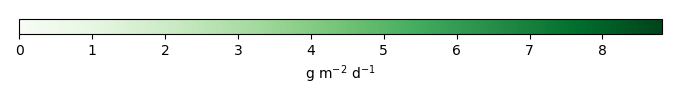
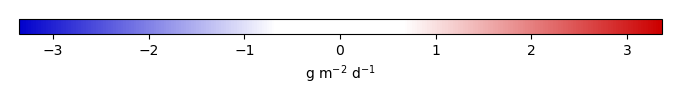
Bias [g m-2 d-1] |
RMSE [g m-2 d-1] |
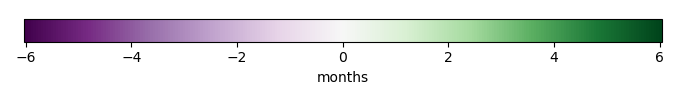
Phase Shift [months] |
Bias Score [1] |
RMSE Score [1] |
Seasonal Cycle Score [1] |
Spatial Distribution Score [1] |
Overall Score [1] |
|||
|---|---|---|---|---|---|---|---|---|---|---|---|---|---|---|---|---|
| Benchmark | [-] | 8.19 | ||||||||||||||
| D104 | [-] | 7.91 | 6.94 | 0.357 | 8.21 | 0.000187 | -0.508 | 1.59 | 2.22 | 0.356 | 0.284 | 0.600 | 0.976 | 0.500 | ||
| LMBIRCH4 | [-] | 8.35 | 7.21 | 0.368 | 8.19 | 0.000184 | -0.308 | 1.65 | 2.14 | 0.363 | 0.254 | 0.604 | 0.980 | 0.491 | ||
| PHSParam | [-] | 8.06 | 7.10 | 0.359 | 8.19 | 0.000184 | -0.391 | 1.66 | 2.05 | 0.361 | 0.219 | 0.624 | 0.983 | 0.481 | ||
| PPE | [-] | 8.59 | 7.57 | 0.370 | 8.19 | 0.000184 | -0.0832 | 1.64 | 2.09 | 0.388 | 0.209 | 0.623 | 0.986 | 0.483 | ||
| R15 | [-] | 7.68 | 6.66 | 0.359 | 8.19 | 0.000184 | -0.670 | 1.72 | 2.21 | 0.302 | 0.279 | 0.583 | 0.963 | 0.481 |
Download Data |
Period Mean (original grids) [Pg yr-1] |
Model Period Mean (intersection) [Pg yr-1] |
Model Period Mean (complement) [Pg yr-1] |
Benchmark Period Mean (intersection) [Pg yr-1] |
Benchmark Period Mean (complement) [Pg yr-1] |
Bias [g m-2 d-1] |
RMSE [g m-2 d-1] |
Phase Shift [months] |
Bias Score [1] |
RMSE Score [1] |
Seasonal Cycle Score [1] |
Spatial Distribution Score [1] |
Overall Score [1] |
|||
|---|---|---|---|---|---|---|---|---|---|---|---|---|---|---|---|---|
| Benchmark | [-] | 5.55 | ||||||||||||||
| D104 | [-] | 4.83 | 5.22 | 0.0552 | 5.66 | -0.142 | 1.72 | 1.58 | 0.597 | 0.426 | 0.732 | 0.838 | 0.604 | |||
| LMBIRCH4 | [-] | 4.17 | 4.62 | 0.0565 | 5.55 | -0.334 | 1.93 | 1.59 | 0.488 | 0.406 | 0.726 | 0.879 | 0.581 | |||
| PHSParam | [-] | 3.75 | 4.15 | 0.0470 | 5.55 | -0.525 | 1.93 | 1.61 | 0.469 | 0.409 | 0.713 | 0.762 | 0.552 | |||
| PPE | [-] | 3.68 | 4.10 | 0.0503 | 5.55 | -0.546 | 2.00 | 1.54 | 0.450 | 0.400 | 0.731 | 0.859 | 0.568 | |||
| R15 | [-] | 4.58 | 4.98 | 0.0559 | 5.55 | -0.191 | 1.78 | 1.65 | 0.556 | 0.417 | 0.717 | 0.829 | 0.587 |
Download Data |
Period Mean (original grids) [Pg yr-1] |
Model Period Mean (intersection) [Pg yr-1] |
Model Period Mean (complement) [Pg yr-1] |
Benchmark Period Mean (intersection) [Pg yr-1] |
Benchmark Period Mean (complement) [Pg yr-1] |
Bias [g m-2 d-1] |
RMSE [g m-2 d-1] |
Phase Shift [months] |
Bias Score [1] |
RMSE Score [1] |
Seasonal Cycle Score [1] |
Spatial Distribution Score [1] |
Overall Score [1] |
|||
|---|---|---|---|---|---|---|---|---|---|---|---|---|---|---|---|---|
| Benchmark | [-] | 9.94 | ||||||||||||||
| D104 | [-] | 7.40 | 6.84 | 0.512 | 9.93 | 0.00241 | -0.669 | 2.04 | 1.39 | 0.407 | 0.376 | 0.819 | 0.921 | 0.580 | ||
| LMBIRCH4 | [-] | 7.36 | 6.88 | 0.517 | 9.93 | 0.00241 | -0.661 | 2.10 | 1.64 | 0.388 | 0.365 | 0.764 | 0.907 | 0.558 | ||
| PHSParam | [-] | 6.73 | 6.20 | 0.487 | 9.93 | 0.00241 | -0.880 | 2.16 | 1.57 | 0.364 | 0.362 | 0.768 | 0.909 | 0.553 | ||
| PPE | [-] | 6.88 | 6.40 | 0.466 | 9.93 | 0.00241 | -0.827 | 2.20 | 1.47 | 0.364 | 0.358 | 0.781 | 0.902 | 0.552 | ||
| R15 | [-] | 7.02 | 6.53 | 0.493 | 9.93 | 0.00241 | -0.773 | 2.12 | 1.44 | 0.383 | 0.369 | 0.813 | 0.911 | 0.569 |
Download Data |
Period Mean (original grids) [Pg yr-1] |
Model Period Mean (intersection) [Pg yr-1] |
Model Period Mean (complement) [Pg yr-1] |
Benchmark Period Mean (intersection) [Pg yr-1] |
Benchmark Period Mean (complement) [Pg yr-1] |
Bias [g m-2 d-1] |
RMSE [g m-2 d-1] |
Phase Shift [months] |
Bias Score [1] |
RMSE Score [1] |
Seasonal Cycle Score [1] |
Spatial Distribution Score [1] |
Overall Score [1] |
|||
|---|---|---|---|---|---|---|---|---|---|---|---|---|---|---|---|---|
| Benchmark | [-] | 1.03 | ||||||||||||||
| D104 | [-] | 1.60 | 1.50 | 0.0907 | 1.04 | 0.00178 | 0.533 | 1.80 | 0.103 | 0.600 | 0.415 | 0.993 | 0.566 | 0.598 | ||
| LMBIRCH4 | [-] | 1.09 | 1.02 | 0.0754 | 1.03 | 0.00177 | 0.123 | 1.43 | 0.398 | 0.660 | 0.447 | 0.957 | 0.651 | 0.633 | ||
| PHSParam | [-] | 1.25 | 1.17 | 0.0770 | 1.03 | 0.00177 | 0.246 | 1.53 | 0.449 | 0.622 | 0.441 | 0.954 | 0.593 | 0.610 | ||
| PPE | [-] | 1.35 | 1.29 | 0.0758 | 1.03 | 0.00177 | 0.352 | 1.77 | 0.262 | 0.587 | 0.365 | 0.978 | 0.586 | 0.576 | ||
| R15 | [-] | 1.62 | 1.51 | 0.0910 | 1.03 | 0.00177 | 0.559 | 1.93 | 0.167 | 0.570 | 0.381 | 0.990 | 0.580 | 0.581 |
Download Data |
Period Mean (original grids) [Pg yr-1] |
Model Period Mean (intersection) [Pg yr-1] |
Model Period Mean (complement) [Pg yr-1] |
Benchmark Period Mean (intersection) [Pg yr-1] |
Benchmark Period Mean (complement) [Pg yr-1] |
Bias [g m-2 d-1] |
RMSE [g m-2 d-1] |
Phase Shift [months] |
Bias Score [1] |
RMSE Score [1] |
Seasonal Cycle Score [1] |
Spatial Distribution Score [1] |
Overall Score [1] |
|||
|---|---|---|---|---|---|---|---|---|---|---|---|---|---|---|---|---|
| Benchmark | [-] | 7.13 | ||||||||||||||
| D104 | [-] | 6.46 | 4.93 | 1.29 | 7.07 | 0.0686 | 0.655 | 2.25 | 1.88 | 0.128 | 0.173 | 0.744 | 0.237 | 0.291 | ||
| LMBIRCH4 | [-] | 6.49 | 4.95 | 1.29 | 7.07 | 0.0686 | 0.687 | 2.25 | 1.90 | 0.130 | 0.173 | 0.740 | 0.230 | 0.289 | ||
| PHSParam | [-] | 6.83 | 5.24 | 1.33 | 7.07 | 0.0686 | 1.07 | 2.26 | 1.80 | 0.205 | 0.156 | 0.755 | 0.351 | 0.325 | ||
| PPE | [-] | 7.16 | 5.50 | 1.39 | 7.07 | 0.0686 | 1.42 | 2.32 | 1.85 | 0.219 | 0.151 | 0.752 | 0.404 | 0.335 | ||
| R15 | [-] | 6.10 | 4.62 | 1.23 | 7.07 | 0.0686 | 0.261 | 2.35 | 1.85 | 0.0964 | 0.190 | 0.750 | 0.197 | 0.285 |
Download Data |
Period Mean (original grids) [Pg yr-1] |
Model Period Mean (intersection) [Pg yr-1] |
Model Period Mean (complement) [Pg yr-1] |
Benchmark Period Mean (intersection) [Pg yr-1] |
Benchmark Period Mean (complement) [Pg yr-1] |
Bias [g m-2 d-1] |
RMSE [g m-2 d-1] |
Phase Shift [months] |
Bias Score [1] |
RMSE Score [1] |
Seasonal Cycle Score [1] |
Spatial Distribution Score [1] |
Overall Score [1] |
|||
|---|---|---|---|---|---|---|---|---|---|---|---|---|---|---|---|---|
| Benchmark | [-] | 6.86 | ||||||||||||||
| D104 | [-] | 7.39 | 7.08 | 0.120 | 6.89 | 0.00299 | 0.107 | 1.32 | 0.430 | 0.802 | 0.669 | 0.970 | 0.864 | 0.795 | ||
| LMBIRCH4 | [-] | 7.20 | 6.89 | 0.126 | 6.85 | 0.00298 | 0.0651 | 1.44 | 0.718 | 0.786 | 0.645 | 0.953 | 0.853 | 0.776 | ||
| PHSParam | [-] | 7.42 | 7.12 | 0.119 | 6.85 | 0.00298 | 0.133 | 1.31 | 0.434 | 0.810 | 0.669 | 0.969 | 0.840 | 0.791 | ||
| PPE | [-] | 8.35 | 8.00 | 0.132 | 6.85 | 0.00298 | 0.406 | 1.50 | 0.755 | 0.770 | 0.640 | 0.951 | 0.893 | 0.779 | ||
| R15 | [-] | 7.68 | 7.37 | 0.121 | 6.85 | 0.00298 | 0.206 | 1.37 | 0.521 | 0.790 | 0.653 | 0.963 | 0.850 | 0.782 |
Download Data |
Period Mean (original grids) [Pg yr-1] |
Model Period Mean (intersection) [Pg yr-1] |
Model Period Mean (complement) [Pg yr-1] |
Benchmark Period Mean (intersection) [Pg yr-1] |
Benchmark Period Mean (complement) [Pg yr-1] |
Bias [g m-2 d-1] |
RMSE [g m-2 d-1] |
Phase Shift [months] |
Bias Score [1] |
RMSE Score [1] |
Seasonal Cycle Score [1] |
Spatial Distribution Score [1] |
Overall Score [1] |
|||
|---|---|---|---|---|---|---|---|---|---|---|---|---|---|---|---|---|
| Benchmark | [-] | 10.1 | ||||||||||||||
| D104 | [-] | 11.6 | 11.2 | 0.493 | 10.2 | 0.00385 | 0.289 | 1.32 | 1.06 | 0.721 | 0.547 | 0.924 | 0.956 | 0.739 | ||
| LMBIRCH4 | [-] | 11.5 | 11.2 | 0.502 | 10.1 | 0.00384 | 0.303 | 1.30 | 1.06 | 0.731 | 0.544 | 0.928 | 0.960 | 0.741 | ||
| PHSParam | [-] | 12.2 | 11.8 | 0.515 | 10.1 | 0.00384 | 0.398 | 1.32 | 1.05 | 0.741 | 0.543 | 0.926 | 0.962 | 0.743 | ||
| PPE | [-] | 12.2 | 11.8 | 0.530 | 10.1 | 0.00384 | 0.409 | 1.31 | 1.09 | 0.735 | 0.546 | 0.922 | 0.959 | 0.742 | ||
| R15 | [-] | 11.0 | 10.6 | 0.470 | 10.1 | 0.00384 | 0.212 | 1.26 | 1.06 | 0.715 | 0.552 | 0.929 | 0.954 | 0.740 |
Download Data |
Period Mean (original grids) [Pg yr-1] |
Model Period Mean (intersection) [Pg yr-1] |
Model Period Mean (complement) [Pg yr-1] |
Benchmark Period Mean (intersection) [Pg yr-1] |
Benchmark Period Mean (complement) [Pg yr-1] |
Bias [g m-2 d-1] |
RMSE [g m-2 d-1] |
Phase Shift [months] |
Bias Score [1] |
RMSE Score [1] |
Seasonal Cycle Score [1] |
Spatial Distribution Score [1] |
Overall Score [1] |
|||
|---|---|---|---|---|---|---|---|---|---|---|---|---|---|---|---|---|
| Benchmark | [-] | 8.37 | ||||||||||||||
| D104 | [-] | 7.59 | 6.52 | 0.695 | 8.44 | 0.00440 | -0.0875 | 2.14 | 2.90 | 0.482 | 0.357 | 0.550 | 0.950 | 0.539 | ||
| LMBIRCH4 | [-] | 7.56 | 6.44 | 0.707 | 8.36 | 0.00440 | -0.0855 | 2.13 | 2.98 | 0.480 | 0.355 | 0.546 | 0.949 | 0.537 | ||
| PHSParam | [-] | 7.17 | 6.12 | 0.664 | 8.36 | 0.00440 | -0.235 | 2.19 | 2.76 | 0.448 | 0.341 | 0.600 | 0.942 | 0.535 | ||
| PPE | [-] | 7.63 | 6.53 | 0.695 | 8.36 | 0.00440 | -0.0477 | 2.11 | 2.78 | 0.480 | 0.347 | 0.593 | 0.947 | 0.543 | ||
| R15 | [-] | 7.22 | 6.18 | 0.682 | 8.36 | 0.00440 | -0.210 | 2.09 | 2.87 | 0.464 | 0.361 | 0.548 | 0.948 | 0.536 |
Download Data |
Period Mean (original grids) [Pg yr-1] |
Model Period Mean (intersection) [Pg yr-1] |
Model Period Mean (complement) [Pg yr-1] |
Benchmark Period Mean (intersection) [Pg yr-1] |
Benchmark Period Mean (complement) [Pg yr-1] |
Bias [g m-2 d-1] |
RMSE [g m-2 d-1] |
Phase Shift [months] |
Bias Score [1] |
RMSE Score [1] |
Seasonal Cycle Score [1] |
Spatial Distribution Score [1] |
Overall Score [1] |
|||
|---|---|---|---|---|---|---|---|---|---|---|---|---|---|---|---|---|
| Benchmark | [-] | 1.28 | ||||||||||||||
| D104 | [-] | 1.84 | 1.91 | 0.0454 | 1.28 | 0.000152 | 0.543 | 1.66 | 0.177 | 0.689 | 0.452 | 0.993 | 0.850 | 0.687 | ||
| LMBIRCH4 | [-] | 1.62 | 1.67 | 0.0454 | 1.28 | 0.000152 | 0.355 | 1.53 | 0.334 | 0.703 | 0.446 | 0.983 | 0.772 | 0.670 | ||
| PHSParam | [-] | 1.48 | 1.55 | 0.0339 | 1.28 | 0.000152 | 0.242 | 1.34 | 0.288 | 0.735 | 0.503 | 0.987 | 0.867 | 0.719 | ||
| PPE | [-] | 1.83 | 1.90 | 0.0445 | 1.28 | 0.000152 | 0.540 | 1.70 | 0.330 | 0.681 | 0.400 | 0.983 | 0.802 | 0.653 | ||
| R15 | [-] | 2.06 | 2.13 | 0.0520 | 1.28 | 0.000152 | 0.727 | 1.95 | 0.181 | 0.652 | 0.400 | 0.993 | 0.861 | 0.661 |
Download Data |
Period Mean (original grids) [Pg yr-1] |
Model Period Mean (intersection) [Pg yr-1] |
Model Period Mean (complement) [Pg yr-1] |
Benchmark Period Mean (intersection) [Pg yr-1] |
Benchmark Period Mean (complement) [Pg yr-1] |
Bias [g m-2 d-1] |
RMSE [g m-2 d-1] |
Phase Shift [months] |
Bias Score [1] |
RMSE Score [1] |
Seasonal Cycle Score [1] |
Spatial Distribution Score [1] |
Overall Score [1] |
|||
|---|---|---|---|---|---|---|---|---|---|---|---|---|---|---|---|---|
| Benchmark | [-] | 3.53 | ||||||||||||||
| D104 | [-] | 5.06 | 4.30 | 0.638 | 3.52 | 0.0139 | 0.645 | 1.33 | 2.10 | 0.430 | 0.246 | 0.821 | 0.800 | 0.509 | ||
| LMBIRCH4 | [-] | 4.95 | 4.18 | 0.636 | 3.51 | 0.0139 | 0.607 | 1.32 | 2.08 | 0.431 | 0.249 | 0.821 | 0.792 | 0.508 | ||
| PHSParam | [-] | 4.82 | 4.06 | 0.624 | 3.51 | 0.0139 | 0.556 | 1.24 | 2.14 | 0.435 | 0.260 | 0.800 | 0.818 | 0.515 | ||
| PPE | [-] | 4.52 | 3.79 | 0.601 | 3.51 | 0.0139 | 0.442 | 1.23 | 2.14 | 0.438 | 0.269 | 0.777 | 0.827 | 0.516 | ||
| R15 | [-] | 4.92 | 4.17 | 0.621 | 3.51 | 0.0139 | 0.602 | 1.33 | 2.11 | 0.440 | 0.247 | 0.817 | 0.803 | 0.511 |
Download Data |
Period Mean (original grids) [Pg yr-1] |
Model Period Mean (intersection) [Pg yr-1] |
Model Period Mean (complement) [Pg yr-1] |
Benchmark Period Mean (intersection) [Pg yr-1] |
Benchmark Period Mean (complement) [Pg yr-1] |
Bias [g m-2 d-1] |
RMSE [g m-2 d-1] |
Phase Shift [months] |
Bias Score [1] |
RMSE Score [1] |
Seasonal Cycle Score [1] |
Spatial Distribution Score [1] |
Overall Score [1] |
|||
|---|---|---|---|---|---|---|---|---|---|---|---|---|---|---|---|---|
| Benchmark | [-] | 5.29 | ||||||||||||||
| D104 | [-] | 4.97 | 4.61 | 0.343 | 5.32 | 0.00341 | 0.155 | 1.71 | 0.334 | 0.730 | 0.582 | 0.980 | 0.756 | 0.726 | ||
| LMBIRCH4 | [-] | 4.78 | 4.43 | 0.333 | 5.28 | 0.00340 | 0.0714 | 1.71 | 0.386 | 0.735 | 0.577 | 0.977 | 0.857 | 0.744 | ||
| PHSParam | [-] | 5.15 | 4.79 | 0.351 | 5.28 | 0.00340 | 0.277 | 1.66 | 0.325 | 0.758 | 0.584 | 0.980 | 0.862 | 0.754 | ||
| PPE | [-] | 5.19 | 4.81 | 0.359 | 5.28 | 0.00340 | 0.298 | 1.73 | 0.375 | 0.741 | 0.580 | 0.978 | 0.897 | 0.755 | ||
| R15 | [-] | 5.02 | 4.65 | 0.346 | 5.28 | 0.00340 | 0.198 | 1.78 | 0.330 | 0.721 | 0.577 | 0.980 | 0.772 | 0.725 |
Download Data |
Period Mean (original grids) [Pg yr-1] |
Model Period Mean (intersection) [Pg yr-1] |
Model Period Mean (complement) [Pg yr-1] |
Benchmark Period Mean (intersection) [Pg yr-1] |
Benchmark Period Mean (complement) [Pg yr-1] |
Bias [g m-2 d-1] |
RMSE [g m-2 d-1] |
Phase Shift [months] |
Bias Score [1] |
RMSE Score [1] |
Seasonal Cycle Score [1] |
Spatial Distribution Score [1] |
Overall Score [1] |
|||
|---|---|---|---|---|---|---|---|---|---|---|---|---|---|---|---|---|
| Benchmark | [-] | 119. | ||||||||||||||
| D104 | [-] | 122. | 112. | 9.53 | 119. | 0.413 | 0.166 | 1.61 | 1.36 | 0.451 | 0.386 | 0.781 | 0.945 | 0.590 | ||
| LMBIRCH4 | [-] | 121. | 111. | 9.68 | 118. | 0.413 | 0.160 | 1.63 | 1.45 | 0.444 | 0.376 | 0.775 | 0.949 | 0.584 | ||
| PHSParam | [-] | 121. | 111. | 9.51 | 118. | 0.413 | 0.160 | 1.62 | 1.40 | 0.456 | 0.366 | 0.784 | 0.949 | 0.584 | ||
| PPE | [-] | 126. | 116. | 9.81 | 118. | 0.413 | 0.281 | 1.67 | 1.40 | 0.473 | 0.357 | 0.784 | 0.952 | 0.585 | ||
| R15 | [-] | 118. | 109. | 9.30 | 118. | 0.413 | 0.0966 | 1.65 | 1.37 | 0.430 | 0.387 | 0.782 | 0.934 | 0.584 |
Download Data |
Period Mean (original grids) [Pg yr-1] |
Model Period Mean (intersection) [Pg yr-1] |
Model Period Mean (complement) [Pg yr-1] |
Benchmark Period Mean (intersection) [Pg yr-1] |
Benchmark Period Mean (complement) [Pg yr-1] |
Bias [g m-2 d-1] |
RMSE [g m-2 d-1] |
Phase Shift [months] |
Bias Score [1] |
RMSE Score [1] |
Seasonal Cycle Score [1] |
Spatial Distribution Score [1] |
Overall Score [1] |
|||
|---|---|---|---|---|---|---|---|---|---|---|---|---|---|---|---|---|
| Benchmark | [-] | 0.864 | ||||||||||||||
| D104 | [-] | 1.90 | 1.61 | 0.182 | 0.877 | 0.000163 | 0.334 | 0.764 | 2.28 | 0.424 | 0.226 | 0.867 | 0.814 | 0.512 | ||
| LMBIRCH4 | [-] | 1.98 | 1.67 | 0.189 | 0.864 | 0.000161 | 0.361 | 0.801 | 2.33 | 0.416 | 0.213 | 0.862 | 0.797 | 0.500 | ||
| PHSParam | [-] | 2.01 | 1.70 | 0.186 | 0.864 | 0.000161 | 0.375 | 0.790 | 2.35 | 0.402 | 0.216 | 0.863 | 0.767 | 0.493 | ||
| PPE | [-] | 2.04 | 1.73 | 0.188 | 0.864 | 0.000161 | 0.388 | 0.794 | 2.34 | 0.391 | 0.217 | 0.865 | 0.749 | 0.488 | ||
| R15 | [-] | 1.76 | 1.48 | 0.166 | 0.864 | 0.000161 | 0.292 | 0.705 | 2.33 | 0.435 | 0.240 | 0.861 | 0.829 | 0.521 |
Download Data |
Period Mean (original grids) [Pg yr-1] |
Model Period Mean (intersection) [Pg yr-1] |
Model Period Mean (complement) [Pg yr-1] |
Benchmark Period Mean (intersection) [Pg yr-1] |
Benchmark Period Mean (complement) [Pg yr-1] |
Bias [g m-2 d-1] |
RMSE [g m-2 d-1] |
Phase Shift [months] |
Bias Score [1] |
RMSE Score [1] |
Seasonal Cycle Score [1] |
Spatial Distribution Score [1] |
Overall Score [1] |
|||
|---|---|---|---|---|---|---|---|---|---|---|---|---|---|---|---|---|
| Benchmark | [-] | 1.56 | ||||||||||||||
| D104 | [-] | 2.95 | 2.78 | 0.107 | 1.57 | 0.000582 | 0.601 | 1.47 | 0.588 | 0.473 | 0.319 | 0.976 | 0.536 | 0.525 | ||
| LMBIRCH4 | [-] | 2.74 | 2.55 | 0.117 | 1.56 | 0.000579 | 0.541 | 1.40 | 1.29 | 0.503 | 0.310 | 0.947 | 0.562 | 0.527 | ||
| PHSParam | [-] | 2.58 | 2.42 | 0.0939 | 1.56 | 0.000579 | 0.448 | 1.25 | 1.16 | 0.519 | 0.355 | 0.961 | 0.581 | 0.554 | ||
| PPE | [-] | 2.84 | 2.65 | 0.115 | 1.56 | 0.000579 | 0.583 | 1.45 | 0.934 | 0.475 | 0.296 | 0.962 | 0.540 | 0.514 | ||
| R15 | [-] | 3.09 | 2.90 | 0.119 | 1.56 | 0.000579 | 0.667 | 1.57 | 0.632 | 0.461 | 0.304 | 0.971 | 0.540 | 0.516 |
Download Data |
Period Mean (original grids) [Pg yr-1] |
Model Period Mean (intersection) [Pg yr-1] |
Model Period Mean (complement) [Pg yr-1] |
Benchmark Period Mean (intersection) [Pg yr-1] |
Benchmark Period Mean (complement) [Pg yr-1] |
Bias [g m-2 d-1] |
RMSE [g m-2 d-1] |
Phase Shift [months] |
Bias Score [1] |
RMSE Score [1] |
Seasonal Cycle Score [1] |
Spatial Distribution Score [1] |
Overall Score [1] |
|||
|---|---|---|---|---|---|---|---|---|---|---|---|---|---|---|---|---|
| Benchmark | [-] | 3.62 | ||||||||||||||
| D104 | [-] | 3.31 | 2.49 | 0.642 | 3.61 | 0.0206 | 0.174 | 1.95 | 1.71 | 0.370 | 0.340 | 0.775 | 0.941 | 0.553 | ||
| LMBIRCH4 | [-] | 3.37 | 2.56 | 0.641 | 3.60 | 0.0206 | 0.250 | 1.98 | 1.64 | 0.370 | 0.333 | 0.778 | 0.941 | 0.551 | ||
| PHSParam | [-] | 3.28 | 2.49 | 0.617 | 3.60 | 0.0206 | 0.148 | 1.96 | 1.74 | 0.364 | 0.314 | 0.764 | 0.943 | 0.540 | ||
| PPE | [-] | 3.44 | 2.60 | 0.655 | 3.60 | 0.0206 | 0.290 | 1.98 | 1.64 | 0.382 | 0.305 | 0.785 | 0.945 | 0.544 | ||
| R15 | [-] | 3.21 | 2.42 | 0.620 | 3.60 | 0.0206 | 0.0898 | 1.96 | 1.65 | 0.349 | 0.345 | 0.782 | 0.939 | 0.552 |
Download Data |
Period Mean (original grids) [Pg yr-1] |
Model Period Mean (intersection) [Pg yr-1] |
Model Period Mean (complement) [Pg yr-1] |
Benchmark Period Mean (intersection) [Pg yr-1] |
Benchmark Period Mean (complement) [Pg yr-1] |
Bias [g m-2 d-1] |
RMSE [g m-2 d-1] |
Phase Shift [months] |
Bias Score [1] |
RMSE Score [1] |
Seasonal Cycle Score [1] |
Spatial Distribution Score [1] |
Overall Score [1] |
|||
|---|---|---|---|---|---|---|---|---|---|---|---|---|---|---|---|---|
| Benchmark | [-] | 5.09 | ||||||||||||||
| D104 | [-] | 4.89 | 4.64 | 0.219 | 5.10 | 0.00139 | -0.0321 | 1.82 | 0.676 | 0.743 | 0.616 | 0.942 | 0.919 | 0.767 | ||
| LMBIRCH4 | [-] | 5.19 | 4.92 | 0.239 | 5.09 | 0.00139 | 0.185 | 1.75 | 0.676 | 0.779 | 0.615 | 0.942 | 0.949 | 0.780 | ||
| PHSParam | [-] | 5.37 | 5.09 | 0.248 | 5.09 | 0.00139 | 0.314 | 1.71 | 0.706 | 0.796 | 0.618 | 0.938 | 0.960 | 0.786 | ||
| PPE | [-] | 5.50 | 5.22 | 0.256 | 5.09 | 0.00139 | 0.404 | 1.65 | 0.716 | 0.796 | 0.631 | 0.937 | 0.973 | 0.794 | ||
| R15 | [-] | 4.63 | 4.40 | 0.211 | 5.09 | 0.00139 | -0.202 | 1.86 | 0.681 | 0.716 | 0.617 | 0.942 | 0.906 | 0.760 |
Download Data |
Period Mean (original grids) [Pg yr-1] |
Model Period Mean (intersection) [Pg yr-1] |
Model Period Mean (complement) [Pg yr-1] |
Benchmark Period Mean (intersection) [Pg yr-1] |
Benchmark Period Mean (complement) [Pg yr-1] |
Bias [g m-2 d-1] |
RMSE [g m-2 d-1] |
Phase Shift [months] |
Bias Score [1] |
RMSE Score [1] |
Seasonal Cycle Score [1] |
Spatial Distribution Score [1] |
Overall Score [1] |
|||
|---|---|---|---|---|---|---|---|---|---|---|---|---|---|---|---|---|
| Benchmark | [-] | 3.36 | ||||||||||||||
| D104 | [-] | 5.13 | 5.05 | 0.121 | 3.36 | 0.00768 | 1.07 | 1.86 | 0.487 | 0.600 | 0.531 | 0.967 | 0.940 | 0.714 | ||
| LMBIRCH4 | [-] | 5.09 | 5.00 | 0.129 | 3.35 | 0.00765 | 1.06 | 1.85 | 0.548 | 0.603 | 0.528 | 0.964 | 0.933 | 0.711 | ||
| PHSParam | [-] | 5.37 | 5.29 | 0.127 | 3.35 | 0.00765 | 1.20 | 1.95 | 0.472 | 0.564 | 0.516 | 0.967 | 0.939 | 0.700 | ||
| PPE | [-] | 5.67 | 5.56 | 0.138 | 3.35 | 0.00765 | 1.36 | 2.13 | 0.588 | 0.529 | 0.491 | 0.961 | 0.918 | 0.678 | ||
| R15 | [-] | 5.11 | 5.03 | 0.120 | 3.35 | 0.00765 | 1.06 | 1.87 | 0.511 | 0.596 | 0.527 | 0.966 | 0.939 | 0.711 |
Download Data |
Period Mean (original grids) [Pg yr-1] |
Model Period Mean (intersection) [Pg yr-1] |
Model Period Mean (complement) [Pg yr-1] |
Benchmark Period Mean (intersection) [Pg yr-1] |
Benchmark Period Mean (complement) [Pg yr-1] |
Bias [g m-2 d-1] |
RMSE [g m-2 d-1] |
Phase Shift [months] |
Bias Score [1] |
RMSE Score [1] |
Seasonal Cycle Score [1] |
Spatial Distribution Score [1] |
Overall Score [1] |
|||
|---|---|---|---|---|---|---|---|---|---|---|---|---|---|---|---|---|
| Benchmark | [-] | 1.79 | ||||||||||||||
| D104 | [-] | 1.91 | 1.85 | 0.0256 | 1.80 | 0.000356 | 0.115 | 1.27 | 0.932 | 0.533 | 0.403 | 0.916 | 0.910 | 0.633 | ||
| LMBIRCH4 | [-] | 1.97 | 1.91 | 0.0267 | 1.79 | 0.000356 | 0.179 | 1.31 | 0.943 | 0.527 | 0.401 | 0.917 | 0.911 | 0.632 | ||
| PHSParam | [-] | 2.26 | 2.19 | 0.0283 | 1.79 | 0.000356 | 0.378 | 1.31 | 0.991 | 0.541 | 0.406 | 0.911 | 0.906 | 0.634 | ||
| PPE | [-] | 2.37 | 2.30 | 0.0319 | 1.79 | 0.000356 | 0.461 | 1.30 | 0.983 | 0.562 | 0.401 | 0.909 | 0.909 | 0.636 | ||
| R15 | [-] | 1.86 | 1.79 | 0.0250 | 1.79 | 0.000356 | 0.0921 | 1.25 | 0.904 | 0.524 | 0.412 | 0.921 | 0.909 | 0.635 |
Download Data |
Period Mean (original grids) [Pg yr-1] |
Model Period Mean (intersection) [Pg yr-1] |
Model Period Mean (complement) [Pg yr-1] |
Benchmark Period Mean (intersection) [Pg yr-1] |
Benchmark Period Mean (complement) [Pg yr-1] |
Bias [g m-2 d-1] |
RMSE [g m-2 d-1] |
Phase Shift [months] |
Bias Score [1] |
RMSE Score [1] |
Seasonal Cycle Score [1] |
Spatial Distribution Score [1] |
Overall Score [1] |
|||
|---|---|---|---|---|---|---|---|---|---|---|---|---|---|---|---|---|
| Benchmark | [-] | 23.2 | ||||||||||||||
| D104 | [-] | 20.5 | 20.1 | 0.312 | 23.2 | 0.0155 | -0.677 | 1.88 | 2.55 | 0.143 | 0.224 | 0.599 | 0.905 | 0.419 | ||
| LMBIRCH4 | [-] | 20.7 | 20.3 | 0.316 | 23.2 | 0.0155 | -0.631 | 1.91 | 2.54 | 0.146 | 0.216 | 0.601 | 0.913 | 0.418 | ||
| PHSParam | [-] | 21.1 | 20.7 | 0.305 | 23.2 | 0.0155 | -0.505 | 1.84 | 2.42 | 0.197 | 0.174 | 0.618 | 0.972 | 0.427 | ||
| PPE | [-] | 22.4 | 22.0 | 0.318 | 23.2 | 0.0155 | -0.0545 | 1.75 | 2.41 | 0.307 | 0.162 | 0.621 | 0.972 | 0.445 | ||
| R15 | [-] | 19.4 | 19.0 | 0.304 | 23.2 | 0.0155 | -1.05 | 2.14 | 2.48 | 0.110 | 0.239 | 0.616 | 0.888 | 0.419 |
Download Data |
Period Mean (original grids) [Pg yr-1] |
Model Period Mean (intersection) [Pg yr-1] |
Model Period Mean (complement) [Pg yr-1] |
Benchmark Period Mean (intersection) [Pg yr-1] |
Benchmark Period Mean (complement) [Pg yr-1] |
Bias [g m-2 d-1] |
RMSE [g m-2 d-1] |
Phase Shift [months] |
Bias Score [1] |
RMSE Score [1] |
Seasonal Cycle Score [1] |
Spatial Distribution Score [1] |
Overall Score [1] |
|||
|---|---|---|---|---|---|---|---|---|---|---|---|---|---|---|---|---|
| Benchmark | [-] | 10.4 | ||||||||||||||
| D104 | [-] | 10.9 | 10.5 | 0.417 | 10.4 | 0.0104 | 0.246 | 2.05 | 1.12 | 0.530 | 0.460 | 0.893 | 0.847 | 0.638 | ||
| LMBIRCH4 | [-] | 11.1 | 10.7 | 0.427 | 10.4 | 0.0104 | 0.327 | 2.19 | 1.08 | 0.492 | 0.447 | 0.898 | 0.799 | 0.617 | ||
| PHSParam | [-] | 10.6 | 10.1 | 0.420 | 10.4 | 0.0104 | 0.0851 | 2.22 | 1.11 | 0.481 | 0.442 | 0.895 | 0.796 | 0.611 | ||
| PPE | [-] | 10.9 | 10.5 | 0.423 | 10.4 | 0.0104 | 0.241 | 2.36 | 1.06 | 0.452 | 0.434 | 0.901 | 0.742 | 0.593 | ||
| R15 | [-] | 10.8 | 10.4 | 0.410 | 10.4 | 0.0104 | 0.180 | 2.04 | 1.09 | 0.530 | 0.456 | 0.899 | 0.850 | 0.638 |
Download Data |
Period Mean (original grids) [Pg yr-1] |
Model Period Mean (intersection) [Pg yr-1] |
Model Period Mean (complement) [Pg yr-1] |
Benchmark Period Mean (intersection) [Pg yr-1] |
Benchmark Period Mean (complement) [Pg yr-1] |
Bias [g m-2 d-1] |
RMSE [g m-2 d-1] |
Phase Shift [months] |
Bias Score [1] |
RMSE Score [1] |
Seasonal Cycle Score [1] |
Spatial Distribution Score [1] |
Overall Score [1] |
|||
|---|---|---|---|---|---|---|---|---|---|---|---|---|---|---|---|---|
| Benchmark | [-] | 1.16 | ||||||||||||||
| D104 | [-] | 1.92 | 1.71 | 0.110 | 1.14 | 0.0186 | 0.807 | 1.50 | 1.52 | 0.395 | 0.358 | 0.886 | 0.865 | 0.572 | ||
| LMBIRCH4 | [-] | 2.02 | 1.80 | 0.115 | 1.14 | 0.0186 | 0.916 | 1.63 | 1.48 | 0.369 | 0.338 | 0.888 | 0.848 | 0.556 | ||
| PHSParam | [-] | 1.96 | 1.75 | 0.102 | 1.14 | 0.0186 | 0.846 | 1.59 | 1.48 | 0.387 | 0.335 | 0.888 | 0.860 | 0.561 | ||
| PPE | [-] | 2.10 | 1.87 | 0.113 | 1.14 | 0.0186 | 0.982 | 1.70 | 1.45 | 0.367 | 0.320 | 0.898 | 0.842 | 0.549 | ||
| R15 | [-] | 1.78 | 1.59 | 0.105 | 1.14 | 0.0186 | 0.673 | 1.37 | 1.49 | 0.401 | 0.384 | 0.886 | 0.883 | 0.588 |
Temporally integrated period mean