Mean State
Download Data |
Period Mean (original grids) [Pg] |
Model Period Mean (intersection) [Pg] |
Model Period Mean (complement) [Pg] |
Benchmark Period Mean (intersection) [Pg] |
Benchmark Period Mean (complement) [Pg] |
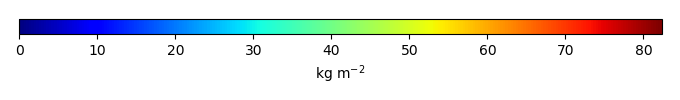
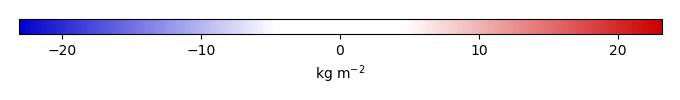
Bias [kg m-2] |
Bias Score [1] |
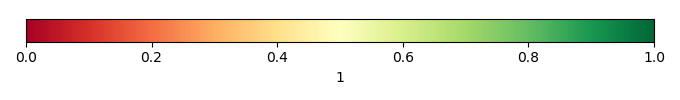
Spatial Distribution Score [1] |
Overall Score [1] |
|||
|---|---|---|---|---|---|---|---|---|---|---|---|---|
| Benchmark | [-] | 34.1 | ||||||||||
| D104 | [-] | 29.3 | 26.8 | 0.667 | 34.1 | 0.0278 | -1.01 | 0.713 | 0.911 | 0.812 | ||
| LMBIRCH4 | [-] | 39.0 | 33.9 | 0.838 | 34.1 | 0.0278 | 0.685 | 0.684 | 0.929 | 0.807 | ||
| PHSParam | [-] | 36.4 | 32.6 | 0.831 | 34.1 | 0.0278 | 0.389 | 0.669 | 0.928 | 0.798 | ||
| PPE | [-] | 42.8 | 37.8 | 0.887 | 34.1 | 0.0278 | 1.59 | 0.629 | 0.899 | 0.764 | ||
| R15 | [-] | 32.4 | 28.8 | 0.762 | 34.1 | 0.0278 | -0.488 | 0.726 | 0.932 | 0.829 |
Download Data |
Period Mean (original grids) [Pg] |
Model Period Mean (intersection) [Pg] |
Model Period Mean (complement) [Pg] |
Benchmark Period Mean (intersection) [Pg] |
Benchmark Period Mean (complement) [Pg] |
Bias [kg m-2] |
Bias Score [1] |
Spatial Distribution Score [1] |
Overall Score [1] |
|||
|---|---|---|---|---|---|---|---|---|---|---|---|---|
| Benchmark | [-] | 44.8 | ||||||||||
| D104 | [-] | 12.5 | 13.8 | 0.0923 | 44.8 | 0.0683 | -4.45 | 0.500 | 0.650 | 0.575 | ||
| LMBIRCH4 | [-] | 13.2 | 16.2 | 0.127 | 44.8 | 0.0683 | -4.05 | 0.494 | 0.833 | 0.663 | ||
| PHSParam | [-] | 11.2 | 13.8 | 0.105 | 44.8 | 0.0683 | -4.41 | 0.487 | 0.789 | 0.638 | ||
| PPE | [-] | 13.4 | 16.4 | 0.123 | 44.8 | 0.0683 | -4.01 | 0.488 | 0.787 | 0.637 | ||
| R15 | [-] | 12.1 | 14.3 | 0.110 | 44.8 | 0.0683 | -4.34 | 0.498 | 0.773 | 0.635 |
Download Data |
Period Mean (original grids) [Pg] |
Model Period Mean (intersection) [Pg] |
Model Period Mean (complement) [Pg] |
Benchmark Period Mean (intersection) [Pg] |
Benchmark Period Mean (complement) [Pg] |
Bias [kg m-2] |
Bias Score [1] |
Spatial Distribution Score [1] |
Overall Score [1] |
|||
|---|---|---|---|---|---|---|---|---|---|---|---|---|
| Benchmark | [-] | 60.1 | ||||||||||
| D104 | [-] | 29.3 | 27.3 | 1.36 | 59.8 | 0.261 | -2.88 | 0.549 | 0.843 | 0.696 | ||
| LMBIRCH4 | [-] | 34.4 | 32.9 | 1.63 | 59.8 | 0.261 | -2.14 | 0.541 | 0.746 | 0.644 | ||
| PHSParam | [-] | 30.8 | 28.5 | 1.56 | 59.8 | 0.261 | -2.65 | 0.533 | 0.774 | 0.654 | ||
| PPE | [-] | 35.6 | 34.0 | 1.59 | 59.8 | 0.261 | -2.05 | 0.525 | 0.681 | 0.603 | ||
| R15 | [-] | 30.9 | 29.1 | 1.41 | 59.8 | 0.261 | -2.63 | 0.559 | 0.831 | 0.695 |
Download Data |
Period Mean (original grids) [Pg] |
Model Period Mean (intersection) [Pg] |
Model Period Mean (complement) [Pg] |
Benchmark Period Mean (intersection) [Pg] |
Benchmark Period Mean (complement) [Pg] |
Bias [kg m-2] |
Bias Score [1] |
Spatial Distribution Score [1] |
Overall Score [1] |
|||
|---|---|---|---|---|---|---|---|---|---|---|---|---|
| Benchmark | [-] | 11.1 | ||||||||||
| D104 | [-] | 108. | 10.2 | 95.0 | 10.7 | 0.441 | 10.3 | 0.415 | 0.153 | 0.284 | ||
| LMBIRCH4 | [-] | 49.4 | 4.86 | 43.8 | 10.7 | 0.441 | -4.80 | 0.453 | 0.547 | 0.500 | ||
| PHSParam | [-] | 62.9 | 6.51 | 54.9 | 10.7 | 0.441 | -0.751 | 0.432 | 0.241 | 0.337 | ||
| PPE | [-] | 97.1 | 6.14 | 90.9 | 10.7 | 0.441 | -1.40 | 0.440 | 0.289 | 0.364 | ||
| R15 | [-] | 98.9 | 9.62 | 87.0 | 10.7 | 0.441 | 7.33 | 0.422 | 0.147 | 0.285 |
Download Data |
Period Mean (original grids) [Pg] |
Model Period Mean (intersection) [Pg] |
Model Period Mean (complement) [Pg] |
Benchmark Period Mean (intersection) [Pg] |
Benchmark Period Mean (complement) [Pg] |
Bias [kg m-2] |
Bias Score [1] |
Spatial Distribution Score [1] |
Overall Score [1] |
|||
|---|---|---|---|---|---|---|---|---|---|---|---|---|
| Benchmark | [-] | 55.7 | ||||||||||
| D104 | [-] | 20.7 | 17.4 | 2.31 | 54.0 | 1.77 | -5.76 | 0.659 | 0.221 | 0.440 | ||
| LMBIRCH4 | [-] | 23.4 | 19.6 | 2.61 | 54.0 | 1.77 | -4.56 | 0.679 | 0.329 | 0.504 | ||
| PHSParam | [-] | 24.1 | 20.4 | 2.65 | 54.0 | 1.77 | -4.30 | 0.688 | 0.267 | 0.477 | ||
| PPE | [-] | 26.8 | 22.7 | 2.90 | 54.0 | 1.77 | -3.22 | 0.697 | 0.302 | 0.500 | ||
| R15 | [-] | 20.9 | 17.6 | 2.36 | 54.0 | 1.77 | -5.57 | 0.659 | 0.266 | 0.462 |
Download Data |
Period Mean (original grids) [Pg] |
Model Period Mean (intersection) [Pg] |
Model Period Mean (complement) [Pg] |
Benchmark Period Mean (intersection) [Pg] |
Benchmark Period Mean (complement) [Pg] |
Bias [kg m-2] |
Bias Score [1] |
Spatial Distribution Score [1] |
Overall Score [1] |
|||
|---|---|---|---|---|---|---|---|---|---|---|---|---|
| Benchmark | [-] | 65.6 | ||||||||||
| D104 | [-] | 137. | 59.6 | 73.1 | 65.5 | 0.127 | -0.732 | 0.713 | 0.849 | 0.781 | ||
| LMBIRCH4 | [-] | 138. | 53.1 | 80.8 | 65.5 | 0.127 | -2.18 | 0.686 | 0.857 | 0.772 | ||
| PHSParam | [-] | 136. | 61.0 | 70.9 | 65.5 | 0.127 | -0.382 | 0.685 | 0.765 | 0.725 | ||
| PPE | [-] | 202. | 63.3 | 129. | 65.5 | 0.127 | 0.328 | 0.669 | 0.903 | 0.786 | ||
| R15 | [-] | 138. | 57.9 | 75.9 | 65.5 | 0.127 | -1.18 | 0.714 | 0.805 | 0.760 |
Download Data |
Period Mean (original grids) [Pg] |
Model Period Mean (intersection) [Pg] |
Model Period Mean (complement) [Pg] |
Benchmark Period Mean (intersection) [Pg] |
Benchmark Period Mean (complement) [Pg] |
Bias [kg m-2] |
Bias Score [1] |
Spatial Distribution Score [1] |
Overall Score [1] |
|||
|---|---|---|---|---|---|---|---|---|---|---|---|---|
| Benchmark | [-] | 143. | ||||||||||
| D104 | [-] | 95.0 | 90.0 | 6.72 | 143. | 0.544 | -2.60 | 0.622 | 0.903 | 0.762 | ||
| LMBIRCH4 | [-] | 101. | 96.2 | 7.45 | 143. | 0.544 | -2.19 | 0.626 | 0.884 | 0.755 | ||
| PHSParam | [-] | 114. | 109. | 7.30 | 143. | 0.544 | -1.45 | 0.653 | 0.884 | 0.768 | ||
| PPE | [-] | 117. | 110. | 10.7 | 143. | 0.544 | -1.36 | 0.622 | 0.762 | 0.692 | ||
| R15 | [-] | 95.4 | 90.7 | 6.57 | 143. | 0.544 | -2.56 | 0.628 | 0.910 | 0.769 |
Download Data |
Period Mean (original grids) [Pg] |
Model Period Mean (intersection) [Pg] |
Model Period Mean (complement) [Pg] |
Benchmark Period Mean (intersection) [Pg] |
Benchmark Period Mean (complement) [Pg] |
Bias [kg m-2] |
Bias Score [1] |
Spatial Distribution Score [1] |
Overall Score [1] |
|||
|---|---|---|---|---|---|---|---|---|---|---|---|---|
| Benchmark | [-] | 58.4 | ||||||||||
| D104 | [-] | 32.6 | 29.5 | 1.53 | 58.0 | 0.365 | -2.65 | 0.657 | 0.861 | 0.759 | ||
| LMBIRCH4 | [-] | 37.7 | 33.8 | 1.74 | 58.0 | 0.365 | -1.85 | 0.646 | 0.762 | 0.704 | ||
| PHSParam | [-] | 32.7 | 29.3 | 1.55 | 58.0 | 0.365 | -2.55 | 0.616 | 0.752 | 0.684 | ||
| PPE | [-] | 36.5 | 32.8 | 1.71 | 58.0 | 0.365 | -1.95 | 0.625 | 0.726 | 0.675 | ||
| R15 | [-] | 31.6 | 28.5 | 1.53 | 58.0 | 0.365 | -2.71 | 0.650 | 0.863 | 0.756 |
Download Data |
Period Mean (original grids) [Pg] |
Model Period Mean (intersection) [Pg] |
Model Period Mean (complement) [Pg] |
Benchmark Period Mean (intersection) [Pg] |
Benchmark Period Mean (complement) [Pg] |
Bias [kg m-2] |
Bias Score [1] |
Spatial Distribution Score [1] |
Overall Score [1] |
|||
|---|---|---|---|---|---|---|---|---|---|---|---|---|
| Benchmark | [-] | 7.78 | ||||||||||
| D104 | [-] | 118. | 10.6 | 111. | 7.68 | 0.0955 | 11.1 | 0.435 | 0.208 | 0.321 | ||
| LMBIRCH4 | [-] | 80.2 | 7.46 | 75.4 | 7.68 | 0.0955 | 2.82 | 0.475 | 0.541 | 0.508 | ||
| PHSParam | [-] | 77.4 | 7.45 | 72.8 | 7.68 | 0.0955 | 2.37 | 0.431 | 0.343 | 0.387 | ||
| PPE | [-] | 112. | 7.96 | 108. | 7.68 | 0.0955 | 4.16 | 0.473 | 0.429 | 0.451 | ||
| R15 | [-] | 111. | 10.2 | 104. | 7.68 | 0.0955 | 9.62 | 0.455 | 0.207 | 0.331 |
Download Data |
Period Mean (original grids) [Pg] |
Model Period Mean (intersection) [Pg] |
Model Period Mean (complement) [Pg] |
Benchmark Period Mean (intersection) [Pg] |
Benchmark Period Mean (complement) [Pg] |
Bias [kg m-2] |
Bias Score [1] |
Spatial Distribution Score [1] |
Overall Score [1] |
|||
|---|---|---|---|---|---|---|---|---|---|---|---|---|
| Benchmark | [-] | 58.9 | ||||||||||
| D104 | [-] | 28.9 | 25.9 | 2.22 | 57.9 | 0.945 | -2.52 | 0.538 | 0.441 | 0.489 | ||
| LMBIRCH4 | [-] | 31.4 | 27.7 | 2.61 | 57.9 | 0.945 | -2.09 | 0.518 | 0.356 | 0.437 | ||
| PHSParam | [-] | 30.0 | 26.6 | 2.45 | 57.9 | 0.945 | -2.30 | 0.527 | 0.410 | 0.468 | ||
| PPE | [-] | 31.8 | 28.3 | 2.49 | 57.9 | 0.945 | -2.05 | 0.524 | 0.366 | 0.445 | ||
| R15 | [-] | 28.0 | 24.8 | 2.27 | 57.9 | 0.945 | -2.60 | 0.536 | 0.460 | 0.498 |
Download Data |
Period Mean (original grids) [Pg] |
Model Period Mean (intersection) [Pg] |
Model Period Mean (complement) [Pg] |
Benchmark Period Mean (intersection) [Pg] |
Benchmark Period Mean (complement) [Pg] |
Bias [kg m-2] |
Bias Score [1] |
Spatial Distribution Score [1] |
Overall Score [1] |
|||
|---|---|---|---|---|---|---|---|---|---|---|---|---|
| Benchmark | [-] | 61.8 | ||||||||||
| D104 | [-] | 43.5 | 38.2 | 4.90 | 61.4 | 0.340 | -2.33 | 0.712 | 0.838 | 0.775 | ||
| LMBIRCH4 | [-] | 42.3 | 38.1 | 4.10 | 61.4 | 0.340 | -2.30 | 0.675 | 0.740 | 0.708 | ||
| PHSParam | [-] | 44.7 | 40.5 | 4.06 | 61.4 | 0.340 | -1.68 | 0.685 | 0.716 | 0.700 | ||
| PPE | [-] | 46.0 | 41.3 | 4.47 | 61.4 | 0.340 | -1.39 | 0.673 | 0.810 | 0.742 | ||
| R15 | [-] | 42.0 | 37.0 | 4.65 | 61.4 | 0.340 | -2.56 | 0.712 | 0.795 | 0.754 |
Download Data |
Period Mean (original grids) [Pg] |
Model Period Mean (intersection) [Pg] |
Model Period Mean (complement) [Pg] |
Benchmark Period Mean (intersection) [Pg] |
Benchmark Period Mean (complement) [Pg] |
Bias [kg m-2] |
Bias Score [1] |
Spatial Distribution Score [1] |
Overall Score [1] |
|||
|---|---|---|---|---|---|---|---|---|---|---|---|---|
| Benchmark | [-] | 1.09e+03 | ||||||||||
| D104 | [-] | 1.08e+03 | 604. | 473. | 1.05e+03 | 33.6 | -2.71 | 0.622 | 0.719 | 0.670 | ||
| LMBIRCH4 | [-] | 987. | 647. | 340. | 1.05e+03 | 33.6 | -2.26 | 0.621 | 0.864 | 0.743 | ||
| PHSParam | [-] | 1.00e+03 | 665. | 337. | 1.05e+03 | 33.6 | -2.13 | 0.625 | 0.817 | 0.721 | ||
| PPE | [-] | 1.21e+03 | 721. | 490. | 1.05e+03 | 33.6 | -1.57 | 0.616 | 0.805 | 0.711 | ||
| R15 | [-] | 1.05e+03 | 598. | 447. | 1.05e+03 | 33.6 | -2.74 | 0.622 | 0.735 | 0.678 |
Download Data |
Period Mean (original grids) [Pg] |
Model Period Mean (intersection) [Pg] |
Model Period Mean (complement) [Pg] |
Benchmark Period Mean (intersection) [Pg] |
Benchmark Period Mean (complement) [Pg] |
Bias [kg m-2] |
Bias Score [1] |
Spatial Distribution Score [1] |
Overall Score [1] |
|||
|---|---|---|---|---|---|---|---|---|---|---|---|---|
| Benchmark | [-] | 64.3 | ||||||||||
| D104 | [-] | 15.5 | 13.9 | 0.801 | 64.2 | 0.107 | -2.88 | 0.487 | 0.818 | 0.653 | ||
| LMBIRCH4 | [-] | 20.7 | 18.4 | 0.983 | 64.2 | 0.107 | -2.57 | 0.504 | 0.749 | 0.627 | ||
| PHSParam | [-] | 21.7 | 19.3 | 1.07 | 64.2 | 0.107 | -2.49 | 0.497 | 0.680 | 0.588 | ||
| PPE | [-] | 23.5 | 20.8 | 1.14 | 64.2 | 0.107 | -2.36 | 0.487 | 0.591 | 0.539 | ||
| R15 | [-] | 16.0 | 14.2 | 0.800 | 64.2 | 0.107 | -2.86 | 0.487 | 0.809 | 0.648 |
Download Data |
Period Mean (original grids) [Pg] |
Model Period Mean (intersection) [Pg] |
Model Period Mean (complement) [Pg] |
Benchmark Period Mean (intersection) [Pg] |
Benchmark Period Mean (complement) [Pg] |
Bias [kg m-2] |
Bias Score [1] |
Spatial Distribution Score [1] |
Overall Score [1] |
|||
|---|---|---|---|---|---|---|---|---|---|---|---|---|
| Benchmark | [-] | 13.3 | ||||||||||
| D104 | [-] | 124. | 8.31 | 114. | 12.9 | 0.453 | -0.650 | 0.465 | 0.450 | 0.457 | ||
| LMBIRCH4 | [-] | 68.0 | 4.29 | 62.7 | 12.9 | 0.453 | -4.18 | 0.488 | 0.731 | 0.609 | ||
| PHSParam | [-] | 66.6 | 4.30 | 61.4 | 12.9 | 0.453 | -5.00 | 0.479 | 0.732 | 0.606 | ||
| PPE | [-] | 76.6 | 4.24 | 71.2 | 12.9 | 0.453 | -4.18 | 0.484 | 0.731 | 0.608 | ||
| R15 | [-] | 112. | 7.46 | 103. | 12.9 | 0.453 | -1.46 | 0.471 | 0.536 | 0.504 |
Download Data |
Period Mean (original grids) [Pg] |
Model Period Mean (intersection) [Pg] |
Model Period Mean (complement) [Pg] |
Benchmark Period Mean (intersection) [Pg] |
Benchmark Period Mean (complement) [Pg] |
Bias [kg m-2] |
Bias Score [1] |
Spatial Distribution Score [1] |
Overall Score [1] |
|||
|---|---|---|---|---|---|---|---|---|---|---|---|---|
| Benchmark | [-] | 42.5 | ||||||||||
| D104 | [-] | 16.9 | 14.1 | 1.92 | 41.9 | 0.623 | -5.25 | 0.577 | 0.760 | 0.669 | ||
| LMBIRCH4 | [-] | 19.0 | 15.9 | 2.15 | 41.9 | 0.623 | -4.34 | 0.580 | 0.823 | 0.702 | ||
| PHSParam | [-] | 17.7 | 15.0 | 1.91 | 41.9 | 0.623 | -4.93 | 0.577 | 0.776 | 0.677 | ||
| PPE | [-] | 20.1 | 16.9 | 2.22 | 41.9 | 0.623 | -3.98 | 0.585 | 0.819 | 0.702 | ||
| R15 | [-] | 16.9 | 14.2 | 1.89 | 41.9 | 0.623 | -5.19 | 0.574 | 0.772 | 0.673 |
Download Data |
Period Mean (original grids) [Pg] |
Model Period Mean (intersection) [Pg] |
Model Period Mean (complement) [Pg] |
Benchmark Period Mean (intersection) [Pg] |
Benchmark Period Mean (complement) [Pg] |
Bias [kg m-2] |
Bias Score [1] |
Spatial Distribution Score [1] |
Overall Score [1] |
|||
|---|---|---|---|---|---|---|---|---|---|---|---|---|
| Benchmark | [-] | 45.3 | ||||||||||
| D104 | [-] | 31.8 | 31.0 | 0.718 | 45.1 | 0.204 | -2.79 | 0.726 | 0.756 | 0.741 | ||
| LMBIRCH4 | [-] | 35.9 | 34.9 | 0.829 | 45.1 | 0.204 | -1.70 | 0.757 | 0.741 | 0.749 | ||
| PHSParam | [-] | 36.3 | 35.3 | 0.864 | 45.1 | 0.204 | -1.57 | 0.771 | 0.738 | 0.755 | ||
| PPE | [-] | 38.3 | 37.3 | 0.907 | 45.1 | 0.204 | -1.08 | 0.770 | 0.737 | 0.753 | ||
| R15 | [-] | 29.8 | 29.0 | 0.664 | 45.1 | 0.204 | -3.28 | 0.709 | 0.755 | 0.732 |
Download Data |
Period Mean (original grids) [Pg] |
Model Period Mean (intersection) [Pg] |
Model Period Mean (complement) [Pg] |
Benchmark Period Mean (intersection) [Pg] |
Benchmark Period Mean (complement) [Pg] |
Bias [kg m-2] |
Bias Score [1] |
Spatial Distribution Score [1] |
Overall Score [1] |
|||
|---|---|---|---|---|---|---|---|---|---|---|---|---|
| Benchmark | [-] | 51.3 | ||||||||||
| D104 | [-] | 76.2 | 39.7 | 37.2 | 50.7 | 0.642 | -2.34 | 0.638 | 0.876 | 0.757 | ||
| LMBIRCH4 | [-] | 72.2 | 40.5 | 32.3 | 50.7 | 0.642 | -2.02 | 0.646 | 0.889 | 0.768 | ||
| PHSParam | [-] | 79.4 | 46.5 | 33.6 | 50.7 | 0.642 | -0.235 | 0.657 | 0.873 | 0.765 | ||
| PPE | [-] | 89.5 | 50.5 | 39.6 | 50.7 | 0.642 | 1.09 | 0.649 | 0.727 | 0.688 | ||
| R15 | [-] | 73.5 | 38.8 | 35.4 | 50.7 | 0.642 | -2.66 | 0.621 | 0.872 | 0.746 |
Download Data |
Period Mean (original grids) [Pg] |
Model Period Mean (intersection) [Pg] |
Model Period Mean (complement) [Pg] |
Benchmark Period Mean (intersection) [Pg] |
Benchmark Period Mean (complement) [Pg] |
Bias [kg m-2] |
Bias Score [1] |
Spatial Distribution Score [1] |
Overall Score [1] |
|||
|---|---|---|---|---|---|---|---|---|---|---|---|---|
| Benchmark | [-] | 34.3 | ||||||||||
| D104 | [-] | 13.2 | 12.4 | 0.434 | 34.2 | 0.0949 | -5.22 | 0.554 | 0.886 | 0.720 | ||
| LMBIRCH4 | [-] | 15.3 | 14.6 | 0.396 | 34.2 | 0.0949 | -4.52 | 0.567 | 0.857 | 0.712 | ||
| PHSParam | [-] | 18.9 | 17.8 | 0.605 | 34.2 | 0.0949 | -3.61 | 0.602 | 0.772 | 0.687 | ||
| PPE | [-] | 20.5 | 19.3 | 0.759 | 34.2 | 0.0949 | -3.14 | 0.589 | 0.656 | 0.622 | ||
| R15 | [-] | 13.2 | 12.4 | 0.469 | 34.2 | 0.0949 | -5.14 | 0.551 | 0.882 | 0.716 |
Download Data |
Period Mean (original grids) [Pg] |
Model Period Mean (intersection) [Pg] |
Model Period Mean (complement) [Pg] |
Benchmark Period Mean (intersection) [Pg] |
Benchmark Period Mean (complement) [Pg] |
Bias [kg m-2] |
Bias Score [1] |
Spatial Distribution Score [1] |
Overall Score [1] |
|||
|---|---|---|---|---|---|---|---|---|---|---|---|---|
| Benchmark | [-] | 101. | ||||||||||
| D104 | [-] | 67.7 | 67.0 | 0.803 | 100. | 0.729 | -3.30 | 0.696 | 0.434 | 0.565 | ||
| LMBIRCH4 | [-] | 76.1 | 75.0 | 0.863 | 100. | 0.729 | -2.32 | 0.713 | 0.517 | 0.615 | ||
| PHSParam | [-] | 76.1 | 75.3 | 0.778 | 100. | 0.729 | -2.34 | 0.724 | 0.555 | 0.639 | ||
| PPE | [-] | 86.9 | 85.9 | 0.876 | 100. | 0.729 | -1.03 | 0.733 | 0.560 | 0.647 | ||
| R15 | [-] | 68.1 | 67.1 | 0.782 | 100. | 0.729 | -3.30 | 0.693 | 0.431 | 0.562 |
Download Data |
Period Mean (original grids) [Pg] |
Model Period Mean (intersection) [Pg] |
Model Period Mean (complement) [Pg] |
Benchmark Period Mean (intersection) [Pg] |
Benchmark Period Mean (complement) [Pg] |
Bias [kg m-2] |
Bias Score [1] |
Spatial Distribution Score [1] |
Overall Score [1] |
|||
|---|---|---|---|---|---|---|---|---|---|---|---|---|
| Benchmark | [-] | 60.7 | ||||||||||
| D104 | [-] | 51.1 | 49.7 | 0.974 | 60.5 | 0.223 | -1.00 | 0.672 | 0.817 | 0.744 | ||
| LMBIRCH4 | [-] | 57.3 | 56.4 | 1.19 | 60.5 | 0.223 | 0.0681 | 0.652 | 0.882 | 0.767 | ||
| PHSParam | [-] | 55.6 | 54.2 | 1.17 | 60.5 | 0.223 | -0.249 | 0.659 | 0.884 | 0.771 | ||
| PPE | [-] | 62.1 | 61.1 | 1.25 | 60.5 | 0.223 | 0.818 | 0.626 | 0.904 | 0.765 | ||
| R15 | [-] | 49.0 | 47.9 | 1.03 | 60.5 | 0.223 | -1.27 | 0.682 | 0.800 | 0.741 |
Download Data |
Period Mean (original grids) [Pg] |
Model Period Mean (intersection) [Pg] |
Model Period Mean (complement) [Pg] |
Benchmark Period Mean (intersection) [Pg] |
Benchmark Period Mean (complement) [Pg] |
Bias [kg m-2] |
Bias Score [1] |
Spatial Distribution Score [1] |
Overall Score [1] |
|||
|---|---|---|---|---|---|---|---|---|---|---|---|---|
| Benchmark | [-] | 29.6 | ||||||||||
| D104 | [-] | 15.6 | 14.5 | 0.424 | 28.8 | 0.768 | -3.21 | 0.563 | 0.459 | 0.511 | ||
| LMBIRCH4 | [-] | 21.1 | 19.5 | 0.531 | 28.8 | 0.768 | -1.48 | 0.567 | 0.615 | 0.591 | ||
| PHSParam | [-] | 19.2 | 18.0 | 0.452 | 28.8 | 0.768 | -2.03 | 0.570 | 0.518 | 0.544 | ||
| PPE | [-] | 22.5 | 20.6 | 0.534 | 28.8 | 0.768 | -1.11 | 0.571 | 0.605 | 0.588 | ||
| R15 | [-] | 16.2 | 15.0 | 0.433 | 28.8 | 0.768 | -3.09 | 0.563 | 0.434 | 0.499 |
Temporally integrated period mean