Mean State
Download Data |
Period Mean (original grids) [Pg] |
Model Period Mean (intersection) [Pg] |
Model Period Mean (complement) [Pg] |
Benchmark Period Mean (intersection) [Pg] |
Benchmark Period Mean (complement) [Pg] |
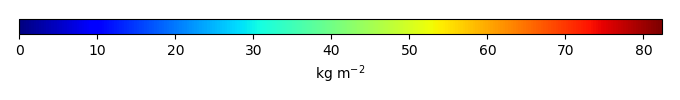
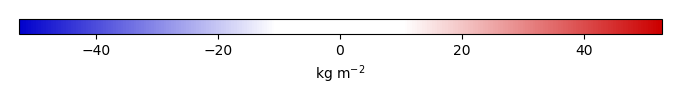
Bias [kg m-2] |
Bias Score [1] |
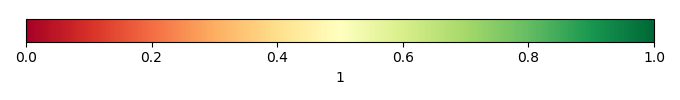
Spatial Distribution Score [1] |
Overall Score [1] |
|||
|---|---|---|---|---|---|---|---|---|---|---|---|---|
| Benchmark | [-] | 76.5 | ||||||||||
| D104 | [-] | 108. | 92.1 | 13.2 | 76.3 | 0.132 | 8.10 | 0.508 | 0.267 | 0.388 | ||
| LMBIRCH4 | [-] | 49.4 | 42.2 | 6.42 | 76.3 | 0.132 | -10.7 | 0.565 | 0.794 | 0.679 | ||
| PHSParam | [-] | 62.9 | 53.3 | 8.20 | 76.3 | 0.132 | -6.51 | 0.546 | 0.523 | 0.534 | ||
| PPE | [-] | 97.1 | 89.0 | 7.99 | 76.3 | 0.132 | 6.17 | 0.543 | 0.435 | 0.489 | ||
| R15 | [-] | 98.9 | 84.2 | 12.3 | 76.3 | 0.132 | 5.08 | 0.517 | 0.256 | 0.386 |
Download Data |
Period Mean (original grids) [Pg] |
Model Period Mean (intersection) [Pg] |
Model Period Mean (complement) [Pg] |
Benchmark Period Mean (intersection) [Pg] |
Benchmark Period Mean (complement) [Pg] |
Bias [kg m-2] |
Bias Score [1] |
Spatial Distribution Score [1] |
Overall Score [1] |
|||
|---|---|---|---|---|---|---|---|---|---|---|---|---|
| Benchmark | [-] | 113. | ||||||||||
| D104 | [-] | 137. | 71.9 | 60.7 | 113. | -8.41 | 0.564 | 0.839 | 0.701 | |||
| LMBIRCH4 | [-] | 138. | 79.7 | 54.3 | 113. | -6.73 | 0.529 | 0.757 | 0.643 | |||
| PHSParam | [-] | 136. | 69.8 | 62.1 | 113. | -8.81 | 0.551 | 0.830 | 0.690 | |||
| PPE | [-] | 202. | 128. | 64.6 | 113. | 3.21 | 0.527 | 0.672 | 0.599 | |||
| R15 | [-] | 138. | 74.8 | 59.0 | 113. | -7.80 | 0.563 | 0.841 | 0.702 |
Download Data |
Period Mean (original grids) [Pg] |
Model Period Mean (intersection) [Pg] |
Model Period Mean (complement) [Pg] |
Benchmark Period Mean (intersection) [Pg] |
Benchmark Period Mean (complement) [Pg] |
Bias [kg m-2] |
Bias Score [1] |
Spatial Distribution Score [1] |
Overall Score [1] |
|||
|---|---|---|---|---|---|---|---|---|---|---|---|---|
| Benchmark | [-] | 12.2 | ||||||||||
| D104 | [-] | 95.0 | 5.57 | 91.2 | 12.2 | -6.74 | 0.560 | 0.815 | 0.687 | |||
| LMBIRCH4 | [-] | 101. | 6.11 | 97.6 | 12.2 | -6.21 | 0.573 | 0.819 | 0.696 | |||
| PHSParam | [-] | 114. | 5.93 | 111. | 12.2 | -6.39 | 0.578 | 0.706 | 0.642 | |||
| PPE | [-] | 117. | 9.28 | 112. | 12.2 | -2.93 | 0.558 | 0.537 | 0.548 | |||
| R15 | [-] | 95.4 | 5.42 | 91.8 | 12.2 | -6.89 | 0.554 | 0.789 | 0.672 |
Download Data |
Period Mean (original grids) [Pg] |
Model Period Mean (intersection) [Pg] |
Model Period Mean (complement) [Pg] |
Benchmark Period Mean (intersection) [Pg] |
Benchmark Period Mean (complement) [Pg] |
Bias [kg m-2] |
Bias Score [1] |
Spatial Distribution Score [1] |
Overall Score [1] |
|||
|---|---|---|---|---|---|---|---|---|---|---|---|---|
| Benchmark | [-] | 97.3 | ||||||||||
| D104 | [-] | 118. | 110. | 12.2 | 97.2 | 0.0316 | 4.65 | 0.539 | 0.374 | 0.457 | ||
| LMBIRCH4 | [-] | 80.2 | 74.3 | 8.56 | 97.2 | 0.0316 | -6.89 | 0.637 | 0.816 | 0.726 | ||
| PHSParam | [-] | 77.4 | 71.7 | 8.53 | 97.2 | 0.0316 | -7.74 | 0.578 | 0.692 | 0.635 | ||
| PPE | [-] | 112. | 107. | 9.16 | 97.2 | 0.0316 | 3.62 | 0.635 | 0.732 | 0.684 | ||
| R15 | [-] | 111. | 103. | 11.7 | 97.2 | 0.0316 | 2.39 | 0.561 | 0.419 | 0.490 |
Download Data |
Period Mean (original grids) [Pg] |
Model Period Mean (intersection) [Pg] |
Model Period Mean (complement) [Pg] |
Benchmark Period Mean (intersection) [Pg] |
Benchmark Period Mean (complement) [Pg] |
Bias [kg m-2] |
Bias Score [1] |
Spatial Distribution Score [1] |
Overall Score [1] |
|||
|---|---|---|---|---|---|---|---|---|---|---|---|---|
| Benchmark | [-] | 5.12 | ||||||||||
| D104 | [-] | 43.5 | 3.32 | 39.8 | 5.12 | -6.47 | 0.636 | 0.646 | 0.641 | |||
| LMBIRCH4 | [-] | 42.3 | 2.45 | 39.7 | 5.12 | -9.80 | 0.571 | 0.607 | 0.589 | |||
| PHSParam | [-] | 44.7 | 2.25 | 42.3 | 5.12 | -10.5 | 0.554 | 0.463 | 0.508 | |||
| PPE | [-] | 46.0 | 2.50 | 43.3 | 5.12 | -9.61 | 0.576 | 0.614 | 0.595 | |||
| R15 | [-] | 42.0 | 3.08 | 38.6 | 5.12 | -7.42 | 0.617 | 0.629 | 0.623 |
Download Data |
Period Mean (original grids) [Pg] |
Model Period Mean (intersection) [Pg] |
Model Period Mean (complement) [Pg] |
Benchmark Period Mean (intersection) [Pg] |
Benchmark Period Mean (complement) [Pg] |
Bias [kg m-2] |
Bias Score [1] |
Spatial Distribution Score [1] |
Overall Score [1] |
|||
|---|---|---|---|---|---|---|---|---|---|---|---|---|
| Benchmark | [-] | 475. | ||||||||||
| D104 | [-] | 1.08e+03 | 436. | 640. | 475. | 0.691 | -0.964 | 0.527 | 0.618 | 0.572 | ||
| LMBIRCH4 | [-] | 987. | 299. | 688. | 475. | 0.691 | -7.24 | 0.556 | 0.831 | 0.693 | ||
| PHSParam | [-] | 1.00e+03 | 298. | 704. | 475. | 0.691 | -7.32 | 0.542 | 0.818 | 0.680 | ||
| PPE | [-] | 1.21e+03 | 446. | 765. | 475. | 0.691 | -0.714 | 0.555 | 0.786 | 0.671 | ||
| R15 | [-] | 1.05e+03 | 410. | 636. | 475. | 0.691 | -2.17 | 0.537 | 0.667 | 0.602 |
Download Data |
Period Mean (original grids) [Pg] |
Model Period Mean (intersection) [Pg] |
Model Period Mean (complement) [Pg] |
Benchmark Period Mean (intersection) [Pg] |
Benchmark Period Mean (complement) [Pg] |
Bias [kg m-2] |
Bias Score [1] |
Spatial Distribution Score [1] |
Overall Score [1] |
|||
|---|---|---|---|---|---|---|---|---|---|---|---|---|
| Benchmark | [-] | 116. | ||||||||||
| D104 | [-] | 124. | 115. | 7.61 | 116. | 0.0985 | 0.765 | 0.480 | 0.589 | 0.534 | ||
| LMBIRCH4 | [-] | 68.0 | 61.6 | 5.37 | 116. | 0.0985 | -8.21 | 0.515 | 0.734 | 0.625 | ||
| PHSParam | [-] | 66.6 | 61.2 | 4.48 | 116. | 0.0985 | -8.59 | 0.499 | 0.735 | 0.617 | ||
| PPE | [-] | 76.6 | 70.1 | 5.39 | 116. | 0.0985 | -6.81 | 0.518 | 0.766 | 0.642 | ||
| R15 | [-] | 112. | 103. | 7.72 | 116. | 0.0985 | -1.23 | 0.497 | 0.698 | 0.597 |
Download Data |
Period Mean (original grids) [Pg] |
Model Period Mean (intersection) [Pg] |
Model Period Mean (complement) [Pg] |
Benchmark Period Mean (intersection) [Pg] |
Benchmark Period Mean (complement) [Pg] |
Bias [kg m-2] |
Bias Score [1] |
Spatial Distribution Score [1] |
Overall Score [1] |
|||
|---|---|---|---|---|---|---|---|---|---|---|---|---|
| Benchmark | [-] | 0.0131 | ||||||||||
| D104 | [-] | 31.8 | 0.0185 | 31.7 | 0.0131 | 3.21 | 0.581 | 4.90e-23 | 0.291 | |||
| LMBIRCH4 | [-] | 35.9 | 0.0219 | 35.8 | 0.0131 | 4.86 | 0.440 | 4.55e-23 | 0.220 | |||
| PHSParam | [-] | 36.3 | 0.0210 | 36.2 | 0.0131 | 4.50 | 0.473 | 4.21e-24 | 0.236 | |||
| PPE | [-] | 38.3 | 0.0238 | 38.1 | 0.0131 | 5.88 | 0.377 | 2.76e-24 | 0.188 | |||
| R15 | [-] | 29.8 | 0.0176 | 29.7 | 0.0131 | 2.77 | 0.625 | 7.29e-23 | 0.313 |
Download Data |
Period Mean (original grids) [Pg] |
Model Period Mean (intersection) [Pg] |
Model Period Mean (complement) [Pg] |
Benchmark Period Mean (intersection) [Pg] |
Benchmark Period Mean (complement) [Pg] |
Bias [kg m-2] |
Bias Score [1] |
Spatial Distribution Score [1] |
Overall Score [1] |
|||
|---|---|---|---|---|---|---|---|---|---|---|---|---|
| Benchmark | [-] | 46.1 | ||||||||||
| D104 | [-] | 76.2 | 36.9 | 40.0 | 46.1 | -4.27 | 0.557 | 0.578 | 0.567 | |||
| LMBIRCH4 | [-] | 72.2 | 31.9 | 41.0 | 46.1 | -6.62 | 0.566 | 0.482 | 0.524 | |||
| PHSParam | [-] | 79.4 | 33.2 | 47.0 | 46.1 | -6.00 | 0.566 | 0.480 | 0.523 | |||
| PPE | [-] | 89.5 | 39.1 | 51.0 | 46.1 | -3.12 | 0.599 | 0.631 | 0.615 | |||
| R15 | [-] | 73.5 | 35.1 | 39.2 | 46.1 | -5.11 | 0.564 | 0.544 | 0.554 |
Download Data |
Period Mean (original grids) [Pg] |
Model Period Mean (intersection) [Pg] |
Model Period Mean (complement) [Pg] |
Benchmark Period Mean (intersection) [Pg] |
Benchmark Period Mean (complement) [Pg] |
Bias [kg m-2] |
Bias Score [1] |
Spatial Distribution Score [1] |
Overall Score [1] |
|||
|---|---|---|---|---|---|---|---|---|---|---|---|---|
| Benchmark | [-] | 0.232 | ||||||||||
| D104 | [-] | 13.2 | 0.291 | 12.6 | 0.232 | 0.968 | 0.579 | 0.846 | 0.713 | |||
| LMBIRCH4 | [-] | 15.3 | 0.203 | 14.8 | 0.232 | -0.552 | 0.619 | 0.403 | 0.511 | |||
| PHSParam | [-] | 18.9 | 0.381 | 18.0 | 0.232 | 2.60 | 0.541 | 0.853 | 0.697 | |||
| PPE | [-] | 20.5 | 0.504 | 19.6 | 0.232 | 4.88 | 0.481 | 0.684 | 0.583 | |||
| R15 | [-] | 13.2 | 0.304 | 12.6 | 0.232 | 0.983 | 0.531 | 0.752 | 0.642 |
Temporally integrated period mean