Mean State
Download Data |
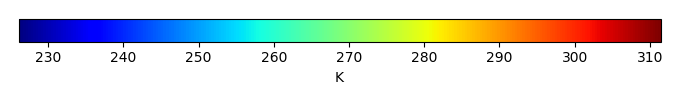
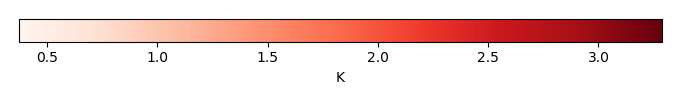
Period Mean (original grids) [K] |
Model Period Mean (intersection) [K] |
Model Period Mean (complement) [K] |
Benchmark Period Mean (intersection) [K] |
Benchmark Period Mean (complement) [K] |
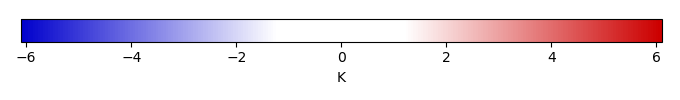
Bias [K] |
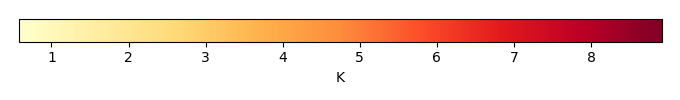
RMSE [K] |
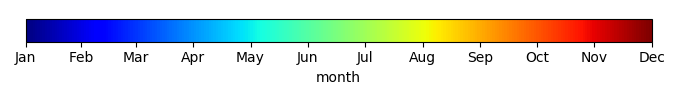
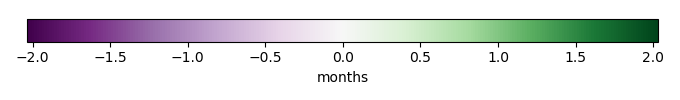
Phase Shift [months] |
Bias Score [1] |
RMSE Score [1] |
Seasonal Cycle Score [1] |
Spatial Distribution Score [1] |
Interannual Variability Score [1] |
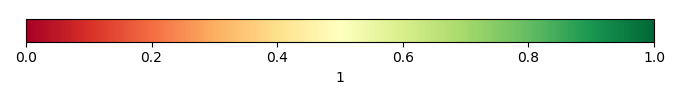
Overall Score [1] |
|||
|---|---|---|---|---|---|---|---|---|---|---|---|---|---|---|---|---|---|
| Benchmark | [-] | 304. | |||||||||||||||
| D104 | [-] | 306. | 306. | 304. | 304. | 305. | 1.61 | 2.10 | 0.376 | 0.294 | 0.642 | 0.956 | 0.996 | 0.820 | 0.725 | ||
| LMBIRCH4 | [-] | 305. | 306. | 304. | 304. | 305. | 1.70 | 2.21 | 0.396 | 0.290 | 0.631 | 0.951 | 0.997 | 0.801 | 0.717 | ||
| PHSParam | [-] | 305. | 306. | 304. | 304. | 305. | 1.70 | 2.21 | 0.436 | 0.291 | 0.629 | 0.943 | 0.997 | 0.802 | 0.715 | ||
| PPE | [-] | 305. | 305. | 304. | 304. | 305. | 1.66 | 2.17 | 0.438 | 0.298 | 0.629 | 0.943 | 0.996 | 0.802 | 0.716 | ||
| R15 | [-] | 305. | 306. | 304. | 304. | 305. | 1.70 | 2.21 | 0.396 | 0.290 | 0.631 | 0.951 | 0.997 | 0.801 | 0.717 |
Download Data |
Period Mean (original grids) [K] |
Model Period Mean (intersection) [K] |
Model Period Mean (complement) [K] |
Benchmark Period Mean (intersection) [K] |
Benchmark Period Mean (complement) [K] |
Bias [K] |
RMSE [K] |
Phase Shift [months] |
Bias Score [1] |
RMSE Score [1] |
Seasonal Cycle Score [1] |
Spatial Distribution Score [1] |
Interannual Variability Score [1] |
Overall Score [1] |
|||
|---|---|---|---|---|---|---|---|---|---|---|---|---|---|---|---|---|---|
| Benchmark | [-] | 307. | |||||||||||||||
| D104 | [-] | 309. | 309. | 305. | 307. | 306. | 2.04 | 2.42 | 0.232 | 0.471 | 0.763 | 0.981 | 0.999 | 0.909 | 0.814 | ||
| LMBIRCH4 | [-] | 309. | 309. | 304. | 307. | 306. | 1.97 | 2.38 | 0.235 | 0.483 | 0.742 | 0.981 | 0.998 | 0.878 | 0.804 | ||
| PHSParam | [-] | 309. | 309. | 304. | 307. | 306. | 1.98 | 2.38 | 0.238 | 0.482 | 0.743 | 0.981 | 0.998 | 0.877 | 0.804 | ||
| PPE | [-] | 309. | 309. | 304. | 307. | 306. | 1.98 | 2.38 | 0.238 | 0.482 | 0.744 | 0.981 | 0.999 | 0.877 | 0.805 | ||
| R15 | [-] | 309. | 309. | 304. | 307. | 306. | 1.95 | 2.36 | 0.235 | 0.487 | 0.742 | 0.981 | 0.999 | 0.878 | 0.805 |
Download Data |
Period Mean (original grids) [K] |
Model Period Mean (intersection) [K] |
Model Period Mean (complement) [K] |
Benchmark Period Mean (intersection) [K] |
Benchmark Period Mean (complement) [K] |
Bias [K] |
RMSE [K] |
Phase Shift [months] |
Bias Score [1] |
RMSE Score [1] |
Seasonal Cycle Score [1] |
Spatial Distribution Score [1] |
Interannual Variability Score [1] |
Overall Score [1] |
|||
|---|---|---|---|---|---|---|---|---|---|---|---|---|---|---|---|---|---|
| Benchmark | [-] | 301. | |||||||||||||||
| D104 | [-] | 304. | 304. | 301. | 302. | 299. | 1.58 | 2.14 | 0.435 | 0.441 | 0.709 | 0.949 | 0.997 | 0.857 | 0.777 | ||
| LMBIRCH4 | [-] | 303. | 303. | 301. | 301. | 299. | 1.72 | 2.25 | 0.426 | 0.430 | 0.714 | 0.946 | 0.996 | 0.824 | 0.771 | ||
| PHSParam | [-] | 303. | 303. | 301. | 301. | 299. | 1.75 | 2.27 | 0.438 | 0.427 | 0.713 | 0.944 | 0.995 | 0.824 | 0.769 | ||
| PPE | [-] | 303. | 303. | 301. | 301. | 299. | 1.73 | 2.25 | 0.438 | 0.428 | 0.714 | 0.945 | 0.995 | 0.824 | 0.770 | ||
| R15 | [-] | 303. | 303. | 301. | 301. | 299. | 1.72 | 2.24 | 0.423 | 0.430 | 0.714 | 0.946 | 0.996 | 0.823 | 0.770 |
Download Data |
Period Mean (original grids) [K] |
Model Period Mean (intersection) [K] |
Model Period Mean (complement) [K] |
Benchmark Period Mean (intersection) [K] |
Benchmark Period Mean (complement) [K] |
Bias [K] |
RMSE [K] |
Phase Shift [months] |
Bias Score [1] |
RMSE Score [1] |
Seasonal Cycle Score [1] |
Spatial Distribution Score [1] |
Interannual Variability Score [1] |
Overall Score [1] |
|||
|---|---|---|---|---|---|---|---|---|---|---|---|---|---|---|---|---|---|
| Benchmark | [-] | 266. | |||||||||||||||
| D104 | [-] | 267. | 267. | 270. | 267. | 270. | 0.702 | 2.00 | 0.0413 | 0.927 | 0.911 | 0.997 | 1.00 | 0.927 | 0.945 | ||
| LMBIRCH4 | [-] | 266. | 266. | 269. | 266. | 270. | 0.736 | 2.18 | 0.0578 | 0.926 | 0.899 | 0.996 | 1.00 | 0.896 | 0.936 | ||
| PHSParam | [-] | 266. | 266. | 269. | 266. | 270. | 0.736 | 2.18 | 0.0589 | 0.927 | 0.899 | 0.996 | 1.00 | 0.897 | 0.936 | ||
| PPE | [-] | 266. | 266. | 269. | 266. | 270. | 0.715 | 2.17 | 0.0589 | 0.927 | 0.899 | 0.996 | 1.00 | 0.897 | 0.936 | ||
| R15 | [-] | 266. | 266. | 269. | 266. | 270. | 0.748 | 2.18 | 0.0589 | 0.926 | 0.899 | 0.996 | 1.00 | 0.897 | 0.936 |
Download Data |
Period Mean (original grids) [K] |
Model Period Mean (intersection) [K] |
Model Period Mean (complement) [K] |
Benchmark Period Mean (intersection) [K] |
Benchmark Period Mean (complement) [K] |
Bias [K] |
RMSE [K] |
Phase Shift [months] |
Bias Score [1] |
RMSE Score [1] |
Seasonal Cycle Score [1] |
Spatial Distribution Score [1] |
Interannual Variability Score [1] |
Overall Score [1] |
|||
|---|---|---|---|---|---|---|---|---|---|---|---|---|---|---|---|---|---|
| Benchmark | [-] | 304. | |||||||||||||||
| D104 | [-] | 305. | 305. | 305. | 304. | 304. | 0.967 | 1.73 | 0.973 | 0.172 | 0.495 | 0.854 | 0.864 | 0.828 | 0.618 | ||
| LMBIRCH4 | [-] | 305. | 305. | 304. | 304. | 303. | 1.01 | 1.84 | 1.09 | 0.187 | 0.497 | 0.835 | 0.823 | 0.795 | 0.606 | ||
| PHSParam | [-] | 305. | 305. | 304. | 304. | 303. | 0.976 | 1.81 | 1.07 | 0.191 | 0.495 | 0.839 | 0.824 | 0.797 | 0.607 | ||
| PPE | [-] | 305. | 305. | 304. | 304. | 303. | 0.898 | 1.76 | 1.07 | 0.201 | 0.494 | 0.839 | 0.827 | 0.798 | 0.609 | ||
| R15 | [-] | 305. | 305. | 304. | 304. | 303. | 1.03 | 1.84 | 1.08 | 0.185 | 0.498 | 0.837 | 0.822 | 0.794 | 0.606 |
Download Data |
Period Mean (original grids) [K] |
Model Period Mean (intersection) [K] |
Model Period Mean (complement) [K] |
Benchmark Period Mean (intersection) [K] |
Benchmark Period Mean (complement) [K] |
Bias [K] |
RMSE [K] |
Phase Shift [months] |
Bias Score [1] |
RMSE Score [1] |
Seasonal Cycle Score [1] |
Spatial Distribution Score [1] |
Interannual Variability Score [1] |
Overall Score [1] |
|||
|---|---|---|---|---|---|---|---|---|---|---|---|---|---|---|---|---|---|
| Benchmark | [-] | 276. | |||||||||||||||
| D104 | [-] | 277. | 277. | 279. | 277. | 278. | 0.264 | 1.21 | 0.00937 | 0.950 | 0.942 | 0.999 | 1.00 | 0.963 | 0.966 | ||
| LMBIRCH4 | [-] | 276. | 276. | 278. | 276. | 277. | 0.282 | 1.24 | 0.00998 | 0.952 | 0.940 | 0.999 | 1.00 | 0.970 | 0.967 | ||
| PHSParam | [-] | 276. | 276. | 278. | 276. | 277. | 0.282 | 1.24 | 0.00998 | 0.952 | 0.941 | 0.999 | 1.00 | 0.970 | 0.967 | ||
| PPE | [-] | 276. | 276. | 278. | 276. | 277. | 0.262 | 1.22 | 0.00998 | 0.953 | 0.942 | 0.999 | 1.00 | 0.970 | 0.968 | ||
| R15 | [-] | 276. | 276. | 278. | 276. | 277. | 0.278 | 1.23 | 0.00998 | 0.952 | 0.941 | 0.999 | 1.00 | 0.970 | 0.967 |
Download Data |
Period Mean (original grids) [K] |
Model Period Mean (intersection) [K] |
Model Period Mean (complement) [K] |
Benchmark Period Mean (intersection) [K] |
Benchmark Period Mean (complement) [K] |
Bias [K] |
RMSE [K] |
Phase Shift [months] |
Bias Score [1] |
RMSE Score [1] |
Seasonal Cycle Score [1] |
Spatial Distribution Score [1] |
Interannual Variability Score [1] |
Overall Score [1] |
|||
|---|---|---|---|---|---|---|---|---|---|---|---|---|---|---|---|---|---|
| Benchmark | [-] | 286. | |||||||||||||||
| D104 | [-] | 287. | 287. | 291. | 286. | 292. | 1.03 | 2.02 | 0.0798 | 0.846 | 0.916 | 0.993 | 1.00 | 0.930 | 0.934 | ||
| LMBIRCH4 | [-] | 287. | 287. | 290. | 286. | 291. | 0.994 | 2.01 | 0.0830 | 0.851 | 0.916 | 0.993 | 1.00 | 0.938 | 0.936 | ||
| PHSParam | [-] | 287. | 287. | 290. | 286. | 291. | 0.999 | 2.01 | 0.0821 | 0.851 | 0.916 | 0.994 | 1.00 | 0.937 | 0.936 | ||
| PPE | [-] | 287. | 287. | 290. | 286. | 291. | 0.982 | 2.00 | 0.0828 | 0.852 | 0.917 | 0.993 | 1.00 | 0.938 | 0.936 | ||
| R15 | [-] | 287. | 287. | 290. | 286. | 291. | 1.00 | 2.01 | 0.0808 | 0.850 | 0.916 | 0.994 | 1.00 | 0.938 | 0.936 |
Download Data |
Period Mean (original grids) [K] |
Model Period Mean (intersection) [K] |
Model Period Mean (complement) [K] |
Benchmark Period Mean (intersection) [K] |
Benchmark Period Mean (complement) [K] |
Bias [K] |
RMSE [K] |
Phase Shift [months] |
Bias Score [1] |
RMSE Score [1] |
Seasonal Cycle Score [1] |
Spatial Distribution Score [1] |
Interannual Variability Score [1] |
Overall Score [1] |
|||
|---|---|---|---|---|---|---|---|---|---|---|---|---|---|---|---|---|---|
| Benchmark | [-] | 302. | |||||||||||||||
| D104 | [-] | 304. | 304. | 305. | 303. | 303. | 1.12 | 2.25 | 0.301 | 0.575 | 0.773 | 0.968 | 0.998 | 0.899 | 0.831 | ||
| LMBIRCH4 | [-] | 303. | 303. | 304. | 302. | 303. | 1.09 | 2.25 | 0.247 | 0.579 | 0.782 | 0.974 | 0.997 | 0.913 | 0.838 | ||
| PHSParam | [-] | 303. | 304. | 304. | 302. | 303. | 1.11 | 2.26 | 0.247 | 0.578 | 0.782 | 0.974 | 0.998 | 0.912 | 0.838 | ||
| PPE | [-] | 303. | 303. | 304. | 302. | 303. | 1.08 | 2.25 | 0.247 | 0.580 | 0.782 | 0.974 | 0.997 | 0.913 | 0.838 | ||
| R15 | [-] | 303. | 303. | 304. | 302. | 303. | 1.09 | 2.25 | 0.247 | 0.580 | 0.783 | 0.974 | 0.998 | 0.914 | 0.839 |
Download Data |
Period Mean (original grids) [K] |
Model Period Mean (intersection) [K] |
Model Period Mean (complement) [K] |
Benchmark Period Mean (intersection) [K] |
Benchmark Period Mean (complement) [K] |
Bias [K] |
RMSE [K] |
Phase Shift [months] |
Bias Score [1] |
RMSE Score [1] |
Seasonal Cycle Score [1] |
Spatial Distribution Score [1] |
Interannual Variability Score [1] |
Overall Score [1] |
|||
|---|---|---|---|---|---|---|---|---|---|---|---|---|---|---|---|---|---|
| Benchmark | [-] | 268. | |||||||||||||||
| D104 | [-] | 268. | 268. | 269. | 268. | 269. | -0.0839 | 1.38 | 0.0226 | 0.956 | 0.926 | 0.998 | 1.00 | 0.952 | 0.960 | ||
| LMBIRCH4 | [-] | 267. | 267. | 268. | 268. | 268. | -0.149 | 1.63 | 0.0296 | 0.954 | 0.912 | 0.998 | 1.00 | 0.906 | 0.947 | ||
| PHSParam | [-] | 267. | 267. | 268. | 268. | 268. | -0.146 | 1.63 | 0.0296 | 0.955 | 0.912 | 0.998 | 1.00 | 0.906 | 0.947 | ||
| PPE | [-] | 267. | 267. | 268. | 268. | 268. | -0.167 | 1.63 | 0.0296 | 0.954 | 0.913 | 0.998 | 1.00 | 0.906 | 0.947 | ||
| R15 | [-] | 267. | 267. | 268. | 268. | 268. | -0.139 | 1.62 | 0.0296 | 0.955 | 0.913 | 0.998 | 1.00 | 0.906 | 0.947 |
Download Data |
Period Mean (original grids) [K] |
Model Period Mean (intersection) [K] |
Model Period Mean (complement) [K] |
Benchmark Period Mean (intersection) [K] |
Benchmark Period Mean (complement) [K] |
Bias [K] |
RMSE [K] |
Phase Shift [months] |
Bias Score [1] |
RMSE Score [1] |
Seasonal Cycle Score [1] |
Spatial Distribution Score [1] |
Interannual Variability Score [1] |
Overall Score [1] |
|||
|---|---|---|---|---|---|---|---|---|---|---|---|---|---|---|---|---|---|
| Benchmark | [-] | 301. | |||||||||||||||
| D104 | [-] | 304. | 304. | 298. | 301. | 300. | 1.66 | 2.07 | 0.150 | 0.663 | 0.860 | 0.987 | 0.999 | 0.868 | 0.873 | ||
| LMBIRCH4 | [-] | 303. | 304. | 298. | 301. | 299. | 1.72 | 2.13 | 0.141 | 0.660 | 0.861 | 0.989 | 0.998 | 0.898 | 0.878 | ||
| PHSParam | [-] | 303. | 304. | 298. | 301. | 299. | 1.73 | 2.14 | 0.142 | 0.660 | 0.861 | 0.989 | 0.998 | 0.899 | 0.878 | ||
| PPE | [-] | 303. | 304. | 298. | 301. | 299. | 1.73 | 2.14 | 0.141 | 0.659 | 0.862 | 0.989 | 0.998 | 0.899 | 0.878 | ||
| R15 | [-] | 303. | 304. | 298. | 301. | 299. | 1.71 | 2.12 | 0.145 | 0.662 | 0.861 | 0.989 | 0.998 | 0.899 | 0.878 |
Download Data |
Period Mean (original grids) [K] |
Model Period Mean (intersection) [K] |
Model Period Mean (complement) [K] |
Benchmark Period Mean (intersection) [K] |
Benchmark Period Mean (complement) [K] |
Bias [K] |
RMSE [K] |
Phase Shift [months] |
Bias Score [1] |
RMSE Score [1] |
Seasonal Cycle Score [1] |
Spatial Distribution Score [1] |
Interannual Variability Score [1] |
Overall Score [1] |
|||
|---|---|---|---|---|---|---|---|---|---|---|---|---|---|---|---|---|---|
| Benchmark | [-] | 286. | |||||||||||||||
| D104 | [-] | 287. | 287. | 288. | 287. | 286. | 0.348 | 1.57 | 0.338 | 0.862 | 0.889 | 0.977 | 0.998 | 0.927 | 0.924 | ||
| LMBIRCH4 | [-] | 286. | 286. | 287. | 286. | 285. | 0.358 | 1.59 | 0.214 | 0.863 | 0.886 | 0.986 | 0.998 | 0.925 | 0.924 | ||
| PHSParam | [-] | 286. | 286. | 287. | 286. | 285. | 0.360 | 1.59 | 0.215 | 0.863 | 0.886 | 0.986 | 0.998 | 0.925 | 0.924 | ||
| PPE | [-] | 286. | 286. | 287. | 286. | 285. | 0.342 | 1.58 | 0.228 | 0.863 | 0.887 | 0.985 | 0.998 | 0.926 | 0.924 | ||
| R15 | [-] | 286. | 286. | 287. | 286. | 285. | 0.360 | 1.58 | 0.209 | 0.863 | 0.886 | 0.986 | 0.998 | 0.925 | 0.924 |
Download Data |
Period Mean (original grids) [K] |
Model Period Mean (intersection) [K] |
Model Period Mean (complement) [K] |
Benchmark Period Mean (intersection) [K] |
Benchmark Period Mean (complement) [K] |
Bias [K] |
RMSE [K] |
Phase Shift [months] |
Bias Score [1] |
RMSE Score [1] |
Seasonal Cycle Score [1] |
Spatial Distribution Score [1] |
Interannual Variability Score [1] |
Overall Score [1] |
|||
|---|---|---|---|---|---|---|---|---|---|---|---|---|---|---|---|---|---|
| Benchmark | [-] | 292. | |||||||||||||||
| D104 | [-] | 289. | 294. | 260. | 293. | 297. | 1.09 | 2.03 | 0.231 | 0.674 | 0.826 | 0.975 | 0.997 | 0.906 | 0.867 | ||
| LMBIRCH4 | [-] | 289. | 293. | 259. | 292. | 296. | 1.10 | 2.06 | 0.215 | 0.677 | 0.822 | 0.976 | 0.997 | 0.904 | 0.866 | ||
| PHSParam | [-] | 289. | 293. | 259. | 292. | 296. | 1.10 | 2.06 | 0.215 | 0.676 | 0.822 | 0.976 | 0.997 | 0.904 | 0.866 | ||
| PPE | [-] | 289. | 293. | 259. | 292. | 296. | 1.08 | 2.05 | 0.216 | 0.678 | 0.822 | 0.976 | 0.997 | 0.904 | 0.867 | ||
| R15 | [-] | 289. | 293. | 259. | 292. | 296. | 1.10 | 2.05 | 0.214 | 0.677 | 0.822 | 0.976 | 0.997 | 0.904 | 0.866 |
Download Data |
Period Mean (original grids) [K] |
Model Period Mean (intersection) [K] |
Model Period Mean (complement) [K] |
Benchmark Period Mean (intersection) [K] |
Benchmark Period Mean (complement) [K] |
Bias [K] |
RMSE [K] |
Phase Shift [months] |
Bias Score [1] |
RMSE Score [1] |
Seasonal Cycle Score [1] |
Spatial Distribution Score [1] |
Interannual Variability Score [1] |
Overall Score [1] |
|||
|---|---|---|---|---|---|---|---|---|---|---|---|---|---|---|---|---|---|
| Benchmark | [-] | 303. | |||||||||||||||
| D104 | [-] | 305. | 305. | 300. | 303. | 300. | 1.65 | 2.35 | 0.189 | 0.723 | 0.879 | 0.984 | 0.998 | 0.915 | 0.896 | ||
| LMBIRCH4 | [-] | 304. | 304. | 299. | 303. | 299. | 1.61 | 2.31 | 0.162 | 0.724 | 0.877 | 0.987 | 0.998 | 0.907 | 0.895 | ||
| PHSParam | [-] | 304. | 304. | 299. | 303. | 299. | 1.61 | 2.31 | 0.161 | 0.724 | 0.877 | 0.987 | 0.998 | 0.907 | 0.895 | ||
| PPE | [-] | 304. | 304. | 299. | 303. | 299. | 1.61 | 2.31 | 0.161 | 0.724 | 0.877 | 0.987 | 0.998 | 0.907 | 0.895 | ||
| R15 | [-] | 304. | 304. | 299. | 303. | 299. | 1.60 | 2.30 | 0.158 | 0.725 | 0.877 | 0.987 | 0.998 | 0.907 | 0.895 |
Download Data |
Period Mean (original grids) [K] |
Model Period Mean (intersection) [K] |
Model Period Mean (complement) [K] |
Benchmark Period Mean (intersection) [K] |
Benchmark Period Mean (complement) [K] |
Bias [K] |
RMSE [K] |
Phase Shift [months] |
Bias Score [1] |
RMSE Score [1] |
Seasonal Cycle Score [1] |
Spatial Distribution Score [1] |
Interannual Variability Score [1] |
Overall Score [1] |
|||
|---|---|---|---|---|---|---|---|---|---|---|---|---|---|---|---|---|---|
| Benchmark | [-] | 268. | |||||||||||||||
| D104 | [-] | 270. | 270. | 268. | 269. | 272. | 0.419 | 1.87 | 0.0462 | 0.920 | 0.895 | 0.997 | 1.00 | 0.931 | 0.940 | ||
| LMBIRCH4 | [-] | 269. | 269. | 268. | 268. | 271. | 0.459 | 1.95 | 0.0392 | 0.921 | 0.890 | 0.997 | 1.00 | 0.904 | 0.934 | ||
| PHSParam | [-] | 269. | 269. | 268. | 268. | 271. | 0.456 | 1.95 | 0.0392 | 0.922 | 0.890 | 0.997 | 1.00 | 0.904 | 0.934 | ||
| PPE | [-] | 269. | 269. | 268. | 268. | 271. | 0.456 | 1.94 | 0.0392 | 0.922 | 0.890 | 0.997 | 1.00 | 0.904 | 0.934 | ||
| R15 | [-] | 269. | 269. | 268. | 268. | 271. | 0.494 | 1.95 | 0.0392 | 0.921 | 0.890 | 0.997 | 1.00 | 0.904 | 0.934 |
Download Data |
Period Mean (original grids) [K] |
Model Period Mean (intersection) [K] |
Model Period Mean (complement) [K] |
Benchmark Period Mean (intersection) [K] |
Benchmark Period Mean (complement) [K] |
Bias [K] |
RMSE [K] |
Phase Shift [months] |
Bias Score [1] |
RMSE Score [1] |
Seasonal Cycle Score [1] |
Spatial Distribution Score [1] |
Interannual Variability Score [1] |
Overall Score [1] |
|||
|---|---|---|---|---|---|---|---|---|---|---|---|---|---|---|---|---|---|
| Benchmark | [-] | 302. | |||||||||||||||
| D104 | [-] | 304. | 304. | 304. | 303. | 303. | 0.998 | 2.29 | 0.451 | 0.528 | 0.712 | 0.948 | 0.974 | 0.875 | 0.792 | ||
| LMBIRCH4 | [-] | 303. | 303. | 303. | 302. | 303. | 1.04 | 2.28 | 0.473 | 0.534 | 0.713 | 0.942 | 0.972 | 0.880 | 0.792 | ||
| PHSParam | [-] | 303. | 303. | 304. | 302. | 303. | 1.05 | 2.28 | 0.459 | 0.534 | 0.712 | 0.944 | 0.973 | 0.881 | 0.793 | ||
| PPE | [-] | 303. | 303. | 303. | 302. | 303. | 1.03 | 2.28 | 0.459 | 0.536 | 0.711 | 0.944 | 0.973 | 0.881 | 0.793 | ||
| R15 | [-] | 303. | 303. | 303. | 302. | 303. | 1.03 | 2.27 | 0.473 | 0.536 | 0.713 | 0.942 | 0.973 | 0.880 | 0.793 |
Download Data |
Period Mean (original grids) [K] |
Model Period Mean (intersection) [K] |
Model Period Mean (complement) [K] |
Benchmark Period Mean (intersection) [K] |
Benchmark Period Mean (complement) [K] |
Bias [K] |
RMSE [K] |
Phase Shift [months] |
Bias Score [1] |
RMSE Score [1] |
Seasonal Cycle Score [1] |
Spatial Distribution Score [1] |
Interannual Variability Score [1] |
Overall Score [1] |
|||
|---|---|---|---|---|---|---|---|---|---|---|---|---|---|---|---|---|---|
| Benchmark | [-] | 292. | |||||||||||||||
| D104 | [-] | 293. | 293. | 299. | 292. | 295. | 0.909 | 1.39 | 0.119 | 0.872 | 0.926 | 0.992 | 0.996 | 0.952 | 0.944 | ||
| LMBIRCH4 | [-] | 293. | 293. | 299. | 292. | 294. | 0.921 | 1.42 | 0.0872 | 0.875 | 0.922 | 0.994 | 0.996 | 0.956 | 0.944 | ||
| PHSParam | [-] | 293. | 293. | 299. | 292. | 294. | 0.918 | 1.41 | 0.0872 | 0.876 | 0.922 | 0.994 | 0.996 | 0.956 | 0.944 | ||
| PPE | [-] | 293. | 293. | 299. | 292. | 294. | 0.889 | 1.39 | 0.0872 | 0.878 | 0.922 | 0.994 | 0.996 | 0.956 | 0.945 | ||
| R15 | [-] | 293. | 293. | 299. | 292. | 294. | 0.911 | 1.41 | 0.0872 | 0.877 | 0.922 | 0.994 | 0.996 | 0.956 | 0.944 |
Download Data |
Period Mean (original grids) [K] |
Model Period Mean (intersection) [K] |
Model Period Mean (complement) [K] |
Benchmark Period Mean (intersection) [K] |
Benchmark Period Mean (complement) [K] |
Bias [K] |
RMSE [K] |
Phase Shift [months] |
Bias Score [1] |
RMSE Score [1] |
Seasonal Cycle Score [1] |
Spatial Distribution Score [1] |
Interannual Variability Score [1] |
Overall Score [1] |
|||
|---|---|---|---|---|---|---|---|---|---|---|---|---|---|---|---|---|---|
| Benchmark | [-] | 279. | |||||||||||||||
| D104 | [-] | 280. | 280. | 282. | 280. | 283. | 0.567 | 1.39 | 0.0762 | 0.914 | 0.921 | 0.995 | 0.998 | 0.953 | 0.950 | ||
| LMBIRCH4 | [-] | 280. | 280. | 281. | 279. | 282. | 0.528 | 1.41 | 0.0520 | 0.916 | 0.918 | 0.997 | 0.998 | 0.953 | 0.950 | ||
| PHSParam | [-] | 280. | 280. | 281. | 279. | 282. | 0.525 | 1.41 | 0.0520 | 0.916 | 0.918 | 0.997 | 0.998 | 0.953 | 0.950 | ||
| PPE | [-] | 280. | 280. | 281. | 279. | 282. | 0.485 | 1.39 | 0.0533 | 0.918 | 0.919 | 0.996 | 0.998 | 0.953 | 0.951 | ||
| R15 | [-] | 280. | 280. | 281. | 279. | 282. | 0.543 | 1.41 | 0.0533 | 0.916 | 0.919 | 0.996 | 0.998 | 0.953 | 0.950 |
Download Data |
Period Mean (original grids) [K] |
Model Period Mean (intersection) [K] |
Model Period Mean (complement) [K] |
Benchmark Period Mean (intersection) [K] |
Benchmark Period Mean (complement) [K] |
Bias [K] |
RMSE [K] |
Phase Shift [months] |
Bias Score [1] |
RMSE Score [1] |
Seasonal Cycle Score [1] |
Spatial Distribution Score [1] |
Interannual Variability Score [1] |
Overall Score [1] |
|||
|---|---|---|---|---|---|---|---|---|---|---|---|---|---|---|---|---|---|
| Benchmark | [-] | 291. | |||||||||||||||
| D104 | [-] | 292. | 293. | 292. | 291. | 295. | 1.28 | 2.08 | 0.0760 | 0.823 | 0.899 | 0.995 | 0.996 | 0.929 | 0.923 | ||
| LMBIRCH4 | [-] | 292. | 292. | 292. | 291. | 294. | 1.23 | 2.09 | 0.0613 | 0.827 | 0.893 | 0.996 | 0.997 | 0.932 | 0.923 | ||
| PHSParam | [-] | 292. | 292. | 292. | 291. | 294. | 1.25 | 2.09 | 0.0613 | 0.826 | 0.894 | 0.996 | 0.997 | 0.932 | 0.923 | ||
| PPE | [-] | 292. | 292. | 292. | 291. | 294. | 1.24 | 2.08 | 0.0613 | 0.827 | 0.895 | 0.996 | 0.997 | 0.932 | 0.923 | ||
| R15 | [-] | 292. | 292. | 292. | 291. | 294. | 1.21 | 2.08 | 0.0613 | 0.828 | 0.893 | 0.996 | 0.997 | 0.934 | 0.924 |
Download Data |
Period Mean (original grids) [K] |
Model Period Mean (intersection) [K] |
Model Period Mean (complement) [K] |
Benchmark Period Mean (intersection) [K] |
Benchmark Period Mean (complement) [K] |
Bias [K] |
RMSE [K] |
Phase Shift [months] |
Bias Score [1] |
RMSE Score [1] |
Seasonal Cycle Score [1] |
Spatial Distribution Score [1] |
Interannual Variability Score [1] |
Overall Score [1] |
|||
|---|---|---|---|---|---|---|---|---|---|---|---|---|---|---|---|---|---|
| Benchmark | [-] | 304. | |||||||||||||||
| D104 | [-] | 306. | 306. | 304. | 304. | 304. | 1.66 | 2.10 | 0.554 | 0.233 | 0.654 | 0.928 | 1.00 | 0.887 | 0.726 | ||
| LMBIRCH4 | [-] | 306. | 306. | 304. | 304. | 304. | 1.67 | 2.12 | 0.474 | 0.244 | 0.634 | 0.937 | 1.00 | 0.899 | 0.725 | ||
| PHSParam | [-] | 306. | 306. | 304. | 304. | 304. | 1.67 | 2.11 | 0.453 | 0.244 | 0.632 | 0.939 | 1.00 | 0.900 | 0.725 | ||
| PPE | [-] | 306. | 306. | 304. | 304. | 304. | 1.59 | 2.05 | 0.453 | 0.257 | 0.631 | 0.939 | 1.00 | 0.900 | 0.726 | ||
| R15 | [-] | 306. | 306. | 304. | 304. | 304. | 1.68 | 2.13 | 0.483 | 0.242 | 0.634 | 0.936 | 1.00 | 0.899 | 0.724 |
Download Data |
Period Mean (original grids) [K] |
Model Period Mean (intersection) [K] |
Model Period Mean (complement) [K] |
Benchmark Period Mean (intersection) [K] |
Benchmark Period Mean (complement) [K] |
Bias [K] |
RMSE [K] |
Phase Shift [months] |
Bias Score [1] |
RMSE Score [1] |
Seasonal Cycle Score [1] |
Spatial Distribution Score [1] |
Interannual Variability Score [1] |
Overall Score [1] |
|||
|---|---|---|---|---|---|---|---|---|---|---|---|---|---|---|---|---|---|
| Benchmark | [-] | 301. | |||||||||||||||
| D104 | [-] | 303. | 304. | 300. | 302. | 301. | 1.63 | 1.91 | 0.314 | 0.491 | 0.773 | 0.963 | 0.996 | 0.896 | 0.815 | ||
| LMBIRCH4 | [-] | 303. | 303. | 300. | 301. | 300. | 1.67 | 1.97 | 0.340 | 0.487 | 0.762 | 0.957 | 0.996 | 0.921 | 0.814 | ||
| PHSParam | [-] | 303. | 303. | 300. | 301. | 300. | 1.69 | 1.98 | 0.327 | 0.484 | 0.761 | 0.958 | 0.996 | 0.922 | 0.814 | ||
| PPE | [-] | 303. | 303. | 300. | 301. | 300. | 1.68 | 1.97 | 0.342 | 0.486 | 0.762 | 0.958 | 0.995 | 0.922 | 0.814 | ||
| R15 | [-] | 303. | 303. | 300. | 301. | 300. | 1.66 | 1.95 | 0.332 | 0.490 | 0.760 | 0.958 | 0.997 | 0.922 | 0.814 |
Download Data |
Period Mean (original grids) [K] |
Model Period Mean (intersection) [K] |
Model Period Mean (complement) [K] |
Benchmark Period Mean (intersection) [K] |
Benchmark Period Mean (complement) [K] |
Bias [K] |
RMSE [K] |
Phase Shift [months] |
Bias Score [1] |
RMSE Score [1] |
Seasonal Cycle Score [1] |
Spatial Distribution Score [1] |
Interannual Variability Score [1] |
Overall Score [1] |
|||
|---|---|---|---|---|---|---|---|---|---|---|---|---|---|---|---|---|---|
| Benchmark | [-] | 290. | |||||||||||||||
| D104 | [-] | 293. | 292. | 293. | 290. | 288. | 1.69 | 2.99 | 0.475 | 0.524 | 0.734 | 0.940 | 0.990 | 0.863 | 0.798 | ||
| LMBIRCH4 | [-] | 292. | 292. | 293. | 290. | 288. | 1.66 | 3.00 | 0.387 | 0.527 | 0.734 | 0.947 | 0.988 | 0.912 | 0.807 | ||
| PHSParam | [-] | 292. | 292. | 293. | 290. | 288. | 1.66 | 3.01 | 0.387 | 0.526 | 0.733 | 0.947 | 0.988 | 0.911 | 0.806 | ||
| PPE | [-] | 292. | 292. | 293. | 290. | 288. | 1.64 | 2.99 | 0.387 | 0.528 | 0.734 | 0.947 | 0.988 | 0.912 | 0.807 | ||
| R15 | [-] | 292. | 292. | 293. | 290. | 288. | 1.64 | 3.00 | 0.368 | 0.528 | 0.734 | 0.951 | 0.988 | 0.911 | 0.808 |
Temporally integrated period mean