Mean State
Download Data |
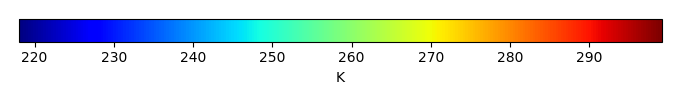
Period Mean (original grids) [K] |
Model Period Mean (intersection) [K] |
Model Period Mean (complement) [K] |
Benchmark Period Mean (intersection) [K] |
Benchmark Period Mean (complement) [K] |
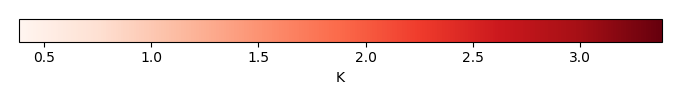
Bias [K] |
RMSE [K] |
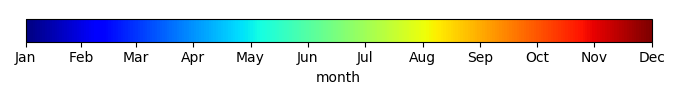
Phase Shift [months] |
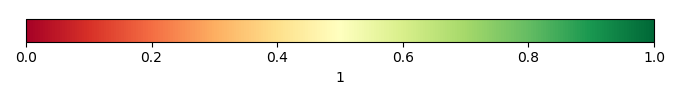
Bias Score [1] |
RMSE Score [1] |
Seasonal Cycle Score [1] |
Spatial Distribution Score [1] |
Interannual Variability Score [1] |
Overall Score [1] |
|||
|---|---|---|---|---|---|---|---|---|---|---|---|---|---|---|---|---|---|
| Benchmark | [-] | 293. | |||||||||||||||
| D104 | [-] | 294. | 294. | 297. | 293. | 296. | 0.944 | 1.50 | 0.971 | 0.389 | 0.504 | 0.868 | 0.999 | 0.788 | 0.675 | ||
| LMBIRCH4 | [-] | 294. | 293. | 296. | 293. | 296. | 0.869 | 1.51 | 0.690 | 0.437 | 0.472 | 0.921 | 1.00 | 0.771 | 0.679 | ||
| PHSParam | [-] | 294. | 293. | 296. | 293. | 296. | 0.875 | 1.50 | 0.669 | 0.437 | 0.476 | 0.923 | 1.00 | 0.774 | 0.681 | ||
| PPE | [-] | 294. | 293. | 296. | 293. | 296. | 0.826 | 1.48 | 0.713 | 0.455 | 0.474 | 0.916 | 1.00 | 0.772 | 0.682 | ||
| R15 | [-] | 294. | 294. | 296. | 293. | 296. | 0.938 | 1.54 | 0.695 | 0.410 | 0.478 | 0.921 | 1.00 | 0.774 | 0.677 |
Download Data |
Period Mean (original grids) [K] |
Model Period Mean (intersection) [K] |
Model Period Mean (complement) [K] |
Benchmark Period Mean (intersection) [K] |
Benchmark Period Mean (complement) [K] |
Bias [K] |
RMSE [K] |
Phase Shift [months] |
Bias Score [1] |
RMSE Score [1] |
Seasonal Cycle Score [1] |
Spatial Distribution Score [1] |
Interannual Variability Score [1] |
Overall Score [1] |
|||
|---|---|---|---|---|---|---|---|---|---|---|---|---|---|---|---|---|---|
| Benchmark | [-] | 293. | |||||||||||||||
| D104 | [-] | 295. | 295. | 297. | 294. | 295. | 1.21 | 1.65 | 0.269 | 0.597 | 0.759 | 0.976 | 0.984 | 0.900 | 0.829 | ||
| LMBIRCH4 | [-] | 294. | 294. | 296. | 293. | 294. | 1.18 | 1.68 | 0.256 | 0.606 | 0.731 | 0.977 | 0.982 | 0.861 | 0.815 | ||
| PHSParam | [-] | 294. | 294. | 296. | 293. | 294. | 1.20 | 1.69 | 0.251 | 0.603 | 0.732 | 0.977 | 0.982 | 0.860 | 0.814 | ||
| PPE | [-] | 294. | 294. | 296. | 293. | 294. | 1.18 | 1.68 | 0.260 | 0.606 | 0.732 | 0.976 | 0.983 | 0.861 | 0.815 | ||
| R15 | [-] | 294. | 294. | 296. | 293. | 294. | 1.23 | 1.71 | 0.255 | 0.598 | 0.733 | 0.977 | 0.981 | 0.859 | 0.813 |
Download Data |
Period Mean (original grids) [K] |
Model Period Mean (intersection) [K] |
Model Period Mean (complement) [K] |
Benchmark Period Mean (intersection) [K] |
Benchmark Period Mean (complement) [K] |
Bias [K] |
RMSE [K] |
Phase Shift [months] |
Bias Score [1] |
RMSE Score [1] |
Seasonal Cycle Score [1] |
Spatial Distribution Score [1] |
Interannual Variability Score [1] |
Overall Score [1] |
|||
|---|---|---|---|---|---|---|---|---|---|---|---|---|---|---|---|---|---|
| Benchmark | [-] | 288. | |||||||||||||||
| D104 | [-] | 290. | 290. | 293. | 289. | 290. | 1.04 | 1.63 | 0.734 | 0.622 | 0.773 | 0.905 | 0.998 | 0.845 | 0.819 | ||
| LMBIRCH4 | [-] | 289. | 289. | 293. | 288. | 290. | 1.06 | 1.65 | 0.677 | 0.631 | 0.767 | 0.917 | 0.999 | 0.835 | 0.819 | ||
| PHSParam | [-] | 289. | 289. | 293. | 288. | 290. | 1.10 | 1.67 | 0.655 | 0.623 | 0.768 | 0.921 | 0.999 | 0.833 | 0.819 | ||
| PPE | [-] | 289. | 289. | 293. | 288. | 290. | 1.07 | 1.67 | 0.655 | 0.625 | 0.768 | 0.921 | 0.999 | 0.835 | 0.819 | ||
| R15 | [-] | 289. | 289. | 293. | 288. | 290. | 1.11 | 1.68 | 0.651 | 0.621 | 0.770 | 0.922 | 0.999 | 0.834 | 0.819 |
Download Data |
Period Mean (original grids) [K] |
Model Period Mean (intersection) [K] |
Model Period Mean (complement) [K] |
Benchmark Period Mean (intersection) [K] |
Benchmark Period Mean (complement) [K] |
Bias [K] |
RMSE [K] |
Phase Shift [months] |
Bias Score [1] |
RMSE Score [1] |
Seasonal Cycle Score [1] |
Spatial Distribution Score [1] |
Interannual Variability Score [1] |
Overall Score [1] |
|||
|---|---|---|---|---|---|---|---|---|---|---|---|---|---|---|---|---|---|
| Benchmark | [-] | 256. | |||||||||||||||
| D104 | [-] | 257. | 257. | 263. | 258. | 264. | 0.642 | 2.12 | 0.0598 | 0.905 | 0.918 | 0.996 | 0.995 | 0.933 | 0.944 | ||
| LMBIRCH4 | [-] | 257. | 256. | 262. | 256. | 263. | 0.819 | 2.32 | 0.0582 | 0.905 | 0.905 | 0.996 | 0.996 | 0.904 | 0.935 | ||
| PHSParam | [-] | 257. | 256. | 262. | 256. | 263. | 0.793 | 2.31 | 0.0557 | 0.905 | 0.905 | 0.996 | 0.995 | 0.905 | 0.935 | ||
| PPE | [-] | 256. | 256. | 262. | 256. | 263. | 0.783 | 2.32 | 0.0582 | 0.905 | 0.904 | 0.996 | 0.995 | 0.905 | 0.935 | ||
| R15 | [-] | 256. | 256. | 262. | 256. | 263. | 0.755 | 2.32 | 0.0557 | 0.905 | 0.905 | 0.996 | 0.995 | 0.905 | 0.935 |
Download Data |
Period Mean (original grids) [K] |
Model Period Mean (intersection) [K] |
Model Period Mean (complement) [K] |
Benchmark Period Mean (intersection) [K] |
Benchmark Period Mean (complement) [K] |
Bias [K] |
RMSE [K] |
Phase Shift [months] |
Bias Score [1] |
RMSE Score [1] |
Seasonal Cycle Score [1] |
Spatial Distribution Score [1] |
Interannual Variability Score [1] |
Overall Score [1] |
|||
|---|---|---|---|---|---|---|---|---|---|---|---|---|---|---|---|---|---|
| Benchmark | [-] | 294. | |||||||||||||||
| D104 | [-] | 296. | 296. | 297. | 295. | 295. | 1.45 | 2.09 | 1.44 | 0.184 | 0.437 | 0.778 | 0.926 | 0.822 | 0.597 | ||
| LMBIRCH4 | [-] | 295. | 295. | 296. | 294. | 295. | 1.52 | 2.14 | 1.46 | 0.223 | 0.494 | 0.778 | 0.921 | 0.804 | 0.619 | ||
| PHSParam | [-] | 295. | 295. | 296. | 294. | 295. | 1.50 | 2.13 | 1.44 | 0.224 | 0.493 | 0.782 | 0.922 | 0.808 | 0.620 | ||
| PPE | [-] | 295. | 295. | 296. | 294. | 295. | 1.48 | 2.12 | 1.45 | 0.228 | 0.492 | 0.782 | 0.922 | 0.811 | 0.621 | ||
| R15 | [-] | 295. | 295. | 296. | 294. | 295. | 1.55 | 2.16 | 1.46 | 0.218 | 0.496 | 0.778 | 0.921 | 0.801 | 0.618 |
Download Data |
Period Mean (original grids) [K] |
Model Period Mean (intersection) [K] |
Model Period Mean (complement) [K] |
Benchmark Period Mean (intersection) [K] |
Benchmark Period Mean (complement) [K] |
Bias [K] |
RMSE [K] |
Phase Shift [months] |
Bias Score [1] |
RMSE Score [1] |
Seasonal Cycle Score [1] |
Spatial Distribution Score [1] |
Interannual Variability Score [1] |
Overall Score [1] |
|||
|---|---|---|---|---|---|---|---|---|---|---|---|---|---|---|---|---|---|
| Benchmark | [-] | 265. | |||||||||||||||
| D104 | [-] | 266. | 266. | 271. | 266. | 270. | -0.241 | 1.29 | 0.0266 | 0.934 | 0.942 | 0.998 | 0.999 | 0.948 | 0.960 | ||
| LMBIRCH4 | [-] | 265. | 265. | 270. | 265. | 269. | -0.163 | 1.31 | 0.0256 | 0.938 | 0.941 | 0.998 | 0.999 | 0.964 | 0.963 | ||
| PHSParam | [-] | 265. | 265. | 270. | 265. | 269. | -0.175 | 1.31 | 0.0256 | 0.937 | 0.942 | 0.998 | 0.998 | 0.964 | 0.963 | ||
| PPE | [-] | 265. | 265. | 270. | 265. | 269. | -0.209 | 1.31 | 0.0256 | 0.937 | 0.941 | 0.998 | 0.999 | 0.964 | 0.963 | ||
| R15 | [-] | 265. | 265. | 270. | 265. | 269. | -0.155 | 1.31 | 0.0256 | 0.937 | 0.941 | 0.998 | 0.999 | 0.964 | 0.964 |
Download Data |
Period Mean (original grids) [K] |
Model Period Mean (intersection) [K] |
Model Period Mean (complement) [K] |
Benchmark Period Mean (intersection) [K] |
Benchmark Period Mean (complement) [K] |
Bias [K] |
RMSE [K] |
Phase Shift [months] |
Bias Score [1] |
RMSE Score [1] |
Seasonal Cycle Score [1] |
Spatial Distribution Score [1] |
Interannual Variability Score [1] |
Overall Score [1] |
|||
|---|---|---|---|---|---|---|---|---|---|---|---|---|---|---|---|---|---|
| Benchmark | [-] | 274. | |||||||||||||||
| D104 | [-] | 275. | 275. | 285. | 275. | 284. | 0.722 | 1.97 | 0.0377 | 0.851 | 0.917 | 0.997 | 1.00 | 0.927 | 0.935 | ||
| LMBIRCH4 | [-] | 275. | 274. | 284. | 274. | 283. | 0.773 | 2.00 | 0.0226 | 0.854 | 0.915 | 0.998 | 1.00 | 0.925 | 0.935 | ||
| PHSParam | [-] | 275. | 274. | 284. | 274. | 283. | 0.752 | 2.00 | 0.0226 | 0.854 | 0.915 | 0.998 | 1.00 | 0.925 | 0.935 | ||
| PPE | [-] | 275. | 274. | 284. | 274. | 283. | 0.743 | 2.00 | 0.0226 | 0.854 | 0.915 | 0.998 | 1.00 | 0.925 | 0.934 | ||
| R15 | [-] | 275. | 274. | 284. | 274. | 283. | 0.787 | 2.01 | 0.0226 | 0.854 | 0.915 | 0.998 | 1.00 | 0.925 | 0.934 |
Download Data |
Period Mean (original grids) [K] |
Model Period Mean (intersection) [K] |
Model Period Mean (complement) [K] |
Benchmark Period Mean (intersection) [K] |
Benchmark Period Mean (complement) [K] |
Bias [K] |
RMSE [K] |
Phase Shift [months] |
Bias Score [1] |
RMSE Score [1] |
Seasonal Cycle Score [1] |
Spatial Distribution Score [1] |
Interannual Variability Score [1] |
Overall Score [1] |
|||
|---|---|---|---|---|---|---|---|---|---|---|---|---|---|---|---|---|---|
| Benchmark | [-] | 291. | |||||||||||||||
| D104 | [-] | 292. | 292. | 297. | 292. | 295. | 0.791 | 2.01 | 0.327 | 0.655 | 0.817 | 0.971 | 0.993 | 0.914 | 0.861 | ||
| LMBIRCH4 | [-] | 292. | 291. | 297. | 291. | 295. | 0.770 | 2.01 | 0.280 | 0.669 | 0.824 | 0.976 | 0.994 | 0.924 | 0.868 | ||
| PHSParam | [-] | 292. | 291. | 297. | 291. | 295. | 0.794 | 2.02 | 0.294 | 0.667 | 0.824 | 0.975 | 0.993 | 0.925 | 0.868 | ||
| PPE | [-] | 292. | 291. | 297. | 291. | 295. | 0.749 | 2.00 | 0.299 | 0.670 | 0.823 | 0.974 | 0.994 | 0.925 | 0.868 | ||
| R15 | [-] | 292. | 291. | 297. | 291. | 295. | 0.825 | 2.03 | 0.275 | 0.665 | 0.825 | 0.977 | 0.993 | 0.926 | 0.868 |
Download Data |
Period Mean (original grids) [K] |
Model Period Mean (intersection) [K] |
Model Period Mean (complement) [K] |
Benchmark Period Mean (intersection) [K] |
Benchmark Period Mean (complement) [K] |
Bias [K] |
RMSE [K] |
Phase Shift [months] |
Bias Score [1] |
RMSE Score [1] |
Seasonal Cycle Score [1] |
Spatial Distribution Score [1] |
Interannual Variability Score [1] |
Overall Score [1] |
|||
|---|---|---|---|---|---|---|---|---|---|---|---|---|---|---|---|---|---|
| Benchmark | [-] | 259. | |||||||||||||||
| D104 | [-] | 260. | 260. | 263. | 260. | 261. | -0.210 | 1.44 | 0.0318 | 0.939 | 0.932 | 0.998 | 0.998 | 0.953 | 0.959 | ||
| LMBIRCH4 | [-] | 259. | 259. | 262. | 259. | 260. | -0.0685 | 1.68 | 0.0322 | 0.943 | 0.916 | 0.998 | 0.999 | 0.915 | 0.948 | ||
| PHSParam | [-] | 259. | 259. | 262. | 259. | 260. | -0.0761 | 1.68 | 0.0322 | 0.943 | 0.916 | 0.998 | 0.998 | 0.915 | 0.948 | ||
| PPE | [-] | 259. | 259. | 262. | 259. | 260. | -0.0906 | 1.69 | 0.0322 | 0.943 | 0.915 | 0.998 | 0.998 | 0.915 | 0.948 | ||
| R15 | [-] | 259. | 259. | 262. | 259. | 260. | -0.120 | 1.70 | 0.0333 | 0.942 | 0.915 | 0.998 | 0.998 | 0.915 | 0.947 |
Download Data |
Period Mean (original grids) [K] |
Model Period Mean (intersection) [K] |
Model Period Mean (complement) [K] |
Benchmark Period Mean (intersection) [K] |
Benchmark Period Mean (complement) [K] |
Bias [K] |
RMSE [K] |
Phase Shift [months] |
Bias Score [1] |
RMSE Score [1] |
Seasonal Cycle Score [1] |
Spatial Distribution Score [1] |
Interannual Variability Score [1] |
Overall Score [1] |
|||
|---|---|---|---|---|---|---|---|---|---|---|---|---|---|---|---|---|---|
| Benchmark | [-] | 287. | |||||||||||||||
| D104 | [-] | 289. | 289. | 289. | 288. | 289. | 1.16 | 1.44 | 0.171 | 0.766 | 0.885 | 0.987 | 1.00 | 0.924 | 0.908 | ||
| LMBIRCH4 | [-] | 289. | 289. | 289. | 287. | 289. | 1.24 | 1.52 | 0.152 | 0.754 | 0.877 | 0.990 | 1.00 | 0.936 | 0.906 | ||
| PHSParam | [-] | 289. | 289. | 289. | 287. | 289. | 1.25 | 1.52 | 0.159 | 0.753 | 0.877 | 0.989 | 1.00 | 0.936 | 0.906 | ||
| PPE | [-] | 289. | 289. | 289. | 287. | 289. | 1.24 | 1.52 | 0.158 | 0.755 | 0.877 | 0.989 | 1.00 | 0.935 | 0.906 | ||
| R15 | [-] | 289. | 289. | 289. | 287. | 289. | 1.28 | 1.54 | 0.166 | 0.750 | 0.878 | 0.989 | 1.00 | 0.936 | 0.905 |
Download Data |
Period Mean (original grids) [K] |
Model Period Mean (intersection) [K] |
Model Period Mean (complement) [K] |
Benchmark Period Mean (intersection) [K] |
Benchmark Period Mean (complement) [K] |
Bias [K] |
RMSE [K] |
Phase Shift [months] |
Bias Score [1] |
RMSE Score [1] |
Seasonal Cycle Score [1] |
Spatial Distribution Score [1] |
Interannual Variability Score [1] |
Overall Score [1] |
|||
|---|---|---|---|---|---|---|---|---|---|---|---|---|---|---|---|---|---|
| Benchmark | [-] | 277. | |||||||||||||||
| D104 | [-] | 277. | 277. | 281. | 278. | 280. | 0.133 | 1.61 | 0.312 | 0.805 | 0.893 | 0.979 | 0.991 | 0.933 | 0.916 | ||
| LMBIRCH4 | [-] | 277. | 277. | 281. | 277. | 279. | 0.197 | 1.63 | 0.219 | 0.806 | 0.891 | 0.985 | 0.990 | 0.931 | 0.916 | ||
| PHSParam | [-] | 277. | 277. | 281. | 277. | 279. | 0.173 | 1.63 | 0.214 | 0.805 | 0.891 | 0.986 | 0.990 | 0.931 | 0.916 | ||
| PPE | [-] | 277. | 277. | 281. | 277. | 279. | 0.167 | 1.64 | 0.226 | 0.806 | 0.890 | 0.985 | 0.990 | 0.931 | 0.915 | ||
| R15 | [-] | 277. | 277. | 281. | 277. | 279. | 0.220 | 1.63 | 0.204 | 0.806 | 0.891 | 0.986 | 0.989 | 0.931 | 0.916 |
Download Data |
Period Mean (original grids) [K] |
Model Period Mean (intersection) [K] |
Model Period Mean (complement) [K] |
Benchmark Period Mean (intersection) [K] |
Benchmark Period Mean (complement) [K] |
Bias [K] |
RMSE [K] |
Phase Shift [months] |
Bias Score [1] |
RMSE Score [1] |
Seasonal Cycle Score [1] |
Spatial Distribution Score [1] |
Interannual Variability Score [1] |
Overall Score [1] |
|||
|---|---|---|---|---|---|---|---|---|---|---|---|---|---|---|---|---|---|
| Benchmark | [-] | 281. | |||||||||||||||
| D104 | [-] | 278. | 281. | 253. | 281. | 289. | 0.746 | 1.77 | 0.355 | 0.726 | 0.826 | 0.957 | 0.999 | 0.912 | 0.874 | ||
| LMBIRCH4 | [-] | 277. | 281. | 251. | 280. | 289. | 0.790 | 1.81 | 0.306 | 0.732 | 0.821 | 0.964 | 0.999 | 0.903 | 0.873 | ||
| PHSParam | [-] | 277. | 281. | 251. | 280. | 289. | 0.789 | 1.81 | 0.301 | 0.731 | 0.822 | 0.965 | 0.999 | 0.903 | 0.874 | ||
| PPE | [-] | 277. | 281. | 251. | 280. | 289. | 0.768 | 1.81 | 0.306 | 0.733 | 0.821 | 0.964 | 0.999 | 0.904 | 0.874 | ||
| R15 | [-] | 277. | 281. | 251. | 280. | 289. | 0.820 | 1.83 | 0.303 | 0.727 | 0.822 | 0.964 | 0.999 | 0.903 | 0.873 |
Download Data |
Period Mean (original grids) [K] |
Model Period Mean (intersection) [K] |
Model Period Mean (complement) [K] |
Benchmark Period Mean (intersection) [K] |
Benchmark Period Mean (complement) [K] |
Bias [K] |
RMSE [K] |
Phase Shift [months] |
Bias Score [1] |
RMSE Score [1] |
Seasonal Cycle Score [1] |
Spatial Distribution Score [1] |
Interannual Variability Score [1] |
Overall Score [1] |
|||
|---|---|---|---|---|---|---|---|---|---|---|---|---|---|---|---|---|---|
| Benchmark | [-] | 289. | |||||||||||||||
| D104 | [-] | 290. | 290. | 291. | 289. | 290. | 0.669 | 1.61 | 0.298 | 0.824 | 0.878 | 0.977 | 1.00 | 0.926 | 0.914 | ||
| LMBIRCH4 | [-] | 289. | 289. | 291. | 289. | 289. | 0.672 | 1.61 | 0.263 | 0.822 | 0.872 | 0.980 | 0.999 | 0.906 | 0.909 | ||
| PHSParam | [-] | 289. | 289. | 291. | 289. | 289. | 0.672 | 1.61 | 0.264 | 0.822 | 0.872 | 0.980 | 0.999 | 0.906 | 0.909 | ||
| PPE | [-] | 289. | 289. | 291. | 289. | 289. | 0.668 | 1.61 | 0.264 | 0.822 | 0.872 | 0.980 | 0.999 | 0.906 | 0.908 | ||
| R15 | [-] | 289. | 289. | 291. | 289. | 289. | 0.704 | 1.62 | 0.252 | 0.821 | 0.873 | 0.981 | 1.00 | 0.905 | 0.909 |
Download Data |
Period Mean (original grids) [K] |
Model Period Mean (intersection) [K] |
Model Period Mean (complement) [K] |
Benchmark Period Mean (intersection) [K] |
Benchmark Period Mean (complement) [K] |
Bias [K] |
RMSE [K] |
Phase Shift [months] |
Bias Score [1] |
RMSE Score [1] |
Seasonal Cycle Score [1] |
Spatial Distribution Score [1] |
Interannual Variability Score [1] |
Overall Score [1] |
|||
|---|---|---|---|---|---|---|---|---|---|---|---|---|---|---|---|---|---|
| Benchmark | [-] | 260. | |||||||||||||||
| D104 | [-] | 261. | 261. | 263. | 261. | 265. | 0.590 | 1.92 | 0.0482 | 0.911 | 0.906 | 0.997 | 0.994 | 0.941 | 0.942 | ||
| LMBIRCH4 | [-] | 260. | 260. | 262. | 260. | 264. | 0.722 | 2.01 | 0.0567 | 0.911 | 0.900 | 0.996 | 0.994 | 0.914 | 0.936 | ||
| PHSParam | [-] | 260. | 260. | 262. | 260. | 264. | 0.721 | 2.01 | 0.0577 | 0.911 | 0.901 | 0.996 | 0.994 | 0.914 | 0.936 | ||
| PPE | [-] | 260. | 260. | 262. | 260. | 264. | 0.718 | 2.01 | 0.0567 | 0.911 | 0.900 | 0.996 | 0.994 | 0.914 | 0.936 | ||
| R15 | [-] | 260. | 260. | 262. | 260. | 264. | 0.705 | 2.01 | 0.0567 | 0.911 | 0.901 | 0.996 | 0.994 | 0.914 | 0.936 |
Download Data |
Period Mean (original grids) [K] |
Model Period Mean (intersection) [K] |
Model Period Mean (complement) [K] |
Benchmark Period Mean (intersection) [K] |
Benchmark Period Mean (complement) [K] |
Bias [K] |
RMSE [K] |
Phase Shift [months] |
Bias Score [1] |
RMSE Score [1] |
Seasonal Cycle Score [1] |
Spatial Distribution Score [1] |
Interannual Variability Score [1] |
Overall Score [1] |
|||
|---|---|---|---|---|---|---|---|---|---|---|---|---|---|---|---|---|---|
| Benchmark | [-] | 289. | |||||||||||||||
| D104 | [-] | 290. | 289. | 294. | 289. | 295. | 1.71 | 2.65 | 0.440 | 0.492 | 0.740 | 0.957 | 0.996 | 0.886 | 0.802 | ||
| LMBIRCH4 | [-] | 289. | 289. | 294. | 289. | 294. | 1.73 | 2.69 | 0.456 | 0.498 | 0.742 | 0.956 | 0.994 | 0.877 | 0.801 | ||
| PHSParam | [-] | 289. | 289. | 294. | 289. | 294. | 1.73 | 2.68 | 0.425 | 0.499 | 0.741 | 0.959 | 0.994 | 0.877 | 0.802 | ||
| PPE | [-] | 289. | 289. | 294. | 289. | 294. | 1.70 | 2.67 | 0.453 | 0.500 | 0.741 | 0.956 | 0.994 | 0.876 | 0.802 | ||
| R15 | [-] | 290. | 289. | 294. | 289. | 294. | 1.77 | 2.71 | 0.474 | 0.495 | 0.742 | 0.954 | 0.994 | 0.875 | 0.800 |
Download Data |
Period Mean (original grids) [K] |
Model Period Mean (intersection) [K] |
Model Period Mean (complement) [K] |
Benchmark Period Mean (intersection) [K] |
Benchmark Period Mean (complement) [K] |
Bias [K] |
RMSE [K] |
Phase Shift [months] |
Bias Score [1] |
RMSE Score [1] |
Seasonal Cycle Score [1] |
Spatial Distribution Score [1] |
Interannual Variability Score [1] |
Overall Score [1] |
|||
|---|---|---|---|---|---|---|---|---|---|---|---|---|---|---|---|---|---|
| Benchmark | [-] | 280. | |||||||||||||||
| D104 | [-] | 281. | 281. | 290. | 280. | 284. | 1.08 | 1.46 | 0.0614 | 0.861 | 0.926 | 0.996 | 0.997 | 0.958 | 0.944 | ||
| LMBIRCH4 | [-] | 281. | 281. | 289. | 280. | 284. | 1.10 | 1.49 | 0.0403 | 0.862 | 0.922 | 0.997 | 0.998 | 0.962 | 0.944 | ||
| PHSParam | [-] | 281. | 281. | 289. | 280. | 284. | 1.09 | 1.48 | 0.0408 | 0.863 | 0.922 | 0.997 | 0.998 | 0.962 | 0.944 | ||
| PPE | [-] | 281. | 281. | 289. | 280. | 284. | 1.08 | 1.48 | 0.0403 | 0.864 | 0.921 | 0.997 | 0.998 | 0.962 | 0.944 | ||
| R15 | [-] | 281. | 281. | 289. | 280. | 284. | 1.18 | 1.53 | 0.0408 | 0.857 | 0.923 | 0.997 | 0.997 | 0.962 | 0.943 |
Download Data |
Period Mean (original grids) [K] |
Model Period Mean (intersection) [K] |
Model Period Mean (complement) [K] |
Benchmark Period Mean (intersection) [K] |
Benchmark Period Mean (complement) [K] |
Bias [K] |
RMSE [K] |
Phase Shift [months] |
Bias Score [1] |
RMSE Score [1] |
Seasonal Cycle Score [1] |
Spatial Distribution Score [1] |
Interannual Variability Score [1] |
Overall Score [1] |
|||
|---|---|---|---|---|---|---|---|---|---|---|---|---|---|---|---|---|---|
| Benchmark | [-] | 268. | |||||||||||||||
| D104 | [-] | 269. | 269. | 274. | 269. | 276. | 0.409 | 1.41 | 0.0511 | 0.900 | 0.915 | 0.997 | 0.994 | 0.944 | 0.944 | ||
| LMBIRCH4 | [-] | 269. | 268. | 274. | 268. | 275. | 0.463 | 1.45 | 0.0571 | 0.901 | 0.914 | 0.996 | 0.995 | 0.946 | 0.944 | ||
| PHSParam | [-] | 269. | 268. | 274. | 268. | 275. | 0.437 | 1.44 | 0.0571 | 0.902 | 0.914 | 0.996 | 0.995 | 0.946 | 0.944 | ||
| PPE | [-] | 269. | 268. | 274. | 268. | 275. | 0.427 | 1.44 | 0.0571 | 0.902 | 0.914 | 0.996 | 0.994 | 0.946 | 0.944 | ||
| R15 | [-] | 269. | 268. | 274. | 268. | 275. | 0.488 | 1.46 | 0.0571 | 0.900 | 0.914 | 0.996 | 0.994 | 0.946 | 0.944 |
Download Data |
Period Mean (original grids) [K] |
Model Period Mean (intersection) [K] |
Model Period Mean (complement) [K] |
Benchmark Period Mean (intersection) [K] |
Benchmark Period Mean (complement) [K] |
Bias [K] |
RMSE [K] |
Phase Shift [months] |
Bias Score [1] |
RMSE Score [1] |
Seasonal Cycle Score [1] |
Spatial Distribution Score [1] |
Interannual Variability Score [1] |
Overall Score [1] |
|||
|---|---|---|---|---|---|---|---|---|---|---|---|---|---|---|---|---|---|
| Benchmark | [-] | 276. | |||||||||||||||
| D104 | [-] | 277. | 278. | 284. | 276. | 282. | 1.58 | 2.32 | 0.0694 | 0.765 | 0.883 | 0.995 | 1.00 | 0.930 | 0.909 | ||
| LMBIRCH4 | [-] | 277. | 277. | 284. | 276. | 282. | 1.61 | 2.37 | 0.0458 | 0.764 | 0.875 | 0.997 | 1.00 | 0.938 | 0.908 | ||
| PHSParam | [-] | 277. | 277. | 284. | 276. | 282. | 1.57 | 2.35 | 0.0458 | 0.766 | 0.876 | 0.997 | 1.00 | 0.939 | 0.909 | ||
| PPE | [-] | 277. | 277. | 284. | 276. | 282. | 1.55 | 2.34 | 0.0566 | 0.767 | 0.876 | 0.996 | 1.00 | 0.939 | 0.909 | ||
| R15 | [-] | 277. | 277. | 284. | 276. | 282. | 1.65 | 2.39 | 0.0402 | 0.762 | 0.876 | 0.997 | 1.00 | 0.938 | 0.908 |
Download Data |
Period Mean (original grids) [K] |
Model Period Mean (intersection) [K] |
Model Period Mean (complement) [K] |
Benchmark Period Mean (intersection) [K] |
Benchmark Period Mean (complement) [K] |
Bias [K] |
RMSE [K] |
Phase Shift [months] |
Bias Score [1] |
RMSE Score [1] |
Seasonal Cycle Score [1] |
Spatial Distribution Score [1] |
Interannual Variability Score [1] |
Overall Score [1] |
|||
|---|---|---|---|---|---|---|---|---|---|---|---|---|---|---|---|---|---|
| Benchmark | [-] | 294. | |||||||||||||||
| D104 | [-] | 295. | 295. | 297. | 294. | 296. | 0.877 | 1.57 | 1.53 | 0.378 | 0.540 | 0.764 | 0.996 | 0.878 | 0.683 | ||
| LMBIRCH4 | [-] | 295. | 295. | 296. | 294. | 295. | 0.927 | 1.60 | 1.21 | 0.396 | 0.545 | 0.816 | 0.995 | 0.868 | 0.694 | ||
| PHSParam | [-] | 295. | 295. | 296. | 294. | 295. | 0.930 | 1.61 | 1.18 | 0.393 | 0.546 | 0.823 | 0.996 | 0.869 | 0.695 | ||
| PPE | [-] | 295. | 294. | 296. | 294. | 295. | 0.875 | 1.57 | 1.18 | 0.407 | 0.543 | 0.823 | 0.995 | 0.871 | 0.697 | ||
| R15 | [-] | 295. | 295. | 296. | 294. | 295. | 0.978 | 1.63 | 1.21 | 0.383 | 0.546 | 0.815 | 0.995 | 0.865 | 0.692 |
Download Data |
Period Mean (original grids) [K] |
Model Period Mean (intersection) [K] |
Model Period Mean (complement) [K] |
Benchmark Period Mean (intersection) [K] |
Benchmark Period Mean (complement) [K] |
Bias [K] |
RMSE [K] |
Phase Shift [months] |
Bias Score [1] |
RMSE Score [1] |
Seasonal Cycle Score [1] |
Spatial Distribution Score [1] |
Interannual Variability Score [1] |
Overall Score [1] |
|||
|---|---|---|---|---|---|---|---|---|---|---|---|---|---|---|---|---|---|
| Benchmark | [-] | 290. | |||||||||||||||
| D104 | [-] | 291. | 291. | 292. | 290. | 293. | 0.981 | 1.41 | 0.595 | 0.625 | 0.797 | 0.917 | 0.997 | 0.932 | 0.844 | ||
| LMBIRCH4 | [-] | 291. | 291. | 291. | 290. | 293. | 1.02 | 1.46 | 0.529 | 0.632 | 0.786 | 0.930 | 0.999 | 0.930 | 0.844 | ||
| PHSParam | [-] | 291. | 291. | 291. | 290. | 293. | 1.04 | 1.47 | 0.538 | 0.628 | 0.786 | 0.930 | 0.999 | 0.930 | 0.843 | ||
| PPE | [-] | 291. | 291. | 291. | 290. | 293. | 0.989 | 1.44 | 0.557 | 0.638 | 0.785 | 0.926 | 0.999 | 0.931 | 0.844 | ||
| R15 | [-] | 291. | 291. | 291. | 290. | 293. | 1.09 | 1.51 | 0.539 | 0.620 | 0.785 | 0.929 | 0.999 | 0.931 | 0.841 |
Download Data |
Period Mean (original grids) [K] |
Model Period Mean (intersection) [K] |
Model Period Mean (complement) [K] |
Benchmark Period Mean (intersection) [K] |
Benchmark Period Mean (complement) [K] |
Bias [K] |
RMSE [K] |
Phase Shift [months] |
Bias Score [1] |
RMSE Score [1] |
Seasonal Cycle Score [1] |
Spatial Distribution Score [1] |
Interannual Variability Score [1] |
Overall Score [1] |
|||
|---|---|---|---|---|---|---|---|---|---|---|---|---|---|---|---|---|---|
| Benchmark | [-] | 278. | |||||||||||||||
| D104 | [-] | 279. | 279. | 284. | 278. | 280. | 1.43 | 3.07 | 0.178 | 0.531 | 0.785 | 0.985 | 0.998 | 0.896 | 0.830 | ||
| LMBIRCH4 | [-] | 279. | 279. | 283. | 278. | 280. | 1.48 | 3.08 | 0.184 | 0.533 | 0.771 | 0.984 | 0.998 | 0.914 | 0.829 | ||
| PHSParam | [-] | 279. | 279. | 283. | 278. | 280. | 1.48 | 3.08 | 0.170 | 0.533 | 0.770 | 0.985 | 0.998 | 0.914 | 0.829 | ||
| PPE | [-] | 279. | 279. | 283. | 278. | 280. | 1.46 | 3.07 | 0.170 | 0.535 | 0.770 | 0.985 | 0.998 | 0.914 | 0.829 | ||
| R15 | [-] | 279. | 279. | 283. | 278. | 280. | 1.53 | 3.10 | 0.156 | 0.531 | 0.771 | 0.986 | 0.998 | 0.914 | 0.829 |
Temporally integrated period mean